Onion and Shallot Green Market

Onion and Shallot Green Market size was USD 15.32 Billion in 2025 and is projected to reach USD 20.06 Billion by 2035, growing at a 2.73% CAGR from 2026 to 2035

Download Free Sample PDF
Base Year (2025)
$15.74 Billion
Forecast (2035)
$20.06 Billion
CAGR (2026-2035)
2.7%
Top Region
Asia-Pacific

What Is the Onion and Shallot Green Market Size?

The global Onion and Shallot Green Market size reached USD 15.32 Billion in 2025 and is estimated at USD 15.74 Billion in 2026, forecast to reach USD 20.06 Billion by 2035 at a CAGR of 2.73% between 2026 and 2035. Asia-Pacific leads with an approximate 34% share, while Green Onions dominate the product-type segment at approximately 68% share in 2025.

We observed that easing grower prices across major fresh vegetable categories in 2025, reflecting more favorable growing conditions than the prior year, are stabilizing category economics even as organic and protected-cultivation production methods continue gaining share within the broader, more mature conventional segment.

Onion and Shallot Green Market Revenue Forecast

Values in USD Billion

2025 $15.74 Billion
2025
2026 $16.17 Billion
2026
2027 $16.61 Billion
2027
2028 $17.06 Billion
2028
2029 $17.53 Billion
2029
2030 $18.01 Billion
2030
2031 $18.50 Billion
2031
2032 $19.01 Billion
2032
2033 $19.52 Billion
2033
2034 $20.06 Billion
2034
2035 $20.06 Billion
2035

Key Takeaways

By Product Type: Green Onions dominated, expanding from USD 10.42 billion in 2025 to USD 13.04 billion by 2035; Shallots is the fastest-growing product type at a 3.75% CAGR from 2026–2035.

By Production Method: Conventional dominated, expanding from USD 12.57 billion in 2025 to USD 15.05 billion by 2035; Organic is the fastest-growing production method at a 6.90% CAGR from 2026–2035.

By Distribution Channel: Retail dominated, expanding from USD 7.05 billion in 2025 to USD 8.63 billion by 2035; Export is the fastest-growing distribution channel at a 7.42% CAGR from 2026–2035.

Dominant Region: Asia-Pacific dominated with approximately 34% revenue share in 2025.

Fastest-Growing Region: Middle East & Africa is expected to register the highest CAGR of 5.27% during 2026–2035.

Dominant Country: China led the market, anchored by concentrated production acreage and strong domestic consumption.

Fastest-Growing Country: India is expected to be the fastest-growing country, supported by expanding onion and shallot production, rising domestic consumption, and growing export activity.

The market presents an absolute investment opportunity of approximately USD 4.32 Billion between 2026 and 2035, calculated as the difference between the 2035 forecast of USD 20.06 Billion and the 2026 base of USD 15.74 Billion, positioning organic production capacity and export-oriented supply chains as a steady, long-cycle investment category for fresh produce growers and processors.

According to NMSC analysis, the segment's stability reflects its position as a food staple with inelastic demand, where growth is increasingly concentrated in premium organic and value-added processed formats rather than in overall volume expansion of the underlying conventional crop.

What does the Onion and Shallot Green Market Encompass?

The Onion and Shallot Green Market covers fresh and processed green onions and shallots produced under conventional, organic, and protected cultivation methods, packaged in bunched, bagged, bulk carton, clamshell, and processed formats for retail, foodservice, food manufacturing, wholesale, and export distribution. We observed that the market has evolved from a predominantly fresh, bunched commodity category into one increasingly supplying food manufacturing customers with fresh cut, frozen, and dehydrated formats suited to processed food and foodservice applications.
Our findings suggest that USDA National Agricultural Statistics Service production and price reporting remains the primary structural reference shaping grower planting and marketing decisions across the U.S. supply base, with 2025 conditions showing more favorable growing weather than 2024 across several major fresh vegetable categories. Technology adoption trends toward protected cultivation and extended cold-chain logistics are further supporting more consistent year-round supply availability across export-oriented growing regions.

Market Drivers & Dynamics

Interactive Dataset
Rising organic and premium production adoption driver +1.1% North America, Europe 2026–2035
Growing foodservice demand for value-added processed formats driver +0.9% Global 2026–2032
Expanding export market diversification driver +0.7% Asia-Pacific, Latin America 2026–2033
Increasing protected cultivation for consistent year-round supply driver +0.5% Europe, Asia-Pacific 2026–2031
Stable staple-food demand supporting baseline consumption driver +0.4% Global 2026–2035
Grower price volatility tied to weather and growing conditions restraint −0.6% North America, Europe 2026–2030
Water and drought constraints in key growing regions restraint −0.5% North America, MEA 2026–2032
Perishability limiting extended shelf life and transport range restraint −0.4% Global 2026–2035
Import competition pressuring domestic grower pricing restraint -0.3% North America, Europe 2026–2031
Source: Next Move Strategy Consulting

Growth Drivers

What is the Primary Growth Driver of the Onion and Shallot Green Market?

The primary growth driver is rising organic and premium production adoption within an otherwise mature, staple-demand category. USDA National Agricultural Statistics Service data reported 2024 U.S. onion production at approximately 77.14 million hundredweight, with Idaho, Oregon, and Washington onion values collectively reaching USD 942 million in 2024, up from the prior year, evidencing sustained baseline production even as growth increasingly concentrates in premium and organic segments.

How is Value-Added Processing Driving the Market Growth?

Our analysis shows that value-added processing is directly driving market growth as foodservice and food manufacturing buyers increasingly favor fresh cut, frozen, and dehydrated formats over whole bunched product. USDA Economic Research Service reporting on 2025 fresh vegetable market conditions noted mixed but generally favorable growing conditions supporting adequate supply for processing-oriented demand growth relative to 2024.

Growth Inhibitors

What is Restraining the Onion and Shallot Green Market?

We found that the primary restraint is grower price volatility tied to weather and growing conditions, with USDA reporting broadly lower 2025 grower prices for onions and several other key fresh vegetable crops compared to 2024 due to more favorable growing conditions that increased supply. Industry-derived estimates suggest that drought conditions affecting parts of key growing regions, including northern Florida, also continue to introduce localized supply risk.

Segmentation Analysis

2025 (USD Billion)
2035 (USD Billion)
Green Onions 2025: $10.42 Billion | 2035: $13.04 Billion
Green Onions
Shallots 2025: $4.90 Billion | 2035: $7.02 Billion
Shallots
Green Onions $10.42 Billion $13.04 Billion 2.22%
Shallots $4.90 Billion $7.02 Billion 3.75%

Which Product Type Segment Dominates the Onion and Shallot Green Market?

Green Onions lead with USD 10.42 Billion in 2025, expanding to USD 13.04 Billion by 2035, reflecting their broader culinary use across a wider range of cuisines and retail categories than shallots. Shallots are the fastest-growing product type at a 3.75% CAGR, as rising culinary interest in shallots for both home cooking and premium foodservice applications continues to expand demand faster than the larger, more mature green onion category.

2025 (USD Billion)
2035 (USD Billion)
Conventional
Organic
Protected Cu
Segment Item 2025 (USD Billion) 2035 (USD Billion) CAGR
Conventional $10.0 USD Billion $40.0 USD Billion 25.0%
Organic $17.1 USD Billion $51.1 USD Billion 11.0%
Protected Cultivation $24.2 USD Billion $62.2 USD Billion 25.0%

Segment-wise data is locked

Unlock complete segment-wise numbers for By Production Method.

Unlock Full Data

Which Production Method Leads and Which Grows Fastest in the Onion and Shallot Green Market?

Conventional production dominates at USD 12.57 Billion in 2025, reflecting its continued role as the baseline production method across the vast majority of global growing acreage. Organic is the fastest-growing production method at a 6.90% CAGR, as consumer willingness to pay premium pricing for organically certified fresh produce continues to outpace growth in the broader conventional segment.

2025 (USD Billion)
2035 (USD Billion)
Retail
Foodservice
Food Manufac
Wholesale
Export
Segment Item 2025 (USD Billion) 2035 (USD Billion) CAGR
Retail $10.0 USD Billion $40.0 USD Billion 27.0%
Foodservice $17.1 USD Billion $51.1 USD Billion 9.0%
Food Manufacturing $24.2 USD Billion $62.2 USD Billion 19.0%
Wholesale $31.3 USD Billion $73.3 USD Billion 17.0%
Export $38.4 USD Billion $84.4 USD Billion 18.0%

Segment-wise data is locked

Unlock complete segment-wise numbers for By Distribution Channel.

Unlock Full Data

Which Distribution Channel Dominates and Which is Fastest-Growing in the Onion and Shallot Green Market?

Retail leads distribution at USD 7.05 Billion in 2025, reflecting the category's position as a household culinary staple purchased regularly through grocery and supermarket channels. Export is the fastest-growing distribution channel at a 7.42% CAGR, as growers in established production regions increasingly diversify into international markets to offset domestic grower price volatility and access premium pricing in import-dependent markets.

2025 (USD Billion)
2035 (USD Billion)
Bunched
Bagged
Bulk Carton
Clamshell
Processed Pa
Segment Item 2025 (USD Billion) 2035 (USD Billion) CAGR
Bunched $10.0 USD Billion $40.0 USD Billion 14.0%
Bagged $17.1 USD Billion $51.1 USD Billion 24.0%
Bulk Carton $24.2 USD Billion $62.2 USD Billion 22.0%
Clamshell $31.3 USD Billion $73.3 USD Billion 12.0%
Processed Pack $38.4 USD Billion $84.4 USD Billion 27.0%

Segment-wise data is locked

Unlock complete segment-wise numbers for By Packaging Format.

Unlock Full Data
2025 (USD Billion)
2035 (USD Billion)
Household
Restaurants
Food Process
Institutiona
Segment Item 2025 (USD Billion) 2035 (USD Billion) CAGR
Household $10.0 USD Billion $40.0 USD Billion 24.0%
Restaurants and Catering $17.1 USD Billion $51.1 USD Billion 22.0%
Food Processors $24.2 USD Billion $62.2 USD Billion 20.0%
Institutional Buyers $31.3 USD Billion $73.3 USD Billion 22.0%

Segment-wise data is locked

Unlock complete segment-wise numbers for By End User.

Unlock Full Data

Supply Chain Analysis of the Onion and Shallot Green Industry

Supply Chain Analysis of the Onion and Shallot Green Industry
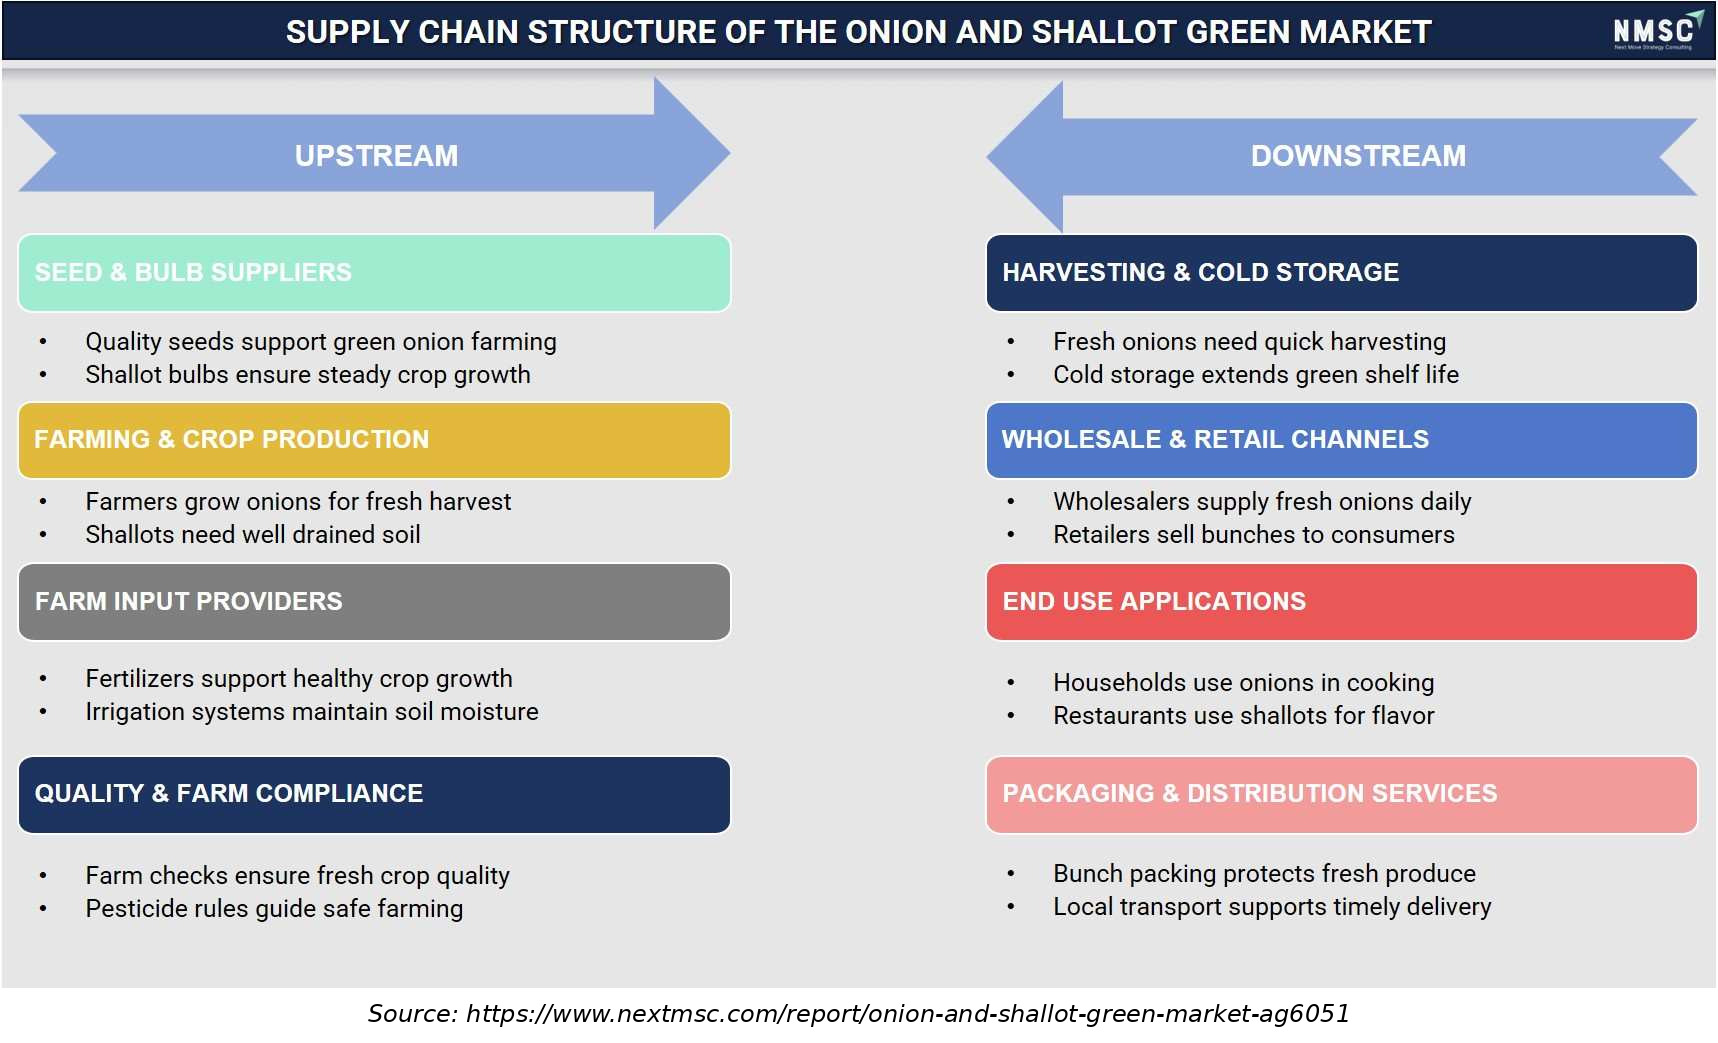
The above infographic presents the supply chain structure of the green onions and shallots market, segmented into upstream and downstream activities. Quality seeds and bulbs support farming, with fertilizers and irrigation ensuring healthy crop growth. Further, compliance with pesticide regulations and quality checks ensures safety. Downstream, harvesting and cold storage preserve freshness, while wholesalers and retailers supply households and restaurants. Looking ahead, we observed that bunch packaging and local transport remain essential for maintaining product quality and timely delivery to end consumers.

Growth Opportunities

Our analysis shows that three whitespace opportunities stand out for growers and processors positioning ahead of 2035 demand.

Can Protected Cultivation Expansion Unlock Year-Round Premium Supply?

Growers that expand protected cultivation capacity can capture premium pricing from foodservice and retail buyers seeking consistent year-round supply independent of seasonal field conditions, benefiting the Protected Cultivation production method segment as buyers increasingly value supply reliability.

Does Value-Added Processing Investment Create Value for Food Manufacturing Customers?

Processors that expand fresh cut, frozen, and dehydrated processing capacity can capture rising demand from food manufacturing customers seeking labor-reducing inputs, benefiting the Processed Green Onions and Processed Shallots segments as manufacturers favor pre-processed formats over whole product handling.

Can Export Market Diversification Reduce Grower Price Volatility Exposure?

Growers that build export market relationships across multiple destination countries can reduce exposure to single-market price volatility, benefiting the Export distribution channel as diversified sales channels offer more stable margin structures than domestic-only marketing alone.

Regional Outlook

2025 (USD Billion)
2035 (USD Billion)
Asia-Pacific
North Americ
Europe
Latin Americ
Middle East
Region 2025 (USD Billion) 2035 (USD Billion) CAGR (%)
Asia-Pacific $10.0 USD Billion $40.0 USD Billion 9.0%
North America $17.1 USD Billion $51.1 USD Billion 27.0%
Europe $24.2 USD Billion $62.2 USD Billion 25.0%
Latin America $31.3 USD Billion $73.3 USD Billion 23.0%
Middle East & Africa $38.4 USD Billion $84.4 USD Billion 12.0%

Regional data is locked

Unlock complete regional numbers for this market.

Unlock Full Data

Competitive Landscape

Our assessment indicates that the competitive landscape spans diversified global fresh produce conglomerates, regional grower-shippers, and specialized processors, each competing on production scale, distribution reach, and processed-format capability. Key Takeaways

Dimension Description
Dimension Assessment
Market Structure Fragmented; top 10 companies hold a meaningful but not dominant share of Market Share, reflecting a mix of global fresh produce conglomerates and regional grower-shippers
Innovation Focus Protected cultivation expansion, value-added processed formats, organic certification, and export market diversification
M&A Activity Selective regional consolidation among grower-shippers rather than large-scale industry-wide consolidation given the fragmented, regionally concentrated nature of production

How Do Companies Compete in the Onion and Shallot Green Market?

Companies compete primarily on production scale and growing region diversification, breadth of processed-format capability across fresh cut, frozen, and dehydrated products, and depth of retail and foodservice distribution relationships. Our findings suggest that vendors with multi-region growing operations hold a structural advantage over single-region competitors, since buyers increasingly favor suppliers who can guarantee year-round supply continuity.

Which Competitive Archetypes Dominate the Onion and Shallot Green Market?

Diversified global fresh produce conglomerates such as Dole plc and Fresh Del Monte Produce dominate through broad multi-crop distribution infrastructure, while specialized regional grower-shippers including Gills Onions and Peri & Sons Farms differentiate through focused onion and shallot growing and processing expertise. European specialists such as Waterman Onions and Wiskerke Onions compete on deep regional grower relationships underserved by global conglomerates.

What Innovation and Differentiation Strategies Are Companies Pursuing?

We observed that leading companies are investing in protected cultivation infrastructure and value-added processing capacity to extend addressable demand beyond seasonal fresh whole product sales. Differentiation increasingly rests on organic certification and processed-format breadth, since foodservice and food manufacturing buyers increasingly specify these attributes in procurement decisions.

What M&A and Partnership Activity Is Shaping the Industry?

Recent activity favors organic growing-capacity expansion and regional distribution partnerships over large-scale consolidation, reflecting the fragmented, regionally concentrated structure of the underlying growing base. Our analysis shows that established grower-shippers are prioritizing processing capacity investment over acquisitions, given the localized nature of production relative to more centralized manufacturing-based industries.

Key Market Players

Based on research conducted by NMSC, the following companies represent the validated set of leading participants across green onion and shallot growing, processing, and distribution.

Dole plc Fresh Del Monte Produce Inc. Greenyard NV Bonduelle SCA Taylor Fresh Foods, Inc. Tanimura & Antle, Inc. Church Brothers, LLC Duda Farm Fresh Foods, Inc. Gills Onions, LLC Peri & Sons Farms, Inc. River Point Farms, LLC Waterman Onions B.V. Wiskerke Onions B.V. Oldershaw Group Mitolo Group Pty Ltd Potandon Produce, L.L.C. Wada Farms, Inc. Baker & Murakami Produce Company Eagle Eye Produce, Inc. Oomen Onions B.V.

Latest Developments

We found that recent sector activity reflects mixed but generally favorable 2025 growing conditions across major fresh vegetable categories, according to official USDA reporting.

Date Event
April 2025 Eagle Eye Produce acquired one of the largest and most advanced onion packing facilities in the Pacific Northwest, previously operated by Baker & Murakami in Ontario, Oregon.

Consumer Behavior Analysis of the Onion and Shallot Green Industry

Consumer Behavior Analysis of the Onion and Shallot Green Industry

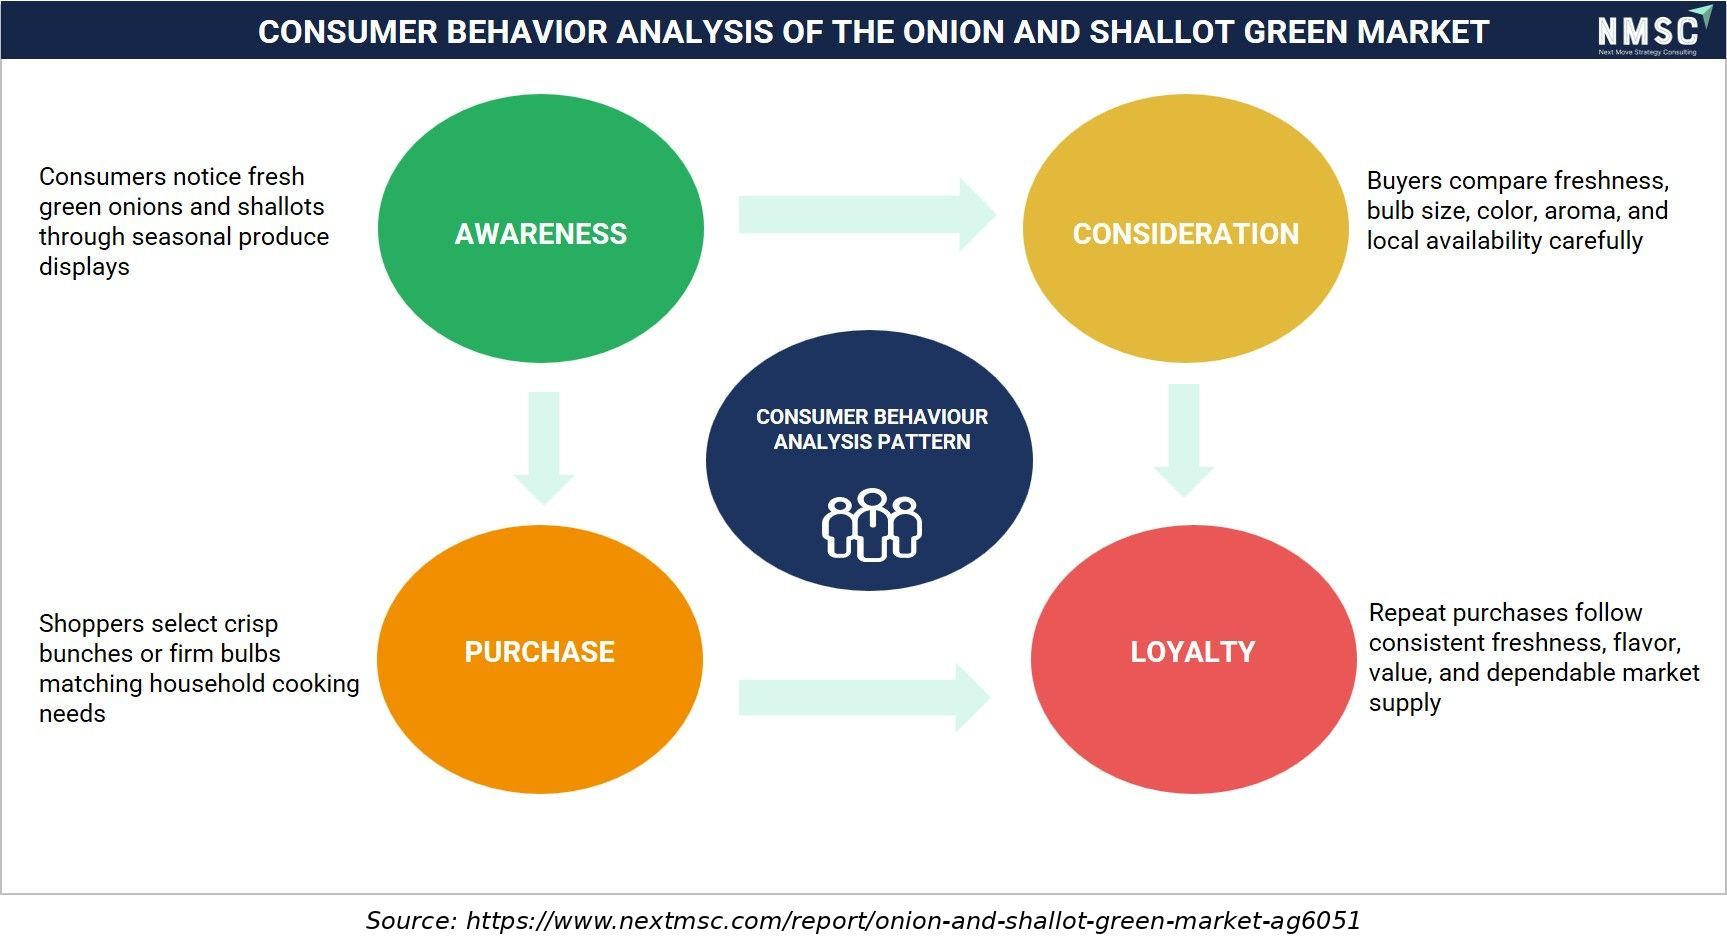
The above infographic presents a consumer behavior analysis of the fresh green onions and shallots market, mapping the journey from awareness to loyalty. Consumers notice these produce items through seasonal displays, leading them to evaluate freshness, bulb size, color, and aroma before making selections based on cooking needs. Once satisfied with consistent quality and flavor, repeat purchases follow, driven by dependable supply and value. Looking ahead, we observed that product freshness and market reliability remain central to sustaining consumer trust and long-term brand preference.

The above infographic presents a consumer behavior analysis of the fresh green onions and shallots market, mapping the journey from awareness to loyalty. Consumers notice these produce items through seasonal displays, leading them to evaluate freshness, bulb size, color, and aroma before making selections based on cooking needs. Once satisfied with consistent quality and flavor, repeat purchases follow, driven by dependable supply and value. Looking ahead, we observed that product freshness and market reliability remain central to sustaining consumer trust and long-term brand preference.

Investment Opportunities

Where Are Capital Inflows Concentrating in the Onion and Shallot Green Market?

Capital is concentrating in organic production capacity and value-added processing infrastructure, the two areas generating the strongest recent demand growth relative to the broader conventional segment. Sustained USDA-reported organic and premium category growth signals continued capital allocation toward differentiated production capability among established grower-shippers.

How Is Infrastructure Investment Shaping Long-Term Capacity?

Our findings suggest that infrastructure investment is shifting toward protected cultivation and expanded cold-chain logistics that support more consistent year-round supply availability. This shift favors growers with existing multi-region operations that can integrate protected cultivation capacity without full operational redesign.

What ESG Considerations Are Influencing Investment Decisions?

Environmental, Social, and Governance considerations in this market center on water use efficiency and drought resilience, given documented drought conditions affecting parts of key growing regions, including northern Florida, in 2025. We found that investors increasingly favor growers demonstrating water-efficient irrigation practices and organic certification as a proxy for durable, climate-resilient production capacity.

Key Benefits for Stakeholders

How Does This Report Benefit Industry Leaders?

Industry leaders gain segment-level revenue forecasts and CAGR benchmarks across product type, production method, and distribution channel axes, enabling growing-capacity and processing decisions grounded in the same 2025–2035 figures used consistently throughout this analysis. Our findings on regional growth differentials further support market-entry and export-diversification decisions.

How Does This Report Benefit Investors and Financial Analysts?

Investors and financial analysts gain a reconciled market-sizing model, competitive-landscape assessment, and named-company development tracking that supports valuation and capital-allocation decisions. The report's Growth Catalyst & Risk Assessment Matrix quantifies driver and restraint impact on CAGR, aiding scenario analysis for portfolio positioning.

How Does This Report Benefit Technology Vendors and Product Teams?

Technology vendors and product teams gain visibility into which production-method and distribution segments, such as Organic and Export, are growing fastest, informing where to prioritize investment and go-to-market focus through 2035.

Key Market Segments Evaluated

By Product Type

  • Green Onions 
    • Fresh Green Onions
      • Whole Bunched
      • Trimmed and Cleaned
    • Processed Green Onions
      • Fresh Cut
      • Frozen
      • Dried and Dehydrated
      • Pickled and Preserved
      • Other Processed
  • Shallots 
    • Fresh Shallots
      • Whole Shallots
      • Peeled Shallots
    • Processed Shallots
      • Fresh Cut
      • Frozen
      • Dried and Dehydrated
      • Pickled and Preserved
      • Other Processed

By Production Method

  • Conventional
  • Organic
  • Protected Cultivation

By Packaging Format

  • Bunched
  • Bagged
  • Bulk Carton
  • Clamshell
  • Processed Pack

By Distribution Channel

  • Retail
  • Foodservice
  • Food Manufacturing
  • Wholesale
  • Export

By End User

  • Household
  • Restaurants and Catering
  • Food Processors
  • Institutional Buyers

By Region

  • North America 
    • U.S.
    • Canada
    • Mexico
  • Europe 
    • UK
    • Germany
    • France
    • Italy
    • Spain
    • Sweden
    • Denmark
    • Finland
    • Netherlands
    • Rest of Europe
  • Asia-Pacific 
    • China
    • India
    • Japan
    • South Korea
    • Taiwan
    • Indonesia
    • Vietnam
    • Australia
    • Philippines
    • Malaysia
    • Rest of APAC
  • Middle East & Africa 
    • Saudi Arabia
    • UAE
    • Egypt
    • Israel
    • Turkey
    • Nigeria
    • South Africa
    • Rest of MEA
  • Latin America 
    • Brazil
    • Argentina
    • Chile
    • Colombia
    • Rest of LATAM

Conclusion & Recommendations

The long-term outlook remains steadily positive, with the market expanding from USD 15.74 Billion in 2026 to USD 20.06 Billion by 2035 at a 2.73% CAGR, driven by organic production growth and value-added processing adoption. We observed that this growth trajectory is underpinned by stable staple-food demand rather than speculative expansion, supporting steady, moderate-paced investment across the grower and processor base.

What Strategic Positioning Do We Recommend?

Our assessment indicates that growers and processors should prioritize organic production expansion and protected cultivation investment to capture the fastest-growing Organic and Protected Cultivation segments. Companies without established export market relationships should pursue diversified international distribution rather than domestic-only sales given the sector's clear opportunity in the fastest-growing Export channel.

How Attractive Is the Onion and Shallot Green Market for Investment?

Investment attractiveness is high in the Middle East & Africa and Latin America given superior CAGR profiles of 5.27% and 4.53% respectively, while Asia-Pacific offers the largest absolute revenue base with the strongest overall growth trajectory. We found that organic and export revenue streams offer stronger margin and growth profiles than the mature conventional and retail segments alone.

What Are the Key Market Shifts and Risks in the Onion and Shallot Green Market?

Key risks include grower price volatility tied to weather and growing conditions, alongside water and drought constraints affecting key growing regions in North America and the Middle East & Africa. Our analysis shows that growers unable to diversify production methods and distribution channels risk greater exposure to the price volatility that USDA reporting has documented across recent growing seasons.

What Are the Primary Growth Pathways Through 2035?

Primary growth pathways include organic production capacity expansion, deeper value-added processing investment for foodservice and food manufacturing customers, and export market diversification to reduce single-market price exposure. We observed that growers and processors combining all three pathways are best positioned to capture a disproportionate share of the USD 4.32 Billion absolute opportunity created between 2026 and 2035.

FAQs

About the Author

Mayurima Roy

Mayurima Roy

Mayurima Roy is Research Analyst at Next Move Strategy Consulting, where she has spent 4 years working across the firm's full industry coverage rather than a single fixed vertical. Her work centers on structured research, ongoing trend tracking, competitive assessment, and insight-led content development, translating complex market data into clear, decision-ready narratives that support informed client decision-making across diverse global industries, market sectors, and world regions every day.

About the Reviewer

Supradip Baul

Supradip Baul

Supradip Baul is an accomplished business consultant and strategist with over a decade of rich experience in market intelligence, strategy, technology, and business transformation. His work has included rigorous qualitative and quantitative analysis across multiple industries, helping clients shape investment decisions and long-term roadmaps. Earlier in his career, he was associated with Gartner, where he contributed to industry-leading reports and market share analyses. He has worked with leading global companies and holds an MBA with a dual specialization in Marketing and Finance.

Download Free Sample

Henri Knyphausen

HENRI KNYPHAUSEN

Partner at Singulier [Ex-BCG]

Singulier

I recently engaged NEXTMSC.com for a commercial due diligence project within the intralogistics sector, and I am pleased to provide a reference based on my experience. In utilizing NEXTMSC.com's services, I found their report to offer valuable insights into market dynamics and key industry players. The initial report provided a solid foundation for our analysis. However, as we were investigating a smaller target in the market, and I had specific customization requests requiring additional research. These requests included detailed information on product portfolios of various players and sub-market sizes, both inclusive and exclusive of certain product categories. NEXTMSC.com demonstrated commendable responsiveness and agility in accommodating these customization requests. Within a timeframe of 1-2 weeks, they delivered a revised report that met our specific needs. Furthermore, they were receptive to my follow-up inquiries, ensuring clarity and understanding of the data provided. The final deliverable significantly contributed to our due diligence efforts. One of NEXTMSC.com's notable strengths lies in their qualitative research capabilities. However, for future engagements, I would recommend the inclusion of a quantified market model in Excel format. Such a model would offer the ability to conduct in-depth analyses and explore various market segments, including country-specific data and subcomponent breakdowns. Based on my positive experience, I would not hesitate to work with NEXTMSC.com again. Their responsiveness, willingness to accommodate customization requests, and commitment to delivering actionable insights make them a reliable partner for commercial research projects.


Melanie Samko

MELANIE SAMKO

Director of Marketing

TOSOH BIOSCIENCE, INC.

The information provided by NMSC is incredibly valuable, thank you so much for such a excellent work. I really appreciate it. I will make sure to reference all of it, in my summary document.

Amos Chang

AMOS CHANG

Strategy Consultant

Kardex Group

I have bought the intralogistics market reports from NMSC two times so far. Joseph and his team are always very helpful and flexible in responding to any customization requirements on the report. Their expertise in market reports really helps us steer the day-to-day business. I will definitely recommend and come back myself whenever there is a need.

Gaurav Jaiswal

GAURAV JAISWAL

Founder & CEO

Yano Charge Private Limited

The EV Charging market research report provided by the NextMSC was exceptionally detailed and insightful. It offered a comprehensive analysis that proved to be a game-changer for our strategic planning. Truly a testament to the NextMSC’s expertise and thoroughness in EV market landscape & analysis.

Kishu Kanda

KISHU KANDA

Strategy Analyst

Accenture

We purchased the AI Consumer Market Report from this company. Not only did they customize the report to meet our specific requirements, but they also showed great flexibility in accommodating our budget. The report we received fully met our expectations. Additionally, they provided prompt and thorough responses to both our pre-purchase and follow-up questions. We look forward to working with this company again in the future.

Custom Market Research Services

We will customize the research for you if the listed report does not fully match your requirements.

Get 30% Free Customization

Select License

This website uses cookies to ensure you get the best experience on our website. Learn more

✖