Prefabricated Data Center Market Global Industry Analysis and Forecast (2026–2035)

Prefabricated Data Center Market size was USD 21.64 billion in 2026, projected to reach USD 52.45 billion by 2035, growing at a CAGR of 10.34% from 2026 to 2035. Key drivers include AI-driven rack density growth, hyperscale speed-to-power requirements, and factory-integrated liquid cooling, with North America leading the market.

Download Free Sample PDF
Base Year (2025)
$17.80 Billion
Forecast (2035)
$52.45 Billion
CAGR (2026-2035)
10.3%
Top Region
North America

What Is the Prefabricated Data Center Market Size?

The global Prefabricated Data Center Market reached USD 17.80 Billion in 2025, is estimated at USD 21.64 Billion in 2026, and is forecast to reach USD 52.45 Billion by 2035 at a CAGR of 10.34% from 2026 to 2035. North America leads with approximately 38% share, while IT Modules lead product types with approximately 38%.

We observed that demand for factory built power, cooling, and IT modules is shifting from edge pilots toward megawatt scale AI campuses, which raises the value of modules that arrive tested, integrated, and ready for rapid energization.

Prefabricated Data Center Market Global Industry Analysis and Forecast (2026–2035) Revenue Forecast

Values in USD Billion

2025 $17.80 Billion
2025
2026 $21.64 Billion
2026
2027 $23.88 Billion
2027
2028 $26.35 Billion
2028
2029 $29.07 Billion
2029
2030 $32.08 Billion
2030
2031 $35.39 Billion
2031
2032 $39.05 Billion
2032
2033 $43.09 Billion
2033
2034 $47.55 Billion
2034
2035 $52.45 Billion
2035

Key Takeaways

By Product Type: IT Modules held the largest share, increasing from USD 6.58 billion in 2025 to USD 19.77 billion by 2035. Cooling Modules are the fastest-growing segment, with a CAGR of 11.94% from 2026 to 2035.

By Form Factor: Containerized systems held the largest share, growing from USD 10.68 billion in 2025 to USD 27.27 billion by 2035. Uncontainerized systems are the fastest-growing segment, with a CAGR of 12.35% from 2026 to 2035.

By Capacity: Above 500 kW to 2 MW held the largest share, increasing from USD 5.34 billion in 2025 to USD 12.59 billion by 2035. Systems above 10 MW are the fastest-growing segment, with a CAGR of 18.34% from 2026 to 2035.

By Cooling Technology: Air-Only held the largest share, growing from USD 10.33 billion in 2025 to USD 14.69 billion by 2035. Direct Liquid cooling is the fastest-growing segment, with a CAGR of 19.98% from 2026 to 2035.

By Deployment: Outdoor deployment held the largest share, increasing from USD 9.97 billion in 2025 to USD 31.47 billion by 2035. It is also the fastest-growing segment, with a CAGR of 11.10% from 2026 to 2035.

By Sales Channel: OEM Sales held the largest share, growing from USD 14.60 billion in 2025 to USD 39.86 billion by 2035. Aftermarket Sales are the fastest-growing channel, with a CAGR of 13.49% from 2026 to 2035.

By End User: Cloud Service Providers held the largest share, increasing from USD 6.05 billion in 2025 to USD 22.55 billion by 2035. They are also the fastest-growing end-user segment, with a CAGR of 12.93% from 2026 to 2035.

Dominant Region: North America held approximately 38% of the global market in 2025, with revenue of USD 6.73 billion, and is projected to reach USD 21.02 billion by 2035.

Fastest-Growing Region: Middle East & Africa is the fastest-growing region, with a CAGR of 13.22% from 2026 to 2035, increasing from USD 1.08 billion in 2025 to USD 4.13 billion by 2035.

Dominant Country: The United States held approximately 33% of global revenue in 2025, with a market size of USD 5.87 billion, and is projected to reach USD 18.30 billion by 2035.

Fastest-Growing Country: South Africa is the fastest-growing country, with a projected CAGR of 16.74% from 2026 to 2035, increasing from approximately USD 0.10 billion in 2025 to USD 0.51 billion by 2035.

The Prefabricated Data Center Market presents an absolute investment opportunity of approximately USD 30.81 Billion between 2026 and 2035, calculated as the 2035 forecast of USD 52.45 Billion minus the 2026 base of USD 21.64 Billion, which makes liquid cooled power and cooling modules for megawatt scale campuses the most capital efficient categories for infrastructure investors.

According to NMSC analysis, the shift of electrical and thermal scope from construction sites into factories is the most structurally significant development in this market. Operators can order repeatable power and cooling blocks while utility interconnection, foundations, and building work proceed in parallel, which shortens the path from capital approval to energized capacity.

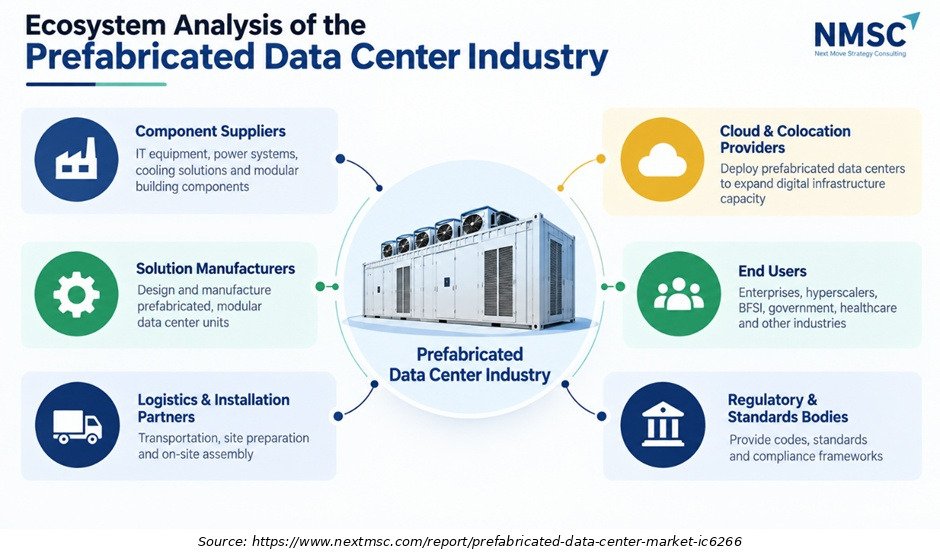
Ecosystem Analysis of the Prefabricated Data Center Industry

The infographic illustrates the ecosystem of the prefabricated data center industry, highlighting the key roles of component suppliers, solution manufacturers, logistics and installation partners, cloud and colocation providers, end users, and regulatory bodies. The central visualization emphasizes the prefabricated data center as the core of the ecosystem, demonstrating how collaboration among stakeholders supports efficient deployment, scalable infrastructure, and reliable digital services.

What does the Prefabricated Data Center Market Encompass?

The Prefabricated Data Center Market covers factory engineered and tested IT, power, cooling, and ancillary modules that operators deploy as containerized or uncontainerized units, from edge enclosures below 100 kW to campus scale blocks above 10 MW. This market report measures revenue from module sales through OEM and aftermarket channels across indoor and outdoor deployments. It excludes conventional site built white space, land, and shell construction, so the analysis isolates the value of prefabricated equipment and its integration.
The Prefabricated Data Center market has evolved from containerized edge units toward standardized power skids, prefabricated data halls, and liquid cooled blocks sized for AI clusters. Regulation increasingly shapes design choices, because the recast EU Energy Efficiency Directive requires reporting from data centers of 500 kW or more and a common rating scheme was proposed on 21 September 2026. Our findings suggest that direct liquid and hybrid cooling, together with digital commissioning tools, now set the technology baseline for new modules.

Market Drivers & Dynamics

Interactive Dataset
AI and HPC rack density growth requiring larger, standardized power and cooling blocks driver +4.2% Global 2026–2035
Hyperscale and neocloud demand for faster energization than site built construction driver +3.1% North America, Asia-Pacific, Middle East & Africa 2026–2033
Factory integration of direct liquid and hybrid cooling in prefabricated modules driver +2.4% Global 2026–2032
Edge, telecom, and sovereign AI deployments needing containerized units driver +1.8% Asia-Pacific, Middle East & Africa, North America 2026–2032
Skilled construction labor shortages and cost inflation in site built facilities driver +1.4% North America, Europe, Australia 2026–2031
EU energy reporting and rating rules favoring efficient factory tested designs driver +0.7% Europe 2026–2035
Grid interconnection delays limiting energization of completed modules restraint −1.3% Global 2026–2035
Customization demands reducing factory repeatability and raising unit cost restraint −0.8% Global 2026–2032
Supply constraints for switchgear, transformers, and UPS components restraint −0.7% North America, Europe 2026–2030
Higher upfront cost and financing hurdles in emerging regions restraint −0.5% Latin America, Middle East & Africa 2026–2031
Source: Next Move Strategy Consulting

Growth Drivers

What Is the Primary Growth Driver in the Prefabricated Data Center Industry?

AI driven electricity demand is the primary structural driver of growth. Global data center electricity consumption is projected to rise from about 415 TWh in 2024 to around 945 TWh by 2030, and U.S. data centers used about 4.4% of national electricity in 2023. Operators cannot add this capacity quickly with site built methods, so repeatable factory modules capture a growing share of megawatt scale projects and sustain demand through 2035.

How Is Speed to Power Driving the Prefabricated Data Center Market?

Speed to power is the second driver. Europe aims to triple its data center capacity over the next five to seven years, and North American hyperscalers face similar schedule pressure (industry derived estimate). Factory production lets power, cooling, and IT modules be built while foundations and utility connections proceed on site, which shortens timelines. Vertiv launched OneCore on 5 August 2025 for prefabricated builds of 5 MW and above, reflecting this demand trend.

Growth Inhibitors

What Is Restraining the Prefabricated Data Center Market?

During our Prefabricated Data Center market evaluation, we noticed that grid interconnection delays and component shortages are the main restraints. Building modules faster does not create utility capacity, so energization still depends on transformer, switchgear, and substation availability. We estimate that grid and supply constraints together reduce potential market growth by about 2.0 percentage points a year, while customization requirements further limit factory repeatability.

What Are the Growth Opportunities?

Can Liquid Cooled Power and Cooling Blocks Capture the AI Buildout Wave?

Vendors that sell coolant distribution units, manifolds, and power skids as one tested block can capture spending from cloud operators upgrading to GPU racks. Direct Liquid modules grow at 19.98% CAGR from 2026 to 2035, and Cloud Service Providers are the primary buyers. Eaton’s Boyd Thermal acquisition shows suppliers positioning for this integrated sale.

Does the Aftermarket Offer a Recurring Revenue Pool Beyond Initial Module Sales?

The installed base of prefabricated modules creates demand for refresh, retrofit, and service contracts that OEM sales alone do not capture. Aftermarket Sales grow at 13.49% CAGR from 2026 to 2035 versus 9.50% for OEM Sales, and Enterprises and Colocation Providers operating older units are the main beneficiaries. Vertiv bundles global commissioning and maintenance support with OneCore, a model other vendors can replicate.

Can Megawatt Scale Prefabricated Blocks Unlock Campuses in Emerging Regions?

Standardized power blocks shipped from regional factories let operators in regions with limited skilled labor build megawatt scale campuses without a full local construction supply chain. The Above 10 MW capacity band grows at 18.34% CAGR from 2026 to 2035, and Middle East & Africa leads regional growth at 13.22%. Sovereign cloud programs and colocation developers in Saudi Arabia, the UAE, and South Africa are the main beneficiaries.

Segmentation Analysis

2025 (USD Billion)
2035 (USD Billion)
IT Modules 2025: $6.58 Billion | 2035: $19.77 Billion
IT Modules
Power Modules 2025: $5.08 Billion | 2035: $13.97 Billion
Power Module
Cooling Modules 2025: $3.65 Billion | 2035: $12.45 Billion
Cooling Modu
Other Modules 2025: $2.49 Billion | 2035: $6.27 Billion
Other Module
IT Modules $6.58 Billion $19.77 Billion 10.54%
Power Modules $5.08 Billion $13.97 Billion 9.58%
Cooling Modules $3.65 Billion $12.45 Billion 11.94%
Other Modules $2.49 Billion $6.27 Billion 8.62%

Which Product Type Leads the Market and Which Is Growing Fastest?

IT Modules lead the global prefabricated data center market, with revenue of USD 6.58 billion in 2025, representing approximately 37.0% of the total market, and are projected to reach USD 19.77 billion by 2035. Their leading position reflects demand for integrated IT infrastructure, including racks, compute enclosures, and associated equipment. Cooling Modules are the fastest-growing segment, with a projected CAGR of 11.94% from 2026 to 2035, followed by IT Modules at 10.54%. Increasing cooling requirements associated with high-density computing and AI workloads support demand for prefabricated cooling infrastructure. Other Modules are projected to grow at a CAGR of 8.62% over the same period. (Industry-derived estimate; NMSC analysis.n

2025 (USD Billion)
2035 (USD Billion)
Category A
Category B
Category C
Category D
Segment Item 2025 (USD Billion) 2035 (USD Billion) CAGR
Category A $10.0 USD Billion $40.0 USD Billion 16.0%
Category B $17.1 USD Billion $51.1 USD Billion 26.0%
Category C $24.2 USD Billion $62.2 USD Billion 24.0%
Category D $31.3 USD Billion $73.3 USD Billion 26.0%

Segment-wise data is locked

Unlock complete segment-wise numbers for By Form Factor.

Unlock Full Data
2025 (USD Billion)
2035 (USD Billion)
Category A
Category B
Category C
Category D
Segment Item 2025 (USD Billion) 2035 (USD Billion) CAGR
Category A $10.0 USD Billion $40.0 USD Billion 14.0%
Category B $17.1 USD Billion $51.1 USD Billion 24.0%
Category C $24.2 USD Billion $62.2 USD Billion 14.0%
Category D $31.3 USD Billion $73.3 USD Billion 8.0%

Segment-wise data is locked

Unlock complete segment-wise numbers for By Capacity.

Unlock Full Data
2025 (USD Billion)
2035 (USD Billion)
Category A
Category B
Category C
Category D
Segment Item 2025 (USD Billion) 2035 (USD Billion) CAGR
Category A $10.0 USD Billion $40.0 USD Billion 21.0%
Category B $17.1 USD Billion $51.1 USD Billion 15.0%
Category C $24.2 USD Billion $62.2 USD Billion 13.0%
Category D $31.3 USD Billion $73.3 USD Billion 23.0%

Segment-wise data is locked

Unlock complete segment-wise numbers for By Cooling Technology.

Unlock Full Data
2025 (USD Billion)
2035 (USD Billion)
Category A
Category B
Category C
Category D
Segment Item 2025 (USD Billion) 2035 (USD Billion) CAGR
Category A $10.0 USD Billion $40.0 USD Billion 10.0%
Category B $17.1 USD Billion $51.1 USD Billion 24.0%
Category C $24.2 USD Billion $62.2 USD Billion 26.0%
Category D $31.3 USD Billion $73.3 USD Billion 20.0%

Segment-wise data is locked

Unlock complete segment-wise numbers for By Deployment.

Unlock Full Data
2025 (USD Billion)
2035 (USD Billion)
Category A
Category B
Category C
Category D
Segment Item 2025 (USD Billion) 2035 (USD Billion) CAGR
Category A $10.0 USD Billion $40.0 USD Billion 24.0%
Category B $17.1 USD Billion $51.1 USD Billion 10.0%
Category C $24.2 USD Billion $62.2 USD Billion 8.0%
Category D $31.3 USD Billion $73.3 USD Billion 14.0%

Segment-wise data is locked

Unlock complete segment-wise numbers for By Sales Channel.

Unlock Full Data
2025 (USD Billion)
2035 (USD Billion)
Category A
Category B
Category C
Category D
Segment Item 2025 (USD Billion) 2035 (USD Billion) CAGR
Category A $10.0 USD Billion $40.0 USD Billion 26.0%
Category B $17.1 USD Billion $51.1 USD Billion 16.0%
Category C $24.2 USD Billion $62.2 USD Billion 18.0%
Category D $31.3 USD Billion $73.3 USD Billion 8.0%

Segment-wise data is locked

Unlock complete segment-wise numbers for By End User.

Unlock Full Data

Growth Opportunities

NMSC’s analysis indicates that three whitespace opportunities are positioned to generate disproportionate revenue for vendors that invest ahead of buyer demand in each category.

Can Liquid Cooled Power and Cooling Blocks Capture the AI Buildout Wave?

Vendors that sell coolant distribution units, manifolds, and power skids as one tested block can capture spending from cloud operators upgrading to GPU racks. Direct Liquid modules grow at 19.98% CAGR from 2026 to 2035, and Cloud Service Providers are the primary buyers. Eaton’s Boyd Thermal acquisition shows suppliers positioning for this integrated sale.

Does the Aftermarket Offer a Recurring Revenue Pool Beyond Initial Module Sales?

The installed base of prefabricated modules creates demand for refresh, retrofit, and service contracts that OEM sales alone do not capture. Aftermarket Sales grow at 13.49% CAGR from 2026 to 2035 versus 9.50% for OEM Sales, and Enterprises and Colocation Providers operating older units are the main beneficiaries. Vertiv bundles global commissioning and maintenance support with OneCore, a model other vendors can replicate.

Can Megawatt Scale Prefabricated Blocks Unlock Campuses in Emerging Regions?

Standardized power blocks shipped from regional factories let operators in regions with limited skilled labor build megawatt scale campuses without a full local construction supply chain. The Above 10 MW capacity band grows at 18.34% CAGR from 2026 to 2035, and Middle East & Africa leads regional growth at 13.22%. Sovereign cloud programs and colocation developers in Saudi Arabia, the UAE, and South Africa are the main beneficiaries.

Regional Outlook

2025 (USD Billion)
2035 (USD Billion)
North Americ
Europe
Asia-Pacific
Middle East
Latin Americ
Region 2025 (USD Billion) 2035 (USD Billion) CAGR (%)
North America $10.0 USD Billion $40.0 USD Billion 9.0%
Europe $17.1 USD Billion $51.1 USD Billion 27.0%
Asia-Pacific $24.2 USD Billion $62.2 USD Billion 25.0%
Middle East & Africa $31.3 USD Billion $73.3 USD Billion 23.0%
Latin America $38.4 USD Billion $84.4 USD Billion 12.0%

Regional data is locked

Unlock complete regional numbers for this market.

Unlock Full Data

Competitive Landscape

Our assessment indicates that the Prefabricated Data Center industry is moderately fragmented across three competitive archetypes, with competitive intensity rising as AI infrastructure spending draws power, cooling, and IT vendors into integrated modular offerings.

Dimension Description
Market Structure Moderately fragmented; integrated power and thermal majors hold the largest installed base, while IT stack vendors and specialist prefabricators compete in modules and integrated systems.
Innovation Focus Standardized megawatt scale power blocks, factory integrated liquid cooling, and digital twin based commissioning.
M&A Activity Strategic acquisitions of modular power and liquid cooling specialists, including Eaton’s Fibrebond and Boyd Thermal deals and nVent’s agreement for Maverick Power.

How Do Companies Compete in the Prefabricated Data Center Market?

Companies compete on speed to energization, integration breadth, power density, service coverage, and price per megawatt. Catalog style products from Schneider Electric and Vertiv let buyers order standard blocks at predictable prices, while engineered to order suppliers win projects with unusual site, voltage, or climate requirements. Geographic expansion follows regional factories, such as the expanded Barcelona site of Schneider Electric and the planned Arizona plant of Armada, which cut delivery times and import exposure.

Which Competitive Archetypes Dominate the Industry?

Three archetypes dominate. Integrated power and thermal majors, including Schneider Electric, Vertiv, Eaton, and ABB, win on end to end scope and global service. IT stack vendors such as Huawei, Dell Technologies, and Hewlett Packard Enterprise win on compute integration. Specialist prefabricators and thermal firms, including Rittal, STULZ, Silent-Aire, BladeRoom Group, and Envicool, win on configurability and cooling depth.

What Innovation and Differentiation Strategies Are Companies Pursuing?

We found that suppliers differentiate through standardized megawatt scale power blocks, factory integrated liquid cooling, and digital twin commissioning. Schneider Electric builds its designs on NVIDIA reference architectures, and Vertiv pairs OneCore with a central management platform called Unify. These moves reduce design time for buyers and make suppliers reference partners for each new GPU generation, which supports premium pricing for validated, ready to deploy systems.

What M&A and Partnership Activity Is Shaping the Market?

Consolidation targets modular power and liquid cooling specialists. Eaton paid USD 1.40 Billion for Fibrebond in April 2025 and added Boyd Thermal in March 2026, while nVent agreed in August 2026 to buy Maverick Power for USD 1.75 Billion. Partnerships also matter, as Johnson Controls signed a global framework agreement with Armada for modular production. We expect further deals as buyers seek scale and bundled power and cooling.

Key Market Players

Based on research conducted by NMSC, we found that the following 20 companies represent the validated leadership set across prefabricated power, cooling, IT, and integrated modular data center solutions.

Schneider Electric SE Vertiv Holdings Co. Huawei Technologies Co., Ltd. RITTAL GmbH & Co. KG Silent-Aire Ltd Eaton Corporation plc ABB Ltd Delta Electronics, Inc. STULZ GmbH Dell Technologies Hewlett Packard Enterprise Company ZTE Corporation KSTAR Science and Technology Co., Ltd. Shenzhen Envicool Technology Co., Ltd. BladeRoom Group Kehua Data Co., Ltd. PCX Corporation LLC Armada Systems, Inc. Mitsubishi Electric Corporation nVent Electric plc

Latest Developments

We observed that 2025 and 2026 activity centers on larger standardized power blocks, integrated liquid cooling, and consolidation among modular power and thermal suppliers.

Date Event
September 2026 Schneider Electric launched prefabricated Power Modules and Power Skids of 2 MW, 2.25 MW, and 2.5 MW, built on NVIDIA GB300 NVL72 reference designs and available first in Europe.
September 2026 The European Commission proposed a common rating scheme for data centers of 500 kW and above and opened a consultation on minimum performance standards.
August 2026 nVent signed a definitive agreement to acquire Maverick Power, a maker of power distribution and integrated modular solutions, for USD 1.75 Billion, with closing expected in the fourth quarter of 2026.
May 2026 Armada raised USD 0.23 Billion in a Series B round and announced a global framework agreement with Johnson Controls for Galleon Forge One, a planned modular data center factory in Arizona.
March 2026 Eaton completed its acquisition of Boyd Thermal, adding liquid cooling capability to its data center power portfolio.
August 2025 Vertiv launched OneCore, a prefabricated platform integrating power, thermal, and IT infrastructure for data centers of 5 MW and above.
April 2025 Eaton completed its USD 1.40 Billion acquisition of Fibrebond, a builder of integrated modular power enclosures for data center customers.

Expert Insights

Marc Garner

SVP, Secure Power & Data Centre Business | Schneider Electric

"Prefabricated modular data centres are one of the most efficient and sustainable ways to design and deploy high performance data centre capacity at speed and scale"

Analyst Interpretation

The statement highlights the advantages of factory-built data center infrastructure in addressing demand for rapid capacity deployment. Prefabrication can move integration work from construction sites into controlled manufacturing environments, helping operators standardize designs, improve deployment predictability, and scale infrastructure as computing requirements increase.

Investment Opportunities

Where Are Capital Inflows Concentrating in the Prefabricated Data Center Market?

Capital is concentrating in modular power, liquid cooling, and edge modular platforms. Eaton paid USD 1.40 Billion for Fibrebond, nVent agreed to pay USD 1.75 Billion for Maverick Power, and Armada raised USD 0.23 Billion at a USD 2.00 Billion pre money valuation, with Johnson Controls among its investors. These deals target suppliers with factory capacity and backlog, which signals confidence in repeatable demand rather than one off projects.

How Is Infrastructure Investment Shaping Market Capacity?

Infrastructure investment is shifting toward factory capacity. Schneider Electric expanded its Barcelona site to support global modular demand and builds its new power modules there, while Armada plans a 400,000 square foot factory in Arizona expected to create more than 500 jobs. Larger factories shorten delivery times and let vendors reserve production slots for hyperscale customers, although the grid capacity needed to energize completed modules remains outside vendor control.

What ESG Considerations Are Influencing Market Investment?

Environmental, Social, and Governance considerations increasingly shape module specifications and financing. Data centers of 500 kW or more already report energy and water metrics in the EU, and the first sustainability labels for individual facilities are expected in 2027. Factory production reduces on site waste and construction disruption, and standardized designs make efficiency data easier to compare, which helps operators meet investor disclosure expectations (industry derived estimate).

Key Benefits for Stakeholders

How Does This Report Benefit Industry Leaders and Data Center Operators?

Operators, colocation developers, and enterprise infrastructure leaders gain a reconciled market sizing model that runs from USD 17.80 Billion in 2025 to USD 52.45 Billion by 2035, with segment views by product type, cooling technology, and end user. These insights support capacity planning, supplier selection, and decisions on when to shift from site built to prefabricated delivery in each region.

How Does This Report Benefit Investors and Financial Analysts?

Investors and financial analysts gain a forecast anchored at USD 21.64 Billion in 2026 and a 10.34% CAGR through 2035, plus a clear view of the absolute growth available over the period. Regional and country level projections, quantified restraints, and a review of recent acquisitions help assess valuation context and identify the segments that carry the strongest growth for capital deployment.

How Does This Report Benefit Technology Vendors and Product Teams?

Technology vendors and product teams gain visibility into which segments, capacities, and regions grow fastest, including Direct Liquid cooling and Above 10 MW systems from 2026 to 2035. The competitive landscape and archetype analysis help teams prioritize roadmaps, partnerships, and regional manufacturing investments against rivals. Product teams also gain a clear view of buyer needs by end user, which supports sharper positioning and pricing decisions.

Key Market Segments Evaluated

By Product Type

  • IT Modules
  • Power Modules
  • Cooling Modules
  • Other Modules

By Form Factor

  • Containerized
  • Uncontainerized

By Capacity

  • Up to 100 kW
  • Above 100 kW to 500 kW
  • Above 500 kW to 2 MW
  • Above 2 MW to 10 MW
  • Above 10 MW

By Cooling Technology

  • Air-Only
  • Direct Liquid
  • Immersion-Only
  • Hybrid

By Deployment

  • Indoor
  • Outdoor

By Sales Channel

  • OEM Sales
  • Aftermarket Sales

By End User

  • Cloud Service Providers
  • Colocation Providers
  • Telecom Operators
  • Enterprises
  • Government
  • Others

By Region

  • North America 
    • U.S.
    • Canada
    • Mexico
  • Europe 
    • UK
    • Germany
    • France
    • Italy
    • Spain
    • Sweden
    • Denmark
    • Finland
    • Netherlands
    • Rest of Europe
  • Asia-Pacific 
    • China
    • India
    • Japan
    • South Korea
    • Taiwan
    • Indonesia
    • Vietnam
    • Australia
    • Philippines
    • Malaysia
    • Rest of APAC
  • Middle East & Africa 
    • Saudi Arabia
    • UAE
    • Egypt
    • Israel
    • Turkey
    • Nigeria
    • South Africa
    • Rest of MEA
  • Latin America 
    • Brazil
    • Argentina
    • Chile
    • Colombia
    • Rest of LATAM

Conclusion & Recommendations

Our assessment indicates that the outlook is strongly positive, with revenue rising from USD 17.80 Billion in 2025 to USD 52.45 Billion by 2035 at an average pace of more than 10% a year. AI infrastructure, liquid cooling, and speed to power requirements favor factory built blocks. Grid availability and supply chain capacity will set the pace more than demand, so growth should be steady rather than concentrated in short bursts.

What Strategic Positioning Recommendations Does NMSC Offer?

Vendors should standardize megawatt scale power blocks, integrate direct liquid cooling at the factory, and add regional production close to demand centers. Buyers should reserve factory capacity early and align module orders with utility energization dates. Suppliers of Cooling Modules and aftermarket offerings should prioritize service coverage, because these categories grow faster than the overall market from 2026 to 2035.

What Does Investment Attractiveness Look Like for the Prefabricated Data Center Market?

Investment attractiveness is high, supported by the USD 30.81 Billion absolute opportunity between 2026 and 2035 and an active acquisition pipeline. The strongest risk adjusted returns sit in Power Modules, Cooling Modules, and Cloud Service Provider programs, where demand visibility is clearest. Middle East & Africa offers the fastest regional growth at 13.22% CAGR, although its smaller base of USD 1.08 Billion in 2025 raises execution risk.

What Market Shifts and Key Risks Could Alter the Outlook?

Key shifts include the move from air to liquid cooling, from custom to catalog power blocks, and from edge pilots to megawatt scale campuses. Key risks include grid interconnection delays, transformer and switchgear shortages, and AI capital spending cycles that could slow orders. Regulatory tightening in Europe may raise design costs for older air cooled modules, while consolidation may reduce supplier choice for smaller buyers.

What Are the Primary Growth Pathways Through 2035?

Primary growth pathways include Direct Liquid cooling expansion, Above 10 MW campus blocks, aftermarket service and retrofit programs, and sovereign AI and edge deployments in Middle East & Africa and Asia-Pacific. Vendors that combine factory integrated power and cooling with regional manufacturing can capture a disproportionate share of added revenue as the Prefabricated Data Center Market approaches USD 52.45 Billion in 2035.
Delivered Customizations

We have successfully delivered the following deep-dive customizations:

Client Request Customization Delivered Value Adds
Market Sizing by Product, Capacity and End User
  • Top-down and bottom-up TAM, SAM and VAM estimates for prefabricated data centers segmented by product type, capacity band and end user, 2026-2035.
  • Identifies the largest serviceable capacity and end-user pools to prioritize where prefab offerings should be focused and funded.
Trade Flow Assessment of Prefab Data Center Components
  • Country-wise import and export analysis of prefabricated modules, power skids, UPS, switchgear and cooling equipment using HS-code trade data.
  • Reveals sourcing dependencies and export-led manufacturing hubs to support supply chain, localization and tariff-exposure decisions.
Vendor Share by Product Type and Form Factor
  • Company-level share analysis of prefab data center vendors by product type (modular, containerized, skid-based) and form factor, based on disclosed revenue and shipments.
  • Benchmarks competitive positioning and highlights where leading vendors are gaining or losing share for portfolio and partnership planning.
Cooling Technology Adoption and Rack Density Mapping
  • Adoption mapping of air-cooled, liquid-cooled and hybrid prefab designs against rack density and deployment type, using operator disclosures and energy agency data.
  • Shows where liquid-cooling demand is shifting, guiding R&D investment and product configuration for high-density AI and HPC workloads.
Deployment Model and Time-to-Capacity Benchmarking
  • Benchmarking of capex per MW, build duration and deployment model (hyperscale, colocation, enterprise, edge) using public operator and developer filings.
  • Quantifies speed-to-market and cost advantages of prefab versus stick-built delivery to sharpen pricing and sales targeting.
Grid Power Availability and Regional Prefab Demand Assessment
  • Country and region-level assessment linking grid interconnection capacity, power pricing and permitting timelines to prefab data center demand by capacity tier.
  • Identifies power-constrained and power-available regions to prioritize geographic expansion and site-selection partnerships.

FAQs

Sources & References

1.

International Energy Agency: Energy and AI (data centre electricity demand to 2030)

iea.org
2.

U.S. Department of Energy: 2024 Report on U.S. Data Center Energy Use

energy.gov
3.

Lawrence Berkeley National Laboratory: Report evaluates increase in electricity demand from data centers

energyanalysis.lbl.gov
4.

European Commission: Making data centres energy efficient thanks to a new EU rating system (21 September 2026)

commission.europa.eu
5.

European Commission DG Energy: Minimum performance standards for data centres in Europe, public consultation

energy.ec.europa.eu
6.

European Commission DG Energy: Minimum performance standards for EU data centres (Directive 2023/1791 and Delegated Regulation 2024/1364 context)

energy.ec.europa.eu
7.

Schneider Electric: Next generation Prefabricated Power Modules press release (16 September 2026)

se.com
8.

Schneider Electric: Prefabricated data centres for an AI focused future at the edge

se.com
9.

Eaton Corporation plc: Completes acquisition of Fibrebond (1 April 2025)

businesswire.com
10.

Eaton Corporation plc: Completes acquisition of Boyd Thermal (12 March 2026)

businesswire.com
11.

Vertiv Holdings Co: Announces Vertiv OneCore (5 August 2025)

vertiv.com
12.

nVent Electric plc: nVent to acquire Maverick Power (24 August 2026)

globenewswire.com
13.

Armada: Agreement with Johnson Controls for Galleon Forge One and Series B (19 May 2026)

armada.ai
14.

Huawei Technologies Co., Ltd.: FusionDC1000C prefabricated modular data center

digitalpower.huawei.com

About the Author

Liza Phukan

Liza Phukan

Liza Phukan is Research Associate at Next Move Strategy Consulting, where she has covered emerging industries and market research across sectors for 3.5 years. Her work includes analyzing industry developments, validating market data, and developing structured business content from research findings. She uses secondary research and data-validation practices to turn complex market information into clear decision-useful market analysis for business audiences and support report development and B2B.

About the Reviewer

Supradip Baul

Supradip Baul

Supradip Baul is an accomplished business consultant and strategist with over a decade of rich experience in market intelligence, strategy, technology, and business transformation. His work has included rigorous qualitative and quantitative analysis across multiple industries, helping clients shape investment decisions and long-term roadmaps. Earlier in his career, he was associated with Gartner, where he contributed to industry-leading reports and market share analyses. He has worked with leading global companies and holds an MBA with a dual specialization in Marketing and Finance.

Download Free Sample

Nishant Awate

NISHANT AWATE

Business Development Global Sales

Zehnder Group Deutschland GmbH

Our experience working with Next Move Strategy Consulting was positive. The team was responsive, professional, and open to incorporating our specific requirements throughout the project. The India AHU market study was comprehensive and well structured, covering market value and volume forecasts, product and application segments, and key industry trends. The inclusion of both AHU and residential MVHR market insights made the study particularly relevant for our strategic market assessment. Overall, the report provides a solid foundation for evaluating market potential, identifying priority segments, and supporting business-development decisions in India.

Rishabh Jogani

RISHABH JOGANI

Strategy Analyst

Accenture Japan

We are incredibly impressed with the market report on the real estate market in India provided by Next Move Strategy Consulting. The report was thorough, insightful, and well-structured, offering deep analysis and actionable recommendations. It not only captured the current trends and dynamics but also provided a forward-looking perspective that has been invaluable for our strategic planning. Their team demonstrated exceptional professionalism, attention to detail, and a profound understanding of the industry. The data-driven insights and clarity of presentation exceeded our expectations, making complex market trends easy to understand. We highly recommend Next Move Strategy Consulting to anyone looking for reliable and comprehensive market research services. Their expertise has given us the confidence to navigate the complexities of the Indian real estate market with clarity and foresight.

Mohit Agarwal

MOHIT AGARWAL

Chief Manager

DryChem India Pvt. Ltd.

Next Move Strategy Consulting is an amazing team of consultants. We required a market study report for our investors on top priority and the team went above and beyond our expectations to deliver the same with ample supporting data within a short time span enabling us to secure the investments and keep our project timeline maintained. Their professionalism, attention to detail, and timely delivery of actionable recommendations have left a lasting impression on our organization.

Henri Knyphausen

HENRI KNYPHAUSEN

Partner at Singulier [Ex-BCG]

Singulier

I recently engaged NEXTMSC.com for a commercial due diligence project within the intralogistics sector, and I am pleased to provide a reference based on my experience. In utilizing NEXTMSC.com's services, I found their report to offer valuable insights into market dynamics and key industry players. The initial report provided a solid foundation for our analysis. However, as we were investigating a smaller target in the market, and I had specific customization requests requiring additional research. These requests included detailed information on product portfolios of various players and sub-market sizes, both inclusive and exclusive of certain product categories. NEXTMSC.com demonstrated commendable responsiveness and agility in accommodating these customization requests. Within a timeframe of 1-2 weeks, they delivered a revised report that met our specific needs. Furthermore, they were receptive to my follow-up inquiries, ensuring clarity and understanding of the data provided. The final deliverable significantly contributed to our due diligence efforts. One of NEXTMSC.com's notable strengths lies in their qualitative research capabilities. However, for future engagements, I would recommend the inclusion of a quantified market model in Excel format. Such a model would offer the ability to conduct in-depth analyses and explore various market segments, including country-specific data and subcomponent breakdowns. Based on my positive experience, I would not hesitate to work with NEXTMSC.com again. Their responsiveness, willingness to accommodate customization requests, and commitment to delivering actionable insights make them a reliable partner for commercial research projects.

Diana Trejo

DIANA TREJO

Assistant Manager

Sumitomo Corporation de Mexico, S.A. de C.V.

Recently, we purchased a report on the Mexico Data Center Market from Next Move Strategy Consulting. The service has been excellent, with support that is always timely and thoroughly professional. The information provided is interesting, highly useful, and delivered with clarity. I would highly recommend NextMSC for anyone seeking insightful and dependable analysis.

Custom Market Research Services

We will customize the research for you if the listed report does not fully match your requirements.

Get 30% Free Customization

Select License

This website uses cookies to ensure you get the best experience on our website. Learn more

✖