Waterless Dyeing Machines Market Global Industry Analysis and Forecast (2026–2035)

Waterless Dyeing Machines Market size was USD 221.79 Million in 2025, projected to reach USD 544.62 Million by 2035, growing at a CAGR of 9.5% from 2026 to 2035. Key drivers include tighter textile wastewater rules such as China's GB 4287—2026, brand programs that fund lower water dyeing, and the extension of CO2 dyeing beyond polyester, with Asia-Pacific leading the global market.

Download Free Sample PDF
Base Year (2025)
$221.8 Million
Forecast (2035)
$544.6 Million
CAGR (2026-2035)
9.5%
Top Region
Asia-Pacific

What Is the Waterless Dyeing Machines Market Size?
The global waterless dyeing machines market reached USD 221.79 Million in 2025 and is estimated at USD 240.64 Million in 2026, forecast to reach USD 544.62 Million by 2035 at a CAGR of 9.5% between 2026 and 2035. Asia-Pacific leads with approximately 62.0% revenue share in 2025, while supercritical CO2 dyeing is the dominant technology, holding approximately 52.0% of revenue.

We observed that the November 2025 insolvency of DyeCoo Textile Systems removed the best-known Western supplier of industrial CO2 dyeing equipment, yet the process itself remains proven on factory floors. Demand now rests on brand sourcing programs and tighter wastewater rules, while capital cost and fiber compatibility decide how quickly mills convert.

Waterless Dyeing Machines Market Global Industry Analysis and Forecast (2026–2035) Revenue Forecast

Values in USD Million

2025 $221.8 Million
2025
2026 $240.6 Million
2026
2027 $263.5 Million
2027
2028 $288.5 Million
2028
2029 $315.9 Million
2029
2030 $346.0 Million
2030
2031 $378.8 Million
2031
2032 $414.8 Million
2032
2033 $454.2 Million
2033
2034 $497.4 Million
2034
2035 $544.6 Million
2035

Key Takeaways

By Technology: Supercritical CO2 dyeing held the largest share, expanding from USD 115.34 Million in 2025 to USD 299.54 Million by 2035; Other dry dyeing technologies are the fastest-growing at 11.9% CAGR from 2026–2035.

By Machine capacity: Industrial scale held the largest share, expanding from USD 133.07 Million in 2025 to USD 370.34 Million by 2035; Industrial scale is the fastest-growing at 10.9% CAGR from 2026–2035.

By Substrate format: Fabric held the largest share, expanding from USD 155.26 Million in 2025 to USD 359.45 Million by 2035; Fiber and garment is the fastest-growing at 11.9% CAGR from 2026–2035.

By Fiber type: Polyester held the largest share, expanding from USD 150.82 Million in 2025 to USD 326.77 Million by 2035; Cotton and cellulosic is the fastest-growing at 15.6% CAGR from 2026–2035.

By Revenue stream: Equipment sales held the largest share, expanding from USD 177.43 Million in 2025 to USD 392.13 Million by 2035; Aftermarket and services is the fastest-growing at 13.2% CAGR from 2026–2035.

By End use application: Apparel and sportswear held the largest share, expanding from USD 124.21 Million in 2025 to USD 294.10 Million by 2035; Home textiles is the fastest-growing at 11.0% CAGR from 2026–2035.

By End user: Textile mills held the largest share, expanding from USD 88.72 Million in 2025 to USD 206.96 Million by 2035; Research and testing laboratories is the fastest-growing at 11.9% CAGR from 2026–2035.

By Sales channel: Direct sales held the largest share, expanding from USD 173.00 Million in 2025 to USD 392.13 Million by 2035; Distributors and agents is the fastest-growing at 12.1% CAGR from 2026–2035.

Dominant Region: Asia-Pacific dominated with approximately 62.0% revenue share in 2025, at USD 137.51 Million, supported by Asian mills and dyehouses that hold most commercial dyeing capacity.

Fastest-Growing Region: Middle East & Africa is expected to register the highest CAGR of 11.4% during 2026–2035, from USD 17.74 Million in 2025.

Dominant Country: China led the market with an estimated USD 63.25 Million in 2025, backed by domestic equipment research and large mill capacity.

Fastest-Growing Country: India is the fastest growing country covered, projected to expand from USD 16.50 Million in 2025 at a CAGR of 14.1% through 2035.

The Waterless Dyeing Machines Market presents an absolute opportunity of approximately USD 303.98 Million between 2026 and 2035, calculated as the difference between the 2035 forecast of USD 544.62 Million and the 2026 base of USD 240.64 Million. Industrial scale supercritical systems and aftermarket service contracts capture most of this incremental revenue for investors.

According to NMSC analysis, aftermarket revenue is the structural shift to watch, because every installed pressure vessel generates recurring demand for spare parts, CO2 recovery upgrades and operator training. Aftermarket and services rise from 20.0% of revenue in 2025 to 28.0% by 2035 in our model, which should smooth the lumpy equipment cycle that strains small suppliers.

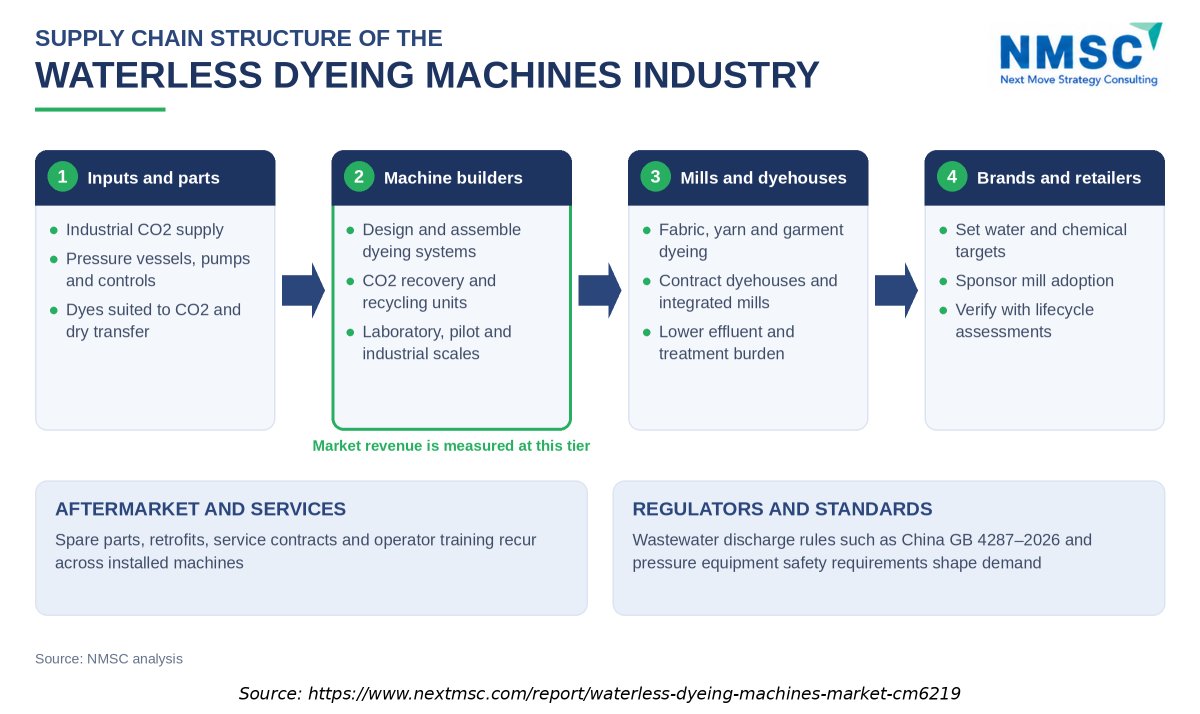
Supply Chain Structure of the Waterless Dyeing Machines Industry

Supply Chain Structure of the Waterless Dyeing Machines Industry
Value moves from CO2, pressure vessel, and specialized dye inputs through machine builders to textile mills and retail brands. Revenue in this report is measured exclusively at the machine builder tier. Brand sustainability targets and mill economics act as primary demand signals, while aftermarket services and regulatory frameworks operate across all supply chain stages. Participants that control service coverage and fiber compatibility hold the most defensible positions.

What does the Waterless Dyeing Machines Market Encompass?

The waterless dyeing machines market covers industrial machines that apply colorants to textile fabric, yarn, fiber and garments without process water as the dye medium. Included technologies are supercritical CO2 dyeing, air and dry transfer dyeing, and other dry dyeing methods. Revenue is measured at the machine manufacturer tier and includes new machines, spare parts, retrofits and service contracts. Dyes, textile services, conventional low liquor machines, digital printers and finishing equipment are excluded.

We found that the market is at an emerging stage. Supercritical CO2 dyeing was first proven on polyester, where the process recycles about 95% of its CO2 in a closed loop, and newer systems now target cotton, nylon and blends. China's GB 4287—2026 wastewater standard takes effect on 1 September 2026 and adds a zebrafish embryo toxicity test for dyeing effluent, which raises the cost of wet processing.

Market Drivers & Dynamics

Interactive Dataset
Stricter textile wastewater rules, including China GB 4287—2026 driver +1.6% Asia-Pacific 2026–2030
Brand sourcing programs for lower water and chemical footprints driver +1.4% Global 2026–2032
Extension of CO2 dyeing to cotton and blends driver +1.2% Global 2027–2035
Aftermarket and retrofit demand from installed machines driver +0.6% Global 2027–2035
High capital cost per machine restraint −1.5% Global 2026–2032
Supplier concentration and insolvency risk restraint −0.9% Europe, Asia-Pacific 2026–2029
Dye compatibility limits on some fibers restraint −0.7% Global 2026–2031
Source: Next Move Strategy Consulting

Growth Drivers

What Is the Primary Growth Driver?

China's Ministry of Ecology and Environment reports around 149,000 textile enterprises, about 86% of them SMEs, and roughly 93% of textile wastewater discharged indirectly through treatment systems. GB 4287—2026 differentiates indirect discharge controls and adds toxicity testing, so mills that expand or build lines from September 2026 face higher treatment costs. Polyester supplies 59% of global fiber output at 78 million tonnes, the fiber on which CO2 dyeing is already proven, so regulation meets a large addressable base.

How Is Fiber Compatibility Driving Market Growth?

Our model lifts cotton and cellulosic machine revenue from USD 17.74 Million in 2025 to USD 76.25 Million by 2035, a 15.6% CAGR from 2026, as an industry derived estimate. Cotton holds 19% of global fiber output, and commercial proof of cotton, viscose and blend dyeing in India in 2025 turns that volume into addressable demand. The forecast depends on repeat orders after the first plant.

Growth Inhibitors

What Is Restraining the Market?

A production scale CO2 machine was quoted at USD 2.5 million to USD 4 million per unit in 2014 for DyeCoo equipment, a large outlay for SME mills. Supplier insolvency adds counterparty risk for buyers. We found that financing, leasing and service guarantees will matter as much as technical performance, so growth hinges on lowering ownership cost through standardized vessels and local manufacturing.

What Are the Growth Opportunities?

Where Does Retrofit and Service Revenue Create Opportunity?

Installed machines need spare parts, CO2 recovery upgrades and training long after delivery. Our model raises aftermarket and services from USD 44.36 Million in 2025 to USD 152.49 Million by 2035. Suppliers that offer remote support and parts stocking benefit most, especially buyers who worry about vendor continuity, provided that installed machines keep running and mills renew contracts.

Which Buyers Gain From Leasing and Shared Dyehouse Models?

Contract dyehouses can spread a high machine price across many customers. CleanDye, a Vietnamese dyehouse using DyeCoo technology, showed in 2023 that a CO2 dyehouse can serve brands such as Adidas without each mill owning equipment. Machine builders gain from leasing structures, and SME mills gain access to waterless capacity, if brands commit volumes that make utilization predictable.

How Can Machine Builders Enter Emerging Textile Hubs?

India's first commercial scale supercritical CO2 machine started at Arvind in 2025, and Vietnam already hosts a CO2 dyehouse. Builders that localize assembly and service in such hubs can undercut imported pricing and shorten delivery. Our model puts India at USD 61.76 Million by 2035, so early partnerships with large exporting mills and brand sustainability teams are the beneficiary route into this growth.

Segmentation Analysis

2025 (USD Million)
2035 (USD Million)
Supercritical CO2 dyeing 2025: $115.3 Million | 2035: $299.5 Million
Supercritica
Air and dry transfer dyeing 2025: $79.8 Million | 2035: $163.4 Million
Air and dry
Other dry dyeing technologies 2025: $26.6 Million | 2035: $81.7 Million
Other dry dy
Supercritical CO2 dyeing $115.3 Million $299.5 Million 10.1%
Air and dry transfer dyeing $79.8 Million $163.4 Million 7.5%
Other dry dyeing technologies $26.6 Million $81.7 Million 11.9%

Which Technology Dominates and Which Is Growing Fastest?

Supercritical CO2 dyeing holds the largest share at USD 115.34 Million in 2025, reflecting its record of industrial installations with brand backing. Other dry dyeing technologies grow fastest at 11.9% from 2026 as new systems reach early commercial stages. Air and dry transfer dyeing grows slowest at 7.5% because it works mainly on synthetic substrates.

2025 (USD Million)
2035 (USD Million)
Laboratory a
Pilot and sm
Industrial s
Segment Item 2025 (USD Million) 2035 (USD Million) CAGR
Laboratory and sampling $10.0 USD Million $40.0 USD Million 25.0%
Pilot and small batch $17.1 USD Million $51.1 USD Million 11.0%
Industrial scale $24.2 USD Million $62.2 USD Million 25.0%

Segment-wise data is locked

Unlock complete segment-wise numbers for Machine capacity.

Unlock Full Data
2025 (USD Million)
2035 (USD Million)
Fabric
Yarn
Fiber and ga
Segment Item 2025 (USD Million) 2035 (USD Million) CAGR
Fabric $10.0 USD Million $40.0 USD Million 27.0%
Yarn $17.1 USD Million $51.1 USD Million 9.0%
Fiber and garment $24.2 USD Million $62.2 USD Million 19.0%

Segment-wise data is locked

Unlock complete segment-wise numbers for Substrate format.

Unlock Full Data
2025 (USD Million)
2035 (USD Million)
Polyester
Polyamide
Cotton and c
Blended fabr
Segment Item 2025 (USD Million) 2035 (USD Million) CAGR
Polyester $10.0 USD Million $40.0 USD Million 14.0%
Polyamide $17.1 USD Million $51.1 USD Million 24.0%
Cotton and cellulosic $24.2 USD Million $62.2 USD Million 22.0%
Blended fabrics $31.3 USD Million $73.3 USD Million 12.0%

Segment-wise data is locked

Unlock complete segment-wise numbers for Fiber type.

Unlock Full Data
2025 (USD Million)
2035 (USD Million)
Equipment sa
Aftermarket
Spare parts
Service cont
Segment Item 2025 (USD Million) 2035 (USD Million) CAGR
Equipment sales $10.0 USD Million $40.0 USD Million 24.0%
Aftermarket and services $17.1 USD Million $51.1 USD Million 22.0%
Spare parts and retrofits $24.2 USD Million $62.2 USD Million 20.0%
Service contracts $31.3 USD Million $73.3 USD Million 22.0%

Segment-wise data is locked

Unlock complete segment-wise numbers for Revenue stream.

Unlock Full Data

Which Revenue Streams Are Expanding Fastest?

Equipment sales remain dominant at USD 177.43 Million in 2025, yet aftermarket and services expand faster at 13.2% from 2026. Service contracts lead the aftermarket at 13.5% as installed pressure vessels need recovery upgrades and maintenance. Buyers that saw a supplier fail in 2025 are likely to prefer vendors offering long term support, which shifts spending from one time equipment toward recurring revenue.

2025 (USD Million)
2035 (USD Million)
Apparel and
Home textile
Technical an
Footwear and
Segment Item 2025 (USD Million) 2035 (USD Million) CAGR
Apparel and sportswear $10.0 USD Million $40.0 USD Million 23.0%
Home textiles $17.1 USD Million $51.1 USD Million 9.0%
Technical and industrial textiles $24.2 USD Million $62.2 USD Million 19.0%
Footwear and accessories $31.3 USD Million $73.3 USD Million 13.0%

Segment-wise data is locked

Unlock complete segment-wise numbers for End use application.

Unlock Full Data

Which Applications Lead and Which Grow Fastest?

Apparel and sportswear leads at USD 124.21 Million in 2025 because sportswear brands such as Nike and Adidas sponsored early CO2 dyeing programs. Home textiles grows fastest at 11.0% from 2026, supported by early home furnishing interest such as IKEA GreenTech's 2013 investment in DyeCoo. Footwear and accessories grows slowest at 8.0%, although YKK has developed a waterless process for zippers.

2025 (USD Million)
2035 (USD Million)
Textile mill
Contract dye
Integrated g
Research and
Segment Item 2025 (USD Million) 2035 (USD Million) CAGR
Textile mills $10.0 USD Million $40.0 USD Million 21.0%
Contract dyehouses $17.1 USD Million $51.1 USD Million 23.0%
Integrated garment manufacturers $24.2 USD Million $62.2 USD Million 25.0%
Research and testing laboratories $31.3 USD Million $73.3 USD Million 15.0%

Segment-wise data is locked

Unlock complete segment-wise numbers for End user.

Unlock Full Data
2025 (USD Million)
2035 (USD Million)
Direct sales
Distributors
Segment Item 2025 (USD Million) 2035 (USD Million) CAGR
Direct sales $10.0 USD Million $40.0 USD Million 9.0%
Distributors and agents $17.1 USD Million $51.1 USD Million 23.0%

Segment-wise data is locked

Unlock complete segment-wise numbers for Sales channel.

Unlock Full Data

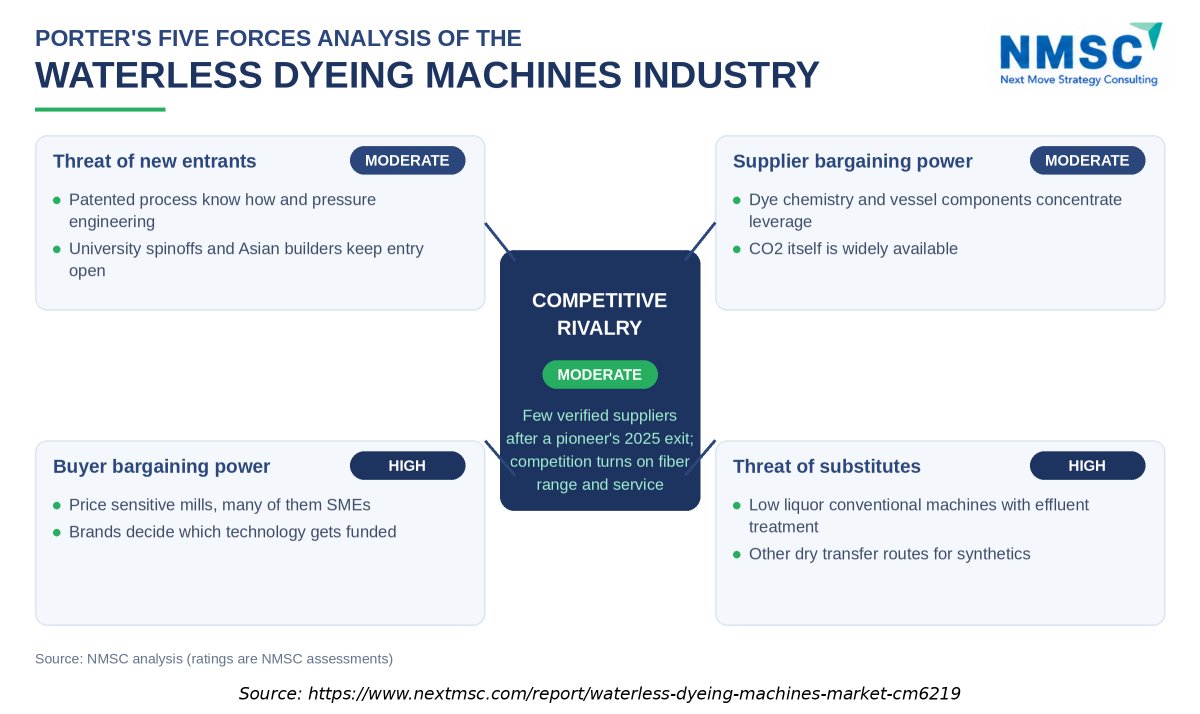
Porter's Five Forces Analysis of the Waterless Dyeing Machines Industry

Buyer bargaining power and substitute threats are evaluated as the strongest market forces because textile mills continually benchmark waterless machinery against low-liquor conventional lines paired with advanced effluent treatment infrastructure. Competitive rivalry and entry barriers remain moderate due to specialized pressure engineering IP and a concentrated manufacturer base. Machine builders improve their position by cutting ownership cost, proving fiber range and bundling service, which also protects them from buyer leverage.

Growth Opportunities

NMSC's assessment indicates that three opportunities offer the clearest path to revenue.

Where Does Retrofit and Service Revenue Create Opportunity?

Installed machines need spare parts, CO2 recovery upgrades and training long after delivery. Our model raises aftermarket and services from USD 44.36 Million in 2025 to USD 152.49 Million by 2035. Suppliers that offer remote support and parts stocking benefit most, especially buyers who worry about vendor continuity, provided that installed machines keep running and mills renew contracts.

Which Buyers Gain From Leasing and Shared Dyehouse Models?

Contract dyehouses can spread a high machine price across many customers. CleanDye, a Vietnamese dyehouse using DyeCoo technology, showed in 2023 that a CO2 dyehouse can serve brands such as Adidas without each mill owning equipment. Machine builders gain from leasing structures, and SME mills gain access to waterless capacity, if brands commit volumes that make utilization predictable.

How Can Machine Builders Enter Emerging Textile Hubs?

India's first commercial scale supercritical CO2 machine started at Arvind in 2025, and Vietnam already hosts a CO2 dyehouse. Builders that localize assembly and service in such hubs can undercut imported pricing and shorten delivery. Our model puts India at USD 61.76 Million by 2035, so early partnerships with large exporting mills and brand sustainability teams are the beneficiary route into this growth.

Regional Outlook

2025 (USD Million)
2035 (USD Million)
North Americ
Asia-Pacific
Europe
Middle East
Latin Americ
Region 2025 (USD Million) 2035 (USD Million) CAGR (%)
North America $10.0 USD Million $40.0 USD Million 9.0%
Asia-Pacific $17.1 USD Million $51.1 USD Million 27.0%
Europe $24.2 USD Million $62.2 USD Million 25.0%
Middle East & Africa $31.3 USD Million $73.3 USD Million 23.0%
Latin America $38.4 USD Million $84.4 USD Million 12.0%

Regional data is locked

Unlock complete regional numbers for this market.

Unlock Full Data

Competitive Landscape

Our assessment indicates that supplier scarcity, not buyer demand, now shapes competition.

Dimension Description
Market Structure Thin supplier base: two companies passed official source verification after DyeCoo's insolvency, while Chinese equipment developers appear mainly through patents.
Innovation Focus Fiber range extension to cotton and blends, compact electric machines and CO2 recovery.
M&A Activity No acquisition among waterless dyeing machine builders was verified for 2025–2026.

How Do Companies Compete in This Market?

Competition turns on proven industrial references, fiber range and ownership cost rather than list price alone. Hisaka Works promotes a closed system that reuses CO2 and also works with water and alcohol media, while Deven Supercriticals sells a dye layering process for natural fibers. Historic machine prices of USD 2.5 million to USD 4 million push suppliers toward financing and brand backed pilots to win first orders.

Which Competitive Archetypes Dominate the Market?

Three archetypes appear in the evidence. Established machinery makers such as Hisaka Works extend pressure processing expertise into dyeing. University spinoffs, including DyeCoo from Delft and technology startups such as Deven Supercriticals, carry process know how. Chinese universities, including Soochow and Dalian Polytechnic, hold equipment patents that domestic builders can license or adapt for local mills.

How Do Innovation and Differentiation Strategies Differ?

DyeCoo introduced a smaller fully electric machine and a laboratory system in 2023 to serve sampling and small batches. Soochow University patented a machine for mixed fluid media to reach natural fibers. Deven Supercriticals instead changes dye application to widen fiber range. These routes show that differentiation is shifting from vessel size toward fiber compatibility and operating flexibility, which will determine which suppliers win cotton orders.

What Role Do Partnerships and Expansion Play?

Partnerships between mills, brands and technology owners carry most of the market's expansion because buyers rarely fund unproven equipment alone. Geographic expansion followed brand supply chains from Thailand to Taiwan and Vietnam, and planned sites in South Korea, the Netherlands and Turkey in 2023 never saw their supplier survive. Acquisition activity is absent in our verified record, so asset sales from the insolvency are the event to monitor.

Key Market Players

Our analysis shows that only two companies passed verification against official company sources.

Hisaka Works, Ltd. Deven Supercriticals Pvt. Ltd.

Latest Developments

We found that one verified 2025 to 2026 event met the news criteria.

Date Event
11 September 2025 Arvind Limited, H&M Group and Deven Supercriticals inaugurated India's first commercial-scale supercritical CO₂ dyeing machine at Arvind's Ahmedabad facility. The machine uses Deven's patented SUPRAUNO technology, which replaces water with supercritical carbon dioxide in the textile dyeing process.

Investment Opportunities

Where Is Capital Concentrating in This Market?

Verified capital flows into the waterless dyeing machines market are small and mostly historic. IKEA GreenTech invested in DyeCoo in 2013, and TAU Investment Management held a controlling interest in CleanDye and a significant interest in DyeCoo in 2023. In 2025 a large Indian mill funded deployment of a new machine alongside H&M Group. NMSC interprets this pattern as capital favoring deployment platforms and mill partnerships over stand alone machine builders.

How Does Infrastructure Investment Shape Capacity?

Capacity grows in vessel sized steps, and each addition needs CO2 handling and recovery equipment plus qualified operators. China's GB 4287—2026 also pushes new and expanding mills to plan treatment routes and compliance testing, which changes the capital comparison between wet lines and dry systems. We found that sites with existing CO2 supply and brand offtake agreements are the most investable capacity additions.

What ESG Considerations Matter?

Deven Supercriticals reports up to 76% water savings, about 67% energy savings and a 90% chemical reduction at commercial scale compared with conventional dyeing. These are company figures, while the Sphera lifecycle assessment is third party evidence. Investors should favor suppliers with independent verification and low effluent claims that satisfy rules such as GB 4287—2026, since unverified claims invite scrutiny from brands and regulators.

Key Benefits for Stakeholders

How Do Textile Mills and Dyehouses Benefit?

Mills gain a route to lower effluent and lower chemical dyeing that anticipates stricter discharge limits. Our model shows industrial scale machines growing at 10.9% from 2026, which signals that early adopters can secure capacity before the supplier base grows. Mills should negotiate service guarantees, spare parts access and fiber trial rights, given a supplier insolvency in 2025.

How Do Machine Builders and Technology Developers Benefit?

Builders in the waterless dyeing machines market gain clarity on where revenue forms. Supercritical CO2 dyeing holds 52.0% of 2025 revenue, while other dry technologies grow at 11.9%. Aftermarket revenue grows at 13.2%, so service networks deserve investment early. Developers should prioritize cotton and blend proof points, because fiber range decides whether the addressable base stays near polyester's 59% fiber share or widens.

How Do Brands and Sourcing Teams Benefit?

Brands buying from the waterless dyeing machines market gain documented footprint reductions and a lever on supplier practices. The 58% lower greenhouse gas result for a Vietnamese CO2 dyehouse shows how a lifecycle assessment can turn sourcing policy into purchasing criteria. Application data in this report show apparel and sportswear at 56.0% of 2025 revenue, so brand programs remain the largest demand lever and can speed adoption by co funding mill equipment.

Key Market Segments Evaluated

By Technology

  • Supercritical CO2 dyeing
  • Air and dry transfer dyeing
  • Other dry dyeing technologies

By Machine capacity

  • Laboratory and sampling
  • Pilot and small batch
  • Industrial scale

By Substrate format

  • Fabric
  • Yarn
  • Fiber and garment

By Fiber type

  • Polyester
  • Polyamide
  • Cotton and cellulosic
  • Blended fabrics

By Revenue stream

  • Equipment sales
  • Aftermarket and services 
    • Spare parts and retrofits
    • Service contracts

By End use application

  • Apparel and sportswear
  • Home textiles
  • Technical and industrial textiles
  • Footwear and accessories

By End user

  • Textile mills
  • Contract dyehouses
  • Integrated garment manufacturers
  • Research and testing laboratories

By Sales channel

  • Direct sales
  • Distributors and agents

By Region

  • North America 
    • U.S.
    • Canada
    • Mexico
  • Europe 
    • UK
    • Germany
    • France
    • Italy
    • Spain
    • Sweden
    • Denmark
    • Finland
    • Netherlands
    • Rest of Europe
  • Asia-Pacific 
    • China
    • India
    • Japan
    • South Korea
    • Taiwan
    • Indonesia
    • Vietnam
    • Australia
    • Philippines
    • Malaysia
    • Rest of APAC
  • Middle East & Africa 
    • Saudi Arabia
    • UAE
    • Egypt
    • Israel
    • Turkey
    • Nigeria
    • South Africa
    • Rest of MEA
  • Latin America 
    • Brazil
    • Argentina
    • Chile
    • Colombia
    • Rest of LATAM

Conclusion & Recommendations

The outlook is positive but narrow. Revenue grows from USD 240.64 Million in 2026 to USD 544.62 Million by 2035 at 9.5%, which is steady growth from a small base. Growth rests on regulation, brand programs and fiber range rather than on rapid unit volume. The market stays at an emerging stage through the early 2030s, and sustained progress depends on whether the supplier base widens after 2025.

What Strategic Positioning Recommendations Does NMSC Offer?

NMSC recommends that machine builders in the waterless dyeing machines market anchor positions on three assets: proven fiber range, financing support and credible aftermarket coverage. Mills should buy from suppliers that can document continuity, and brands should fund equipment where utilization is secured by volume commitments. Positioning around industrial scale supercritical systems in Asia offers the largest revenue pool, while laboratory units support technology validation.

How Attractive Is the Market for Investment?

Attractiveness of the waterless dyeing machines market is moderate. The absolute opportunity of USD 303.98 Million is meaningful for a niche, and aftermarket revenue offers recurring income. Counterweights are high machine prices, a thin supplier base and a recent insolvency among the best-known vendors. NMSC favors investments tied to confirmed mill and brand offtake, and treats stand-alone equipment ventures without service depth as higher risk.

What Are the Key Market Shifts and Risks in the Market?

Two shifts matter most: the move of supply toward Asian and Indian developers, and the extension of CO2 dyeing from polyester to natural fibers. Risks include further supplier failures, slow conversion by SME mills, and dye compatibility limits on difficult fibers. A regulatory rollout that is weaker than planned would also slow adoption, so buyers and investors should monitor enforcement of GB 4287—2026 after September 2026.

What Are the Primary Growth Pathways Through 2035?

Three pathways stand out. First, regulation driven replacement of wet capacity in Asia-Pacific, which holds 62.0% of 2025 revenue. Second, fiber range expansion, with cotton and cellulosic machines at 15.6% growth. Third, service led models where aftermarket revenue rises toward 28.0% of the total. Mills, brands and builders that combine these pathways capture the most value.

FAQs

Sources & References

1.

Textile Exchange, Materials Market Report 2025

textileexchange.org
2.

Ministry of Ecology and Environment, China: GB 4287—2026 standard listing

mee.gov.cn
3.

Ministry of Ecology and Environment, China: GB 4287—2026 announcement

mee.gov.cn
4.

Ministry of Ecology and Environment explanation of GB 4287—2026 (published by Guangming Online)

m.gmw.cn
5.

Ecotextile News: China wastewater standard coverage citing the Ministry of Ecology and Environment

ecotextile.com
6.

Deven Supercriticals press release (via Texintel), 11–12 September 2025

texintel.com
7.

Innovation in Textiles: first supercritical CO2 dyeing machine for India

innovationintextiles.com
8.

Messe Frankfurt Texpertise Network, 1 September 2026

texpertisenetwork.messefrankfurt.com
9.

ChemSec Marketplace: DyeCoo solution profile

marketplace.chemsec.org
10.

Ecotextile News: DyeCoo Textile Systems enters bankruptcy

ecotextile.com
11.

Ecotextile News: When waterless dyeing met business reality

ecotextile.com
12.

Dutch insolvency register mirror: Dyecoo Textile Systems B.V.

faillissementsdossier.nl
13.

Specialty Fabrics Review: DyeCoo and CleanDye lifecycle assessment, 2023

specialtyfabricsreview.com
14.

Textile World: DyeCoo and CleanDye, 2023

textileworld.com
15.

Hisaka Works, official website: supercritical fluid processing machine

hisaka.co.jp
16.

Christian Science Monitor: waterless dyeing machine pricing, 2014 (historical)

csmonitor.com
17.

Ecotextile News: IKEA GreenTech investment in DyeCoo, 2013 (historical)

ecotextile.com
18.

YKK Americas: ECO-DYE waterless dyeing for zippers

ykkamericas.com
19.

USPTO patent US10968553B2, Soochow University

patents.google.com/patent/US10968553
20.

USPTO patent US10584433B2, Dalian Polytechnic University

patents.google.com/patent/US10584433
21.

Innovation in Textiles: DyeCoo installations at Yeh Group and planned 2023 sites

innovationintextiles.com
22.

Fibre2Fashion: AirDye technology overview (historical)

fibre2fashion.com
23.

Knitting Industry: Nike adopts waterless dyeing technology

knittingindustry.com
24.

Tech.eu: DyeCoo company profile (undated)

tech.eu

About the Author

Debashree Dey

Debashree Dey

Debashree Dey is Assistant Manager at Next Move Strategy Consulting, where she supports cross-vertical market content and communications across diverse industries for 6 years. Her professional background includes senior content writing, communications, and published manuscript authorship, with experience developing audience-focused business narratives and maintaining clear, consistent messaging. Her role supports research-led content development and editorial quality across NextMSC publications.

About the Reviewer

Supradip Baul

Supradip Baul

Supradip Baul is an accomplished business consultant and strategist with over a decade of rich experience in market intelligence, strategy, technology, and business transformation. His work has included rigorous qualitative and quantitative analysis across multiple industries, helping clients shape investment decisions and long-term roadmaps. Earlier in his career, he was associated with Gartner, where he contributed to industry-leading reports and market share analyses. He has worked with leading global companies and holds an MBA with a dual specialization in Marketing and Finance.

Download Free Sample

Melanie Samko

MELANIE SAMKO

Director of Marketing

TOSOH BIOSCIENCE, INC.

The information provided by NMSC is incredibly valuable, thank you so much for such a excellent work. I really appreciate it. I will make sure to reference all of it, in my summary document.

Robert Sean Trevino

ROBERT SEAN TREVINO

Sr. Director, Head of Strategic Insights & Analytics

Foundation Medicine

I realized that it was a reliable source of information. These days, there are many people who are looking for authentic data, and this is one of the only sources that can offer them with what they need;

Diana Trejo

DIANA TREJO

Assistant Manager

Sumitomo Corporation de Mexico, S.A. de C.V.

Recently, we purchased a report on the Mexico Data Center Market from Next Move Strategy Consulting. The service has been excellent, with support that is always timely and thoroughly professional. The information provided is interesting, highly useful, and delivered with clarity. I would highly recommend NextMSC for anyone seeking insightful and dependable analysis.

Kishu Kanda

KISHU KANDA

Strategy Analyst

Accenture

We purchased the AI Consumer Market Report from this company. Not only did they customize the report to meet our specific requirements, but they also showed great flexibility in accommodating our budget. The report we received fully met our expectations. Additionally, they provided prompt and thorough responses to both our pre-purchase and follow-up questions. We look forward to working with this company again in the future.

Henri Knyphausen

HENRI KNYPHAUSEN

Partner at Singulier [Ex-BCG]

Singulier

I recently engaged NEXTMSC.com for a commercial due diligence project within the intralogistics sector, and I am pleased to provide a reference based on my experience. In utilizing NEXTMSC.com's services, I found their report to offer valuable insights into market dynamics and key industry players. The initial report provided a solid foundation for our analysis. However, as we were investigating a smaller target in the market, and I had specific customization requests requiring additional research. These requests included detailed information on product portfolios of various players and sub-market sizes, both inclusive and exclusive of certain product categories. NEXTMSC.com demonstrated commendable responsiveness and agility in accommodating these customization requests. Within a timeframe of 1-2 weeks, they delivered a revised report that met our specific needs. Furthermore, they were receptive to my follow-up inquiries, ensuring clarity and understanding of the data provided. The final deliverable significantly contributed to our due diligence efforts. One of NEXTMSC.com's notable strengths lies in their qualitative research capabilities. However, for future engagements, I would recommend the inclusion of a quantified market model in Excel format. Such a model would offer the ability to conduct in-depth analyses and explore various market segments, including country-specific data and subcomponent breakdowns. Based on my positive experience, I would not hesitate to work with NEXTMSC.com again. Their responsiveness, willingness to accommodate customization requests, and commitment to delivering actionable insights make them a reliable partner for commercial research projects.

Custom Market Research Services

We will customize the research for you if the listed report does not fully match your requirements.

Get 30% Free Customization

Select License

This website uses cookies to ensure you get the best experience on our website. Learn more

✖