AI Infrastructure Optimization Market Size, Share, Trends and Growth Analysis, By Component (Hardware Optimization, Software Optimization, and Services), By Deployment Mode (On-Premises, Cloud, Hybrid, and Edge), By Workload Type, By Organization Size (Large Enterprises and SMEs), By Industry Vertical, By End User (Cloud Service Providers, Enterprises, Government Organizations, and Others), and Region -- Global Industry Report and Forecast, 2026—2035
What Is the AI Infrastructure Optimization Market Size?
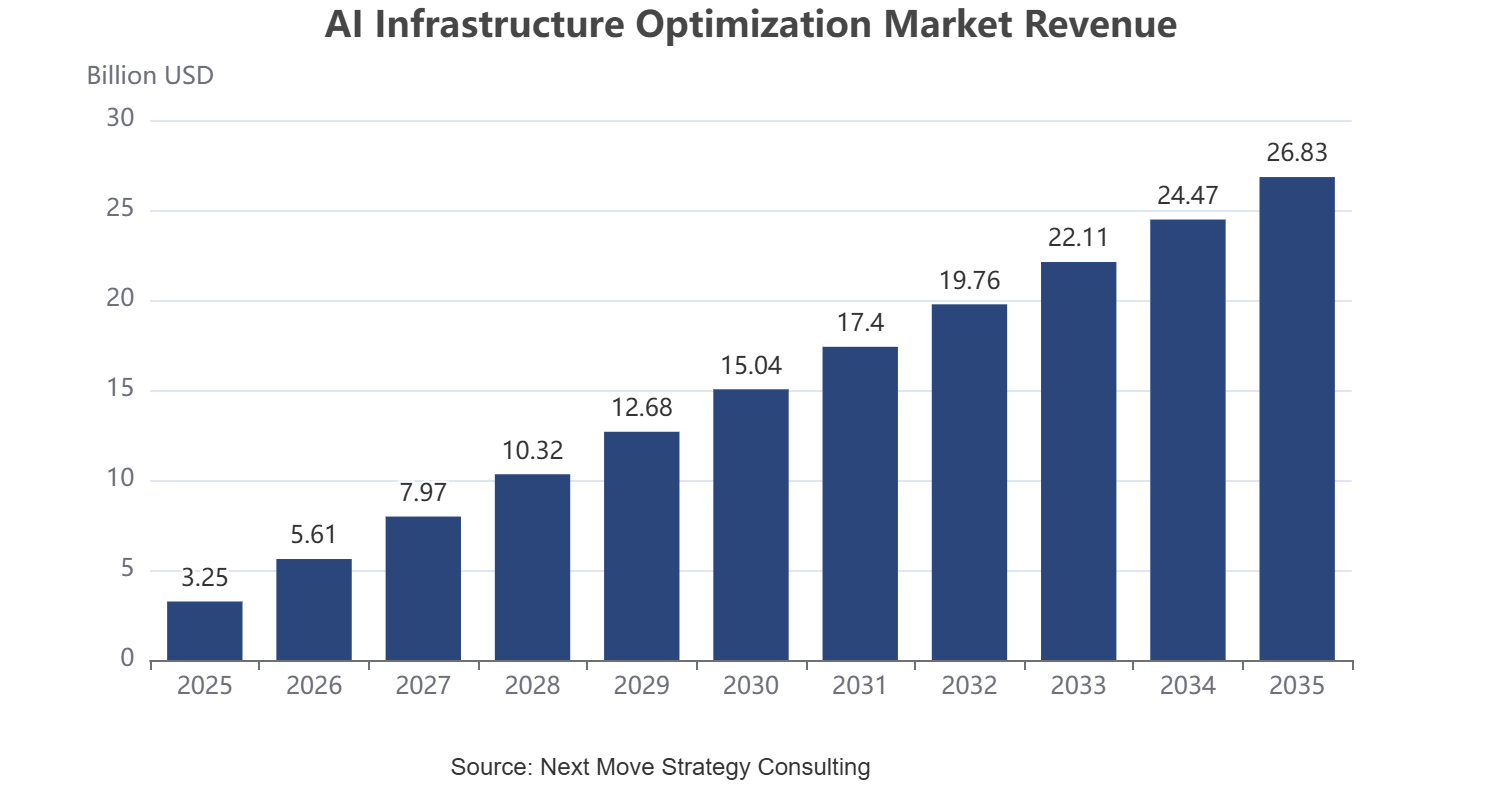
The global AI infrastructure optimization market size was valued at USD 3.25 Billion in 2025 and is estimated at USD 4.01 Billion in 2026, forecast to reach USD 26.83 Billion by 2035, expanding at a 23.5% CAGR between 2026 and 2035. North America leads with approximately a 42% share, while Software Optimization dominates all other component segments with approximately a 48% share.
We observed that growth is broadest in edge deployment and services categories, with GPU orchestration and cost optimization software recording the strongest structural gains through 2035.
|
Key Takeaways |
|
By Component: Software Optimization held the largest share of approximately 48% (USD 1.56 billion) in 2025; Services is the fastest-growing sub-segment at 30.3% CAGR from 2026-2035. |
|
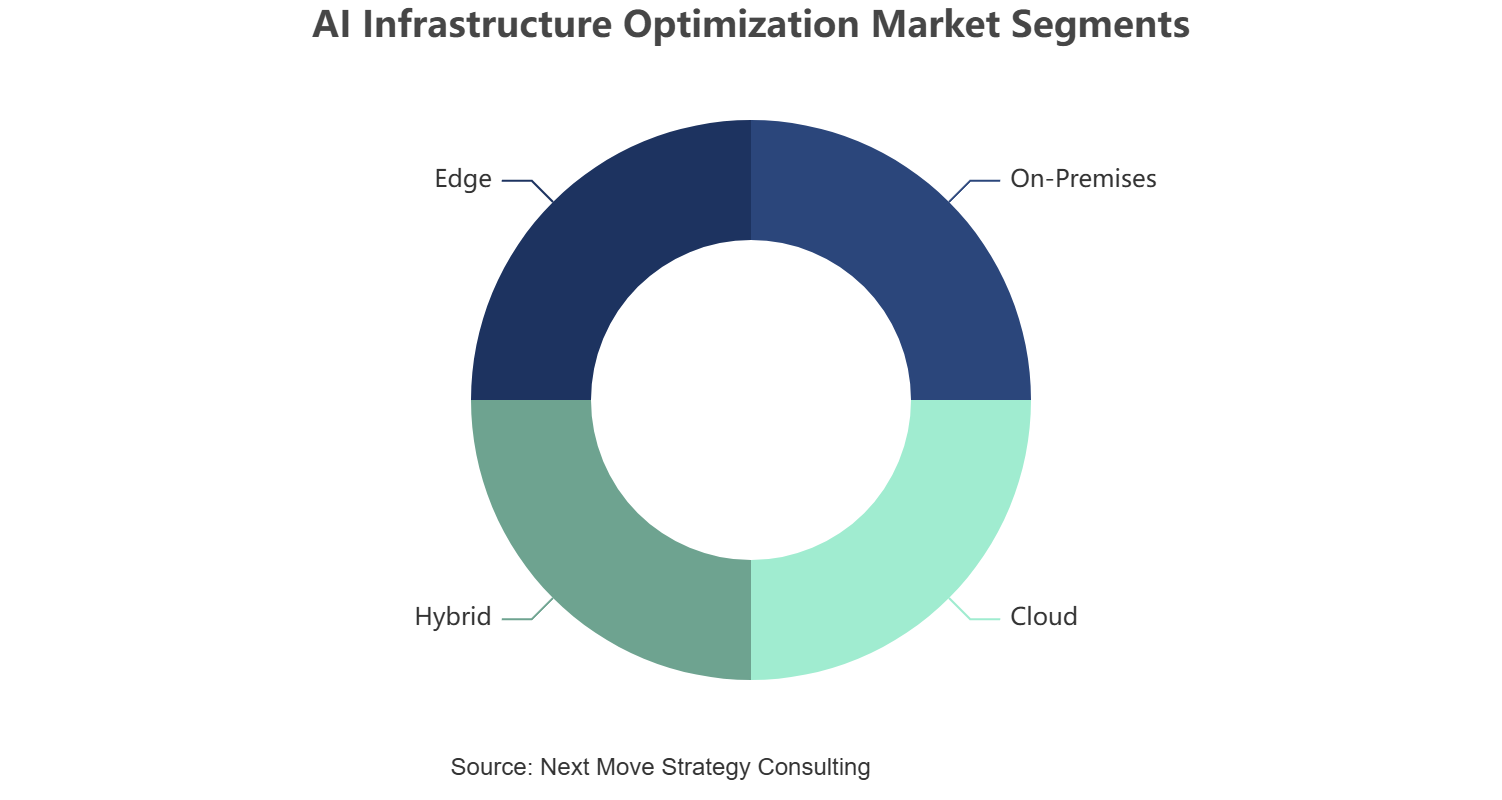
By Deployment Mode: Cloud held the largest share of approximately 46% (USD 1.50 billion) in 2025; Edge is the fastest-growing sub-segment at 34.0% CAGR from 2026-2035. |
|
By Workload Type: AI Training held the largest share of approximately 58% (USD 1.89 billion) in 2025; AI Inference is the fastest-growing sub-segment at 29.7% CAGR from 2026-2035. |
|
By Organization Size: Large Enterprises held the largest share of approximately 74% (USD 2.41 billion) in 2025; Small and Medium Enterprises are the fastest-growing sub-segment at 30.7% CAGR from 2026-2035. |
|
By Industry Vertical: IT held the largest share of approximately 28% (USD 0.91 billion) in 2025; Government and Defense is the fastest-growing sub-segment at 31.9% CAGR from 2026-2035. |
|
By End User: Cloud Service Providers held the largest share of approximately 44% (USD 1.43 billion) in 2025; Government Organizations is the fastest-growing sub-segment at 31.4% CAGR from 2026-2035. |
|
Dominant Region: North America dominated with approximately 42% revenue share (USD 1.37 billion) in 2025. |
|
Fastest-Growing Region: Asia-Pacific is expected to register the highest CAGR of 29.4% during 2026-2035. |
|
Dominant Country: The U.S. led with approximately USD 1.09 billion in 2025. |
|
Fastest-Growing Country: India is the fastest-growing country at approximately 30.0% CAGR from 2026-2035. |
Market Opportunity: The AI infrastructure optimization market is expected to create an absolute dollar opportunity of USD 22.82 billion between 2026 and 2035, presenting significant investment potential across GPU orchestration, data pipeline optimization, and edge inference platforms.
According to NMSC analysis, storage and data platform vendors are converging with GPU hardware providers into unified AI operating system architectures, a shift that favors suppliers capable of integrating compute, networking, and data optimization into a single deployable stack through 2035.
What Does the AI Infrastructure Optimization Industry Encompass?
The AI infrastructure optimization market encompasses the hardware, software, and services used to maximize the efficiency, utilization, and cost-effectiveness of AI training and inference infrastructure. Our assessment indicates that the scope spans data processing units and hardware acceleration cards, software for GPU scheduling, workload orchestration, infrastructure monitoring, cost optimization, and data pipeline optimization, and the consulting, implementation, and managed services that support cloud service providers, enterprises, and research institutions worldwide.
Regulatory frameworks including national AI strategies and data residency requirements shape deployment architecture decisions, pushing enterprises toward hybrid and sovereign cloud configurations. We observed that technology adoption is shifting toward unified AI operating system platforms that integrate storage, compute, and orchestration as GPU utilization economics become a board-level concern. NMSC's analysis indicates that rising graphics processing unit cluster scale is redefining infrastructure optimization requirements across the AI infrastructure optimization market.
|
Parameters |
Details |
|
Market Size in 2025 |
USD 3.25 Billion |
|
Market Size in 2026 |
USD 4.01 Billion |
|
Revenue Forecast in 2035 |
USD 26.83 Billion |
|
Growth Rate |
CAGR of 23.5% from 2026 to 2035 |
|
Analysis Period |
2025–2035 |
|
Base Year Considered |
2025 |
|
Forecast Period |
2026–2035 |
|
Market Size Estimation |
USD Billion |
|
Companies Profiled |
20 |
|
Countries Covered |
38 |
|
Market Share |
Available for Top 10 Companies |
Key Emerging Trends
Based on research conducted by NMSC, we found that four structural trends are reshaping technology adoption, sourcing strategy, and stakeholder engagement across the industry.
How Are Storage and Compute Platforms Converging into Unified AI Operating Systems?
Storage and data platform vendors are converging with GPU compute providers into unified AI operating system architectures that eliminate the need to stitch together separate infrastructure stacks. We observed that VAST Data's February 2026 announcement of a fully CUDA-accelerated AI data stack, built through expanded collaboration with NVIDIA, illustrates how vendors are consolidating ingestion, retrieval, analytics, and inference into a single deployable platform for enterprise customers.
Why Is Storage Moving Directly onto DPU Hardware?
Infrastructure vendors are increasingly running storage services directly on data processing units to reduce latency and simplify AI cluster architecture. Our findings suggest that this trend is accelerating fastest where edge computing utilization economics matter most, as WEKA's NeuralMesh architecture on NVIDIA BlueField-4 demonstrates how running storage on-DPU can materially reduce data movement overhead for large-scale AI clusters.
How Is Inference Scaling Reshaping Infrastructure Optimization Priorities?
Inference workload scaling is shifting infrastructure optimization priorities from raw training throughput toward token latency and GPU memory efficiency. We found that VAST Data's KV cache offload collaboration with NVIDIA Dynamo, reported to improve inference efficiency and reduce time-to-first-token, illustrates how vendors are re-architecting data platforms specifically around persistent, shared cache management for long-context and multi-agent inference workloads.
What Role Does Sovereign AI Infrastructure Investment Play in Market Expansion?
Sovereign and national research infrastructure investment is expanding demand for optimization platforms outside traditional hyperscaler accounts. We observed that VAST Data's selection to power Canadian national research host sites SciNet and SHARCNET illustrates how government-backed research computing programs are standardizing on commercial AI operating system platforms, elevating demand for infrastructure optimization software among research institutions and government organizations.
Growth Drivers and Restraints
Growth Catalyst and Risk Assessment Matrix
|
Factors |
Type |
(+/-) % Impact on CAGR |
Geographic Relevance |
Impact Timeline |
|
Rising enterprise GPU cluster deployment and utilization pressure |
Driver |
+4.8% |
Global |
2026–2035 |
|
Shift from AI training to inference-heavy workloads |
Driver |
+4.1% |
Global |
2026–2035 |
|
Sovereign and national AI infrastructure investment programs |
Driver |
+3.2% |
Asia-Pacific, MEA |
2026–2035 |
|
Growth in edge AI deployment for latency-sensitive applications |
Driver |
+2.9% |
North America, Asia-Pacific |
2026–2035 |
|
Rising cloud cost optimization and GPU rightsizing demand |
Driver |
+2.4% |
Global |
2026–2032 |
|
Storage and compute platform convergence around DPU architectures |
Driver |
+2.0% |
North America |
2026–2035 |
|
High cost and complexity of GPU infrastructure re-architecture |
Restraint |
-1.6% |
Global |
2026–2035 |
|
Shortage of specialized AI infrastructure engineering talent |
Restraint |
-1.2% |
Global |
2026–2035 |
|
Vendor lock-in risk from proprietary AI operating system stacks |
Restraint |
-0.9% |
North America, Europe |
2026–2035 |
What Is the Primary Growth Driver of the AI Infrastructure Optimization Market?
Rising enterprise GPU cluster deployment and utilization pressure is the primary driver of the market. The U.S. Department of Energy continues to document expanding federal investment in AI supercomputing infrastructure supporting national research priorities. We observed that this deployment growth, reinforced by GPU capital costs that push enterprises to maximize utilization, sustains baseline demand for both hardware and software optimization tools supplied to cloud service providers and large enterprises.
How Is the Shift Toward Inference Workloads Driving Market Growth?
The industry-wide shift from training-dominated to inference-heavy AI workloads is accelerating market growth by elevating demand for latency and memory optimization tools. NVIDIA's public documentation of BlueField-4 DPU adoption for AI factory data movement illustrates growing enterprise focus on inference efficiency. Our assessment indicates that this technology shift is accelerating adoption timelines for workload orchestration and data caching software across North America and Asia-Pacific hyperscale deployments.
What Is Restraining AI Infrastructure Optimization Market Expansion?
The high cost and complexity of GPU infrastructure re-architecture restrain adoption among mid-sized enterprises with constrained capital budgets. The U.S. National Institute of Standards and Technology continues to document the technical complexity of AI system infrastructure evaluation and benchmarking. We found that smaller enterprises face particular exposure, as limited in-house infrastructure engineering expertise constrains their ability to adopt advanced optimization platforms relative to hyperscale cloud service providers.
Pain Point Analysis of the AI Infrastructure Optimization Industry
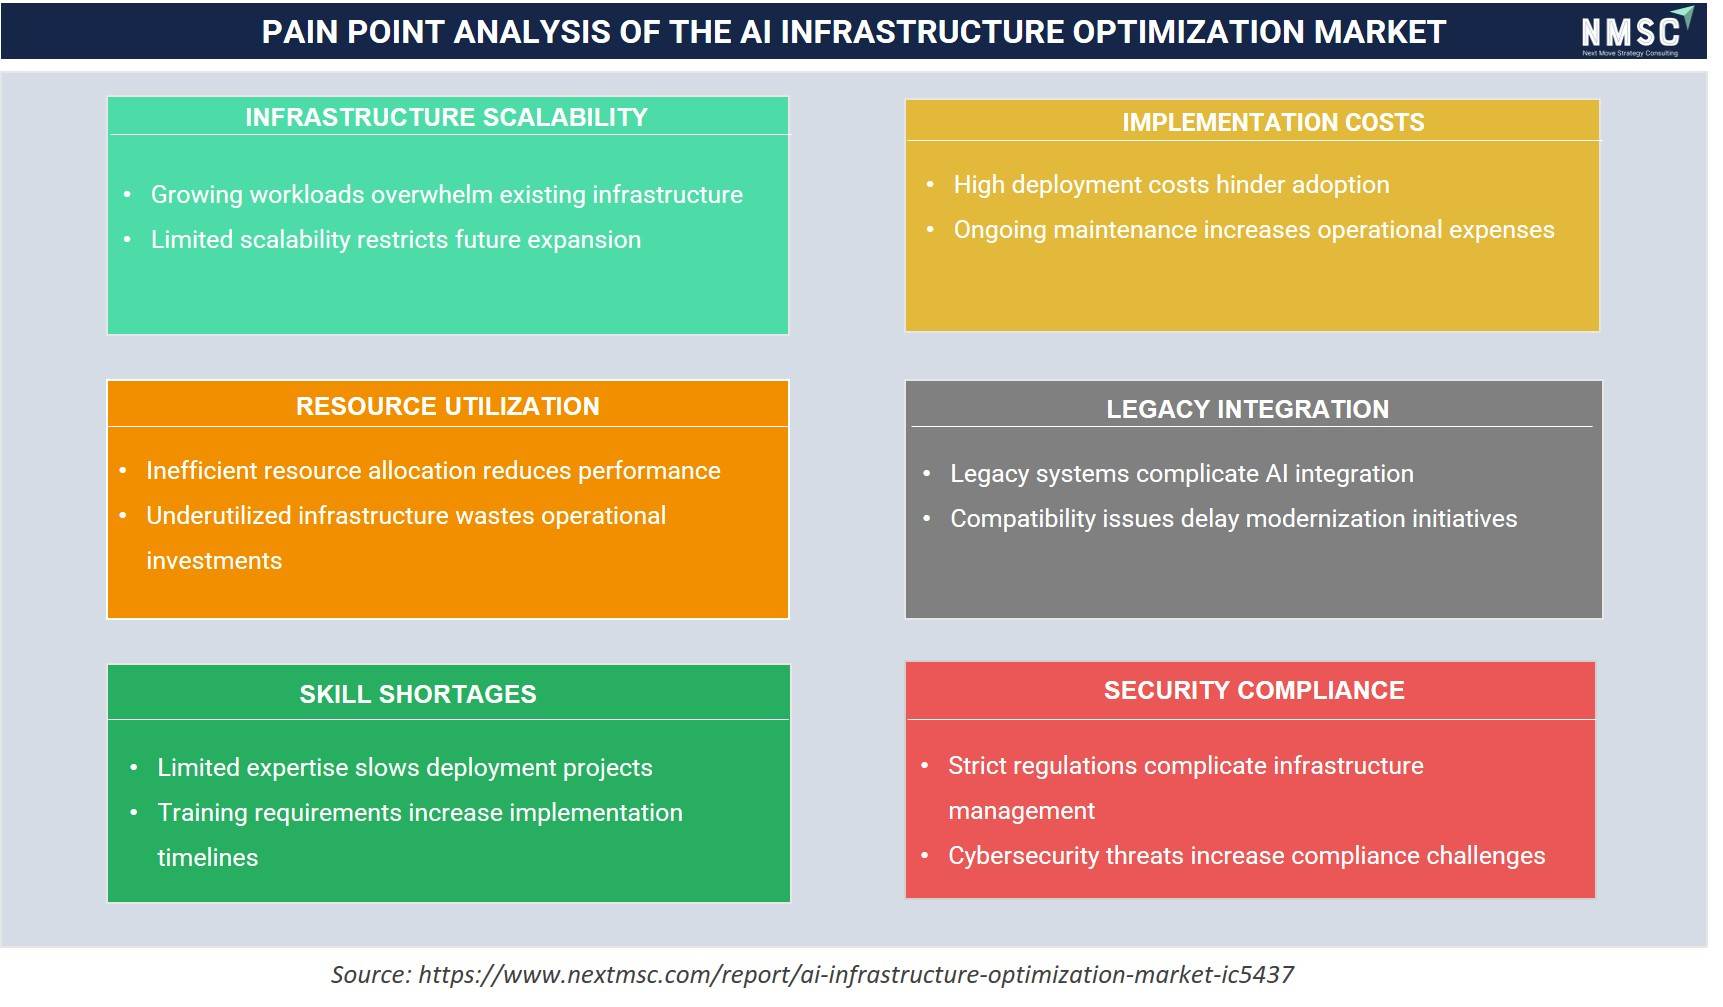
The above infographic presents a pain point analysis of the AI infrastructure optimization market, highlighting key challenges across scalability, resource use, skills, costs, legacy integration, and security. Growing workloads and limited scalability are restricting expansion, while inefficient resource allocation is reducing performance and wasting investments. Limited expertise and high costs are slowing deployment, and legacy systems are complicating integration. Strict regulations and cybersecurity threats are further increasing compliance challenges. Looking ahead, we observed that these pain points are driving demand for more scalable, cost-effective, and secure AI optimization solutions across the market.
Segmentation Analysis
Segment Sizing: By Component
|
Segment |
2025 (USD) |
2035 (USD) |
CAGR% (2026-2035) |
|
Software Optimization |
USD 1.56 Billion |
USD 13.61 Billion |
27.2% |
|
Hardware Optimization |
USD 1.17 Billion |
USD 7.61 Billion |
23.1% |
|
Services |
USD 0.52 Billion |
USD 5.62 Billion |
30.3% |
|
Total |
USD 3.25 Billion |
USD 26.83 Billion |
23.5% |
Which Component Segment Dominates the AI Infrastructure Optimization Industry?
Software Optimization led the market with USD 1.56 billion in 2025, supported by rising demand for GPU scheduling, workload orchestration, and cost optimization tools across enterprise AI deployments. We observed that Services is the fastest-growing component, expanding at a 30.3% CAGR from 2026 to 2035, as enterprises increasingly require consulting and implementation support to re-architect infrastructure around unified AI operating system platforms.
Segment Sizing: By Deployment Mode
|
Segment |
2025 (USD) |
2035 (USD) |
CAGR% (2026-2035) |
|
Cloud |
USD 1.50 Billion |
USD 11.79 Billion |
25.8% |
|
Hybrid |
USD 0.91 Billion |
USD 8.00 Billion |
27.3% |
|
On-Premises |
USD 0.59 Billion |
USD 3.43 Billion |
21.7% |
|
Edge |
USD 0.26 Billion |
USD 3.62 Billion |
34.0% |
|
Total |
USD 3.25 Billion |
USD 26.83 Billion |
23.5% |
Which Deployment Mode Segment Leads AI Infrastructure Optimization Market Demand?
Cloud deployment remained the dominant category, valued at USD 1.50 billion in 2025 on its established role as the primary environment for large-scale GPU cluster training and inference. Our findings suggest that Edge deployment is the fastest-growing mode, registering a 34.0% CAGR from 2026 to 2035, as latency-sensitive inference applications push optimization workloads closer to data generation points across industrial and telecommunications use cases.
Segment Sizing: By Industry Vertical
|
Segment |
2025 (USD) |
2035 (USD) |
CAGR% (2026-2035) |
|
IT |
USD 0.91 Billion |
USD 6.64 Billion |
24.7% |
|
BFSI |
USD 0.46 Billion |
USD 3.71 Billion |
26.2% |
|
Healthcare and Life Sciences |
USD 0.33 Billion |
USD 2.95 Billion |
27.8% |
|
Manufacturing |
USD 0.29 Billion |
USD 2.47 Billion |
26.7% |
|
Retail and E-commerce |
USD 0.26 Billion |
27.3% |
|
|
Telecommunications |
USD 0.23 Billion |
USD 1.72 Billion |
25.2% |
|
Media and Entertainment |
USD 0.20 Billion |
USD 1.53 Billion |
25.7% |
|
Automotive |
USD 0.20 Billion |
USD 1.84 Billion |
28.3% |
|
Energy and Utilities |
USD 0.16 Billion |
USD 1.37 Billion |
26.7% |
|
Government and Defense |
USD 0.13 Billion |
USD 1.57 Billion |
31.9% |
|
Education and Research |
USD 0.07 Billion |
USD 0.53 Billion |
26.2% |
|
Other Industries |
USD 0.03 Billion |
USD 0.24 Billion |
24.7% |
|
Total |
USD 3.25 Billion |
USD 26.83 Billion |
23.5% |
Which Industry Vertical Segment Is Most Widely Served in the AI Infrastructure Optimization Market?
IT remained the dominant industry vertical, reaching USD 0.91 billion in 2025 due to concentrated hyperscaler and cloud service provider infrastructure spending. Based on research conducted by NMSC, we found that Government and Defense represent the fastest-growing vertical at a 31.9% CAGR from 2026 to 2035, reflecting surging sovereign AI infrastructure investment and national research computing program expansion.
Growth Opportunities
Our analysis shows that three forward-looking opportunities stand out for stakeholders positioning within the AI infrastructure optimization market over the 2026-2035 forecast period.
How Can Unified AI Operating Systems Unlock Value for Cloud Service Providers?
Unified AI operating system platforms present a whitespace opportunity for vendors serving cloud service providers pursuing simplified, converged infrastructure stacks. Suppliers that commercialize integrated storage, compute, and orchestration platforms stand to capture recurring subscription revenue as cloud providers standardize infrastructure specifications across new GPU cluster buildouts.
Where Does Edge Inference Optimization Create New Demand Among Telecommunications Providers?
Telecommunications providers represent an underpenetrated opportunity for edge-optimized AI inference platforms supporting latency-sensitive network applications. Providers that develop cost-competitive edge orchestration solutions can secure long-term infrastructure contracts with telecommunications providers deploying distributed AI inference capacity closer to end users.
How Can DPU-Native Storage Benefit Research Institutions?
Research institutions managing large-scale, GPU-intensive workloads create an opportunity for vendors offering DPU-native storage and data caching platforms. Early movers that streamline cloud computing integration with sovereign research infrastructure can differentiate with government organizations and research institutions pursuing standardized, high-performance AI computing environments.
Regional Outlook
Geographic Performance Snapshot
|
Region |
2025 (USD) |
2035 (USD) |
CAGR% (2026-2035) |
Key Driver |
|
North America |
USD 1.37 Billion |
USD 10.04 Billion |
24.8% |
Hyperscaler GPU cluster buildouts and enterprise AI adoption |
|
Asia-Pacific |
USD 0.85 Billion |
USD 8.61 Billion |
29.4% |
Sovereign AI infrastructure investment and expanding cloud capacity |
|
Europe |
USD 0.65 Billion |
USD 4.61 Billion |
24.3% |
EU AI infrastructure investment and data residency-driven deployment |
|
Middle East & Africa |
USD 0.23 Billion |
USD 2.24 Billion |
28.9% |
National AI strategy investment and sovereign cloud buildout |
|
Latin America |
USD 0.16 Billion |
USD 1.33 Billion |
26.4% |
Growing enterprise cloud AI adoption and data center investment |
|
Total |
USD 3.25 Billion |
USD 26.83 Billion |
23.5% |
-- |
North America
North America leads the AI infrastructure optimization market with an established base of hyperscale cloud service providers and enterprise GPU cluster deployments. We observed that sustained AI capital expenditure and DPU-native storage adoption sustain demand for both hardware and software optimization tools. Technology adoption remains advanced, with unified AI operating system platforms driving demand across the region's largest hyperscaler and enterprise accounts.
Europe
Europe's market reflects a maturing, compliance-influenced landscape shaped by European Commission data residency and AI governance frameworks. Our findings suggest that enterprises across Germany, France, and the UK are accelerating adoption of hybrid and sovereign cloud deployment models. Technology adoption favors data residency-compliant optimization platforms, supported by regional providers investing in compliant infrastructure architectures.
Asia-Pacific
Asia-Pacific is the fastest-growing AI infrastructure optimization market region, propelled by sovereign AI infrastructure investment and expanding cloud capacity across China and India. We found that regulatory frameworks remain less harmonized than in Europe, giving vendors flexibility to scale deployment rapidly. Technology adoption is accelerating as regional cloud service providers expand GPU cluster capacity to serve growing enterprise and government AI demand.
Middle East & Africa
The AI infrastructure optimization market in the Middle East & Africa is expanding as Gulf Cooperation Council economies invest in national AI strategy and sovereign cloud infrastructure. Our analysis shows that Saudi Arabia and the UAE are attracting AI infrastructure investment tied to national digital transformation programs. Regulatory influence remains developing, while technology adoption is gradually shifting toward hybrid and edge deployment as regional governments modernize computing infrastructure.
Latin America
Latin America's market is supported by growing enterprise cloud AI adoption and data center investment across Brazil and Argentina. We observed that regulatory frameworks are less stringent than in North America or Europe, though multinational enterprises operating locally are introducing standardized infrastructure optimization specifications. Technology adoption remains centered on cloud deployment, with competitive intensity increasing as regional integrators partner with global optimization vendors.
U.S.
Based on our estimates, the U.S. market was valued at approximately USD 1.09 billion in 2025 and is projected to reach USD 6.30 billion by 2035, growing at a 21.5% CAGR. Demand is anchored by extensive hyperscale GPU cluster deployment and enterprise AI capital expenditure. Technology penetration favors unified AI operating system platforms and DPU-native storage, and competitive intensity remains high among established hardware and software vendors serving national hyperscaler accounts.
Canada
The market in Canada reached roughly USD 0.16 billion in 2025 and is forecast to hit USD 0.91 billion by 2035 at a 21.0% CAGR. Demand structure benefits from national research computing programs, illustrated by VAST Data's selection to power SciNet and SHARCNET host sites. Technology penetration is rising as research institutions request GPU-accelerated data platforms, with competitive intensity moderate given reliance on infrastructure supply from U.S.-based vendors.
UK
As per our estimate, the UK market stood at about USD 0.13 billion in 2025, advancing toward USD 0.72 billion by 2035 at a 21.0% CAGR. Demand is driven by financial services and enterprise AI adoption requiring compliant infrastructure architectures. Regulatory influence from UK data protection requirements is notable, technology penetration favors hybrid deployment, and competitive intensity remains steady among domestic and multinational suppliers.
Germany
According to our analysis, Germany's market was valued at near USD 0.16 billion in 2025 and is set to reach USD 0.92 billion by 2035, expanding at a 21.8% CAGR. Demand structure benefits from Germany's large industrial manufacturing and automotive AI adoption base. Regulatory influence from European Commission data governance frameworks shapes procurement specifications, while technology penetration favors sovereign cloud deployment among leading providers.
France
Based on our estimates, France's market reached approximately USD 0.09 billion in 2025, projected to climb to USD 0.49 billion by 2035 at a 20.5% CAGR. Demand is supported by France's national AI strategy investment and growing enterprise cloud adoption. Regulatory influence from national data residency requirements is notable, and competitive intensity remains moderate given the concentration of regional integrators serving domestic enterprise accounts.
China
The market in China stood at roughly USD 0.25 billion in 2025 and is forecast to reach USD 1.82 billion by 2035, registering a 24.5% CAGR. Demand is fueled by expanding domestic GPU cluster capacity and a dense base of regional cloud infrastructure vendors. Regulatory influence is increasing gradually, technology penetration is accelerating through domestic hardware and software co-development, and competitive intensity remains elevated among numerous China-based suppliers.
India
As per our estimate, India's market was valued at about USD 0.14 billion in 2025, projected to reach USD 1.43 billion by 2035 at a 30.0% CAGR, the fastest among covered countries. Demand structure reflects rising sovereign AI infrastructure investment and expanding enterprise cloud adoption. Regulatory influence remains developing, while technology penetration is rising quickly as global vendors localize infrastructure sourcing to serve India's growing digital economy.
Japan
According to our analysis, Japan's market reached close to USD 0.14 billion in 2025 and is expected to hit USD 0.87 billion by 2035, growing at a 23.0% CAGR. Demand is supported by Japan's established manufacturing and automotive AI adoption base. Regulatory influence is well established, technology penetration is advanced, and competitive intensity remains high among long-standing domestic and multinational infrastructure suppliers.
South Korea
Based on our estimates, South Korea's market stood at approximately USD 0.09 billion in 2025, forecast to reach USD 0.65 billion by 2035 at a 25.5% CAGR. Demand structure benefits from the country's dense semiconductor and electronics manufacturing and AI adoption momentum. Technology penetration is high, with domestic vendors supplying hardware acceleration components, and competitive intensity remains pronounced amid rapid platform innovation cycles.
Australia
The AI infrastructure optimization market in Australia reached about USD 0.04 billion in 2025 and is projected to reach USD 0.29 billion by 2035, expanding at a 24.0% CAGR. Demand is supported by growing enterprise cloud AI adoption and national research computing investment. Regulatory influence stems from national data governance guidance, while technology penetration favors cloud deployment amid moderate competitive intensity.
UAE
As per our estimate, the UAE market was valued at near USD 0.07 billion in 2025, projected to reach USD 0.59 billion by 2035 at a 27.0% CAGR. Demand structure is shaped by the UAE's role as a regional AI innovation and sovereign cloud hub. Regulatory influence remains moderate, technology penetration is improving through hybrid deployment adoption, and competitive intensity is rising as vendors expand regional service portfolios.
Saudi Arabia
According to our analysis, Saudi Arabia's market reached roughly USD 0.06 billion in 2025 and is expected to hit USD 0.59 billion by 2035, growing at a 28.0% CAGR. Demand is driven by Vision 2030-linked national AI strategy investment and expanding sovereign cloud infrastructure. Regulatory influence is developing under national digital transformation guidelines, and technology penetration is advancing as domestic and multinational vendors scale supply.
South Africa
Based on our estimates, South Africa's market stood at about USD 0.02 billion in 2025, forecast to reach USD 0.15 billion by 2035 at a 23.0% CAGR. Demand structure reflects a developing enterprise cloud and AI adoption base serving regional Southern African markets. Regulatory influence remains moderate, technology penetration is gradually improving, and competitive intensity is limited given reliance on infrastructure supply from international vendors.
Brazil
The market in Brazil reached approximately USD 0.07 billion in 2025 and is projected to reach USD 0.47 billion by 2035, registering a 24.0% CAGR. Demand is underpinned by Brazil's large domestic enterprise cloud adoption and expanding data center investment. Regulatory influence stems from national data protection requirements, technology penetration favors cloud deployment, and competitive intensity remains moderate among regional integrators.
Argentina
As per our estimate, Argentina's market was valued at near USD 0.02 billion in 2025, projected to reach USD 0.15 billion by 2035 at a 22.5% CAGR. Demand structure is supported by steady enterprise cloud adoption despite macroeconomic volatility. Regulatory influence remains limited, technology penetration is modest, and competitive intensity is centered on a small number of regional integrators serving domestic enterprise accounts.
Competitive Landscape
We observed that the AI infrastructure optimization market features a moderately consolidated competitive landscape, with global hardware majors competing alongside specialized software and data platform vendors on integration depth, performance, and delivery scale.
|
Key Takeaways |
Details |
|
Market Structure |
Moderately consolidated; the top companies profiled in this report collectively account for a majority of global AI infrastructure optimization revenue, while numerous specialized software vendors serve niche orchestration, caching, and cost optimization demand. |
|
Innovation Focus |
Unified AI operating system convergence, DPU-native storage, and inference-optimized data caching dominate current innovation pipelines across leading vendors. |
|
M&A Activity |
Selective partnership-driven consolidation, exemplified by VAST Data's expanded NVIDIA collaboration and Microsoft Azure partnership to extend AI operating system reach across hybrid and multi-cloud environments. |
How Do Companies Compete in the AI Infrastructure Optimization Industry?
Companies compete primarily on integration depth, GPU utilization performance, and platform breadth across the industry. Global hardware majors such as NVIDIA Corporation and Broadcom Inc. leverage broad compute and networking portfolios to serve hyperscale cloud service providers, while specialized data platform vendors such as VAST Data Inc. and WEKA IO Inc. compete on inference latency and storage architecture innovation for demanding enterprise AI workloads.
Which Competitive Archetypes Dominate the AI Infrastructure Optimization Market?
Two archetypes dominate the market: diversified hardware and systems majors offering integrated compute, networking, and storage portfolios, and specialized software vendors focused on orchestration, cost optimization, or data caching niches. NVIDIA Corporation and Hewlett Packard Enterprise Company exemplify the diversified archetype through combined hardware and platform offerings, while CAST AI Group Inc. and Alluxio Inc. exemplify the specialist archetype serving cost optimization and data access niches.
How Are Companies Differentiating Through Innovation in the Market?
Innovation and differentiation strategy increasingly center on unified AI operating system architecture and DPU-native storage integration. VAST Data's CUDA-accelerated data stack and WEKA's NeuralMesh architecture on NVIDIA BlueField-4 both illustrate how vendors are embedding storage services directly into GPU-adjacent hardware. Our analysis shows that vendors unable to demonstrate deep NVIDIA ecosystem integration risk exclusion from hyperscaler and large enterprise procurement, where compatibility increasingly shapes vendor selection.
What M&A and Expansion Activity Is Shaping the Market?
Partnerships, platform expansion, and ecosystem integration continue to shape competitive positioning within the industry. VAST Data's expanded NVIDIA collaboration and its November 2025 partnership with Microsoft to bring its AI operating system to Azure illustrate how vendors pursue distribution scale through hyperscaler alliances rather than acquisitions alone. These moves illustrate how diversified groups pursue geographic expansion and platform breadth across cloud, enterprise, and government customer segments.
Key Market Players
Our assessment indicates that the following 20 companies are actively shaping platform innovation, ecosystem integration, and go-to-market strategy within the global AI infrastructure optimization market.
-
NVIDIA Corporation
-
Intel Corporation
-
International Business Machines Corporation
-
Advanced Micro Devices Inc.
-
Broadcom Inc.
-
Cisco Systems Inc.
-
Marvell Technology Inc.
-
VAST Data Inc.
-
WEKA IO Inc.
-
DataDirect Networks Inc.
-
Domino Data Lab Inc.
-
Anyscale Inc.
-
CAST AI Group Inc.
-
MinIO Inc.
-
Alluxio Inc.
-
Lightbits Labs Ltd.
-
Lightning AI
-
Union.ai Inc.
Latest Developments
We found that recent product and partnership announcements within the AI infrastructure optimization market are concentrated on unified AI operating system platforms and DPU-native storage integration, reflecting the industry's broader convergence around inference-optimized architectures.
|
Date |
Event |
|
March 2026 |
NVIDIA introduced its Vera Rubin platform, positioning the next-generation AI computing architecture around large-scale AI workloads and agentic AI. The platform integrates GPUs, CPUs, networking, storage, and software to improve the efficiency and scalability of AI infrastructure. |
|
February 2026 |
VAST Data announced an end-to-end, fully CUDA-accelerated AI data stack at VAST Forward 2026, delivered through an expanded collaboration with NVIDIA and new CNode-X GPU-accelerated servers available through Cisco, HPE, and Supermicro. |
Consumer Behavior Analysis of the AI Infrastructure Optimization Industry
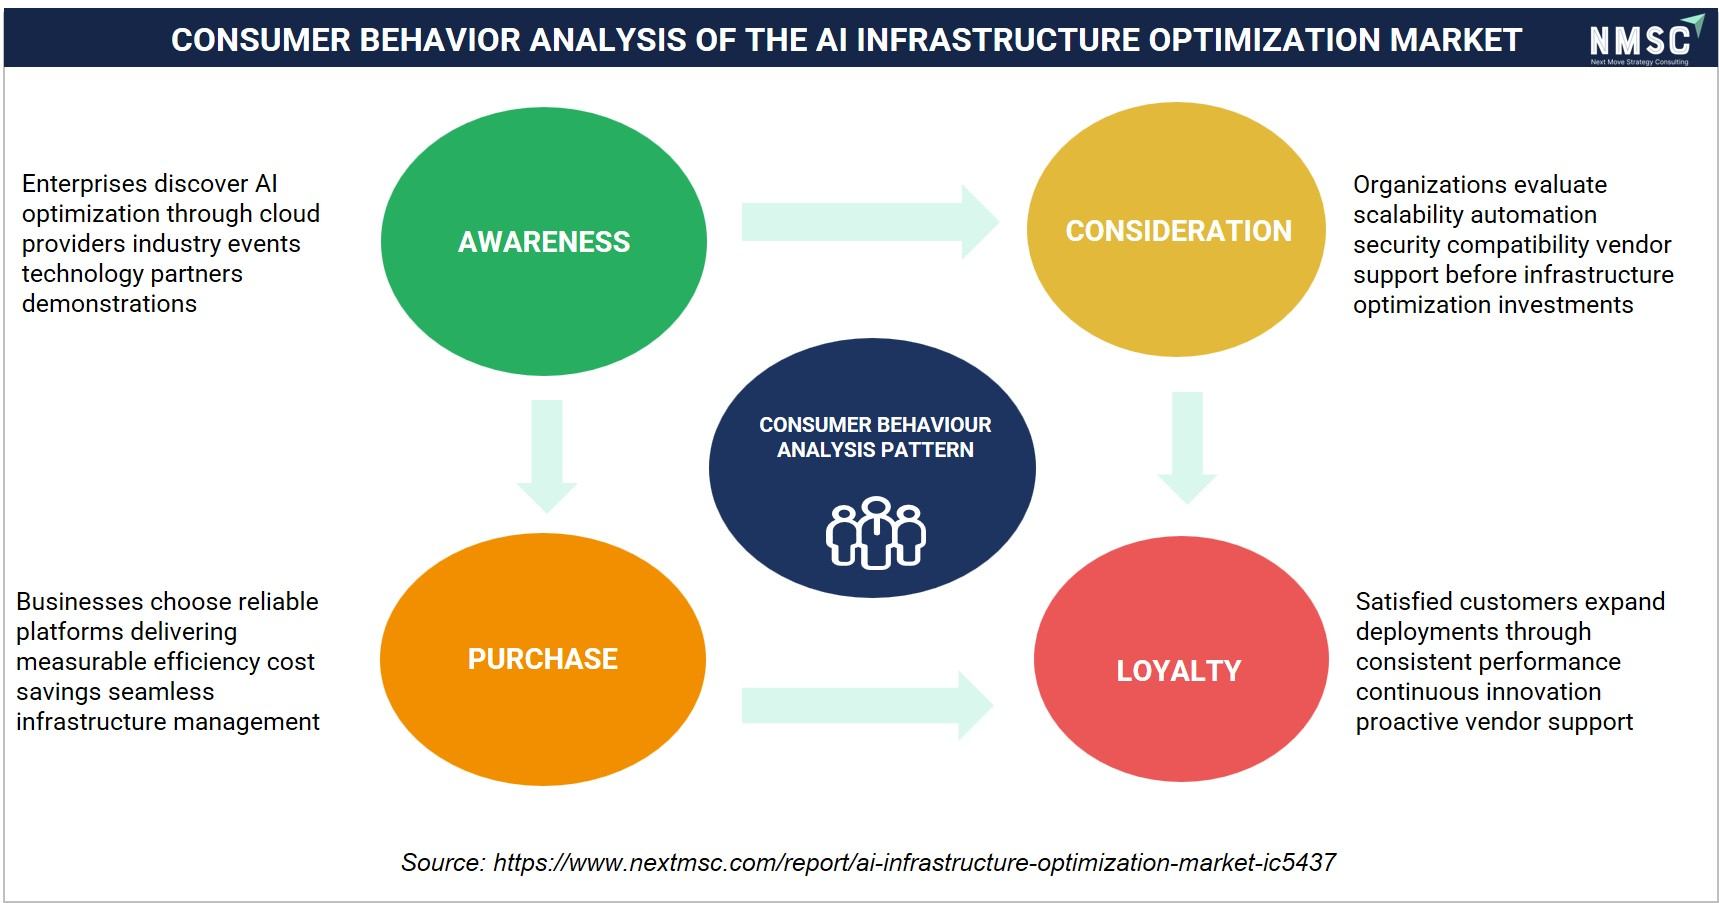
The above infographic presents a consumer behavior analysis of the AI infrastructure optimization market, mapping the journey from awareness to loyalty. Enterprises discover AI optimization solutions through cloud providers, industry events, and technology partners, leading them to evaluate scalability, automation, security, and vendor support before making investment decisions. Businesses then choose reliable platforms that deliver measurable efficiency, cost savings, and seamless infrastructure management. At the same time, satisfaction is reinforced by consistent performance and proactive support, encouraging customers to expand their deployments. Looking ahead, we observed that these behavioral patterns collectively shape adoption and long-term engagement across the enterprise sector.
Investment Opportunities
What Capital Inflows Are Targeting the AI Infrastructure Optimization Market?
Capital inflows into the market are increasingly directed toward unified AI operating system platform development and DPU-native storage architecture. Strategic partnerships continue to expand distribution scale, as seen in VAST Data's Microsoft Azure and NVIDIA collaborations. We observed that investors favor vendors demonstrating deep hyperscaler ecosystem integration, viewing platform-level partnerships as a proxy for long-term revenue durability.
How Is Infrastructure Investment Supporting AI Infrastructure Optimization Market Delivery?
Infrastructure investment is expanding GPU cluster and data center capacity globally, particularly across North America and Asia-Pacific, to serve rising enterprise and sovereign AI demand. Our findings suggest that suppliers are investing in data center cooling and DPU-native storage capabilities to improve infrastructure efficiency across GPU cluster deployments supporting growing training and inference customer volumes.
What ESG Considerations Are Shaping AI Infrastructure Optimization Investment Decisions?
Environmental, social, and governance considerations increasingly factor into investment decisions, with energy efficiency of GPU clusters and reduced data center power consumption as key criteria. We found that investors increasingly favor providers with documented GPU utilization improvement roadmaps, treating power-per-token efficiency gains as a governance indicator alongside overall data center energy consumption disclosure.
Key Benefits for Stakeholders
How Does This Report Benefit Enterprise and Industry Leaders?
Enterprise and industry leaders gain access to validated segmentation, competitive benchmarking, and regional demand forecasts that support sourcing and technology-investment decisions across the AI infrastructure optimization industry. Our analysis shows that detailed component, deployment mode, and industry vertical breakdowns help procurement and infrastructure planning teams align vendor selection with performance and integration requirements.
How Does This Report Benefit Investors and Financial Analysts?
Investors and financial analysts benefit from consistent, single-point market size and CAGR estimates that support valuation and capital-allocation decisions across the AI infrastructure optimization supply chain. We observed that the report's regional and segment-level growth differentials help identify which hardware and software vendors are best positioned to capture above-market growth in edge and services categories through 2035.
How Does This Report Benefit Technology Vendors and Product Teams?
Technology vendors and product teams gain insight into emerging requirements, including DPU-native storage, inference-optimized caching, and unified AI operating system architecture, that are reshaping the industry. Our findings suggest that this analysis helps R&D teams prioritize development roadmaps around NVIDIA ecosystem integration and workload orchestration capabilities increasingly required in hyperscaler and large enterprise procurement.
Key Market Segments
By Component
-
Hardware Optimization
-
Data Processing Units
-
Infrastructure Processing Units
-
SmartNICs
-
Hardware Acceleration Cards
-
-
Software Optimization
-
Resource Management
-
GPU Virtualization
-
GPU Scheduling
-
Resource Allocation
-
-
Workload Orchestration
-
Training Orchestration
-
Inference Orchestration
-
Cluster Scheduling
-
-
Infrastructure Monitoring
-
Performance Monitoring
-
Resource Utilization Monitoring
-
Bottleneck Detection
-
-
Cost Optimization
-
Cloud Cost Optimization
-
Capacity Optimization
-
Resource Rightsizing
-
-
Data Optimization
-
Data Pipeline Optimization
-
Data Caching
-
Parallel File Systems
-
Data Access Optimization
-
-
Infrastructure Automation
-
Infrastructure Provisioning
-
Auto Scaling
-
Policy Automation
-
-
Optimization Frameworks
-
Compiler Optimization
-
Runtime Optimization
-
Software Libraries
-
-
-
Services
-
Consulting Services
-
Implementation Services
-
Integration Services
-
Managed Services
-
Support Services
-
Training Services
-
By Deployment Mode
-
On-Premises
-
Cloud
-
Hybrid
-
Edge
By Workload Type
-
AI Training
-
AI Inference
By Organization Size
-
Large Enterprises
-
Small and Medium Enterprises
By Industry Vertical
-
IT
-
BFSI
-
Healthcare and Life Sciences
-
Manufacturing
-
Retail and E-commerce
-
Media and Entertainment
-
Telecommunications
-
Automotive
-
Energy and Utilities
-
Government and Defense
-
Education and Research
-
Other Industries
By End User
-
Cloud Service Providers
-
Enterprises
-
Government Organizations
-
Research Institutions
-
Telecommunications Providers
By Region
-
North America: U.S., Canada, Mexico
-
Europe: UK, Germany, France, Italy, Spain, Sweden, Denmark, Finland, Netherlands, Rest of Europe
-
Asia-Pacific: China, India, Japan, South Korea, Taiwan, Indonesia, Vietnam, Australia, Philippines, Malaysia, Rest of APAC
-
Middle East & Africa: Saudi Arabia, UAE, Egypt, Israel, Turkey, Nigeria, South Africa, Rest of MEA
-
Latin America: Brazil, Argentina, Chile, Colombia, Rest of LATAM
Conclusion and Recommendations
What Is the Long-Term Outlook for the AI Infrastructure Optimization Market?
The long-term outlook for the market remains highly positive, with global revenue projected to grow from USD 3.25 Billion in 2025 to USD 26.83 Billion by 2035 at a 23.5% CAGR. We observed that rising GPU cluster deployment, the shift toward inference-heavy workloads, and sovereign AI infrastructure investment will continue underpinning growth across cloud, enterprise, and government customer segments through the forecast period.
What Strategic Positioning Should AI Infrastructure Optimization Vendors Pursue?
Vendors should prioritize unified AI operating system development and deep NVIDIA ecosystem integration while pursuing hyperscaler and government partnership channels to secure long-term revenue growth. Our assessment indicates that providers investing early in DPU-native storage and inference-optimized caching will be best positioned to capture premium pricing within the AI infrastructure optimization market.
How Attractive Is the AI Infrastructure Optimization Market for New Investment?
The AI infrastructure optimization industry presents a highly attractive investment case, supported by a USD 22.82 billion absolute dollar opportunity between 2026 and 2035 and above-average growth in Asia-Pacific and services categories. We found that investment attractiveness is highest for providers combining platform integration depth with hyperscaler distribution partnerships, positioning them to serve both cloud-native and sovereign infrastructure customer segments simultaneously.
What Market Shifts and Key Risks Should Stakeholders Monitor?
Stakeholders should monitor the high cost of infrastructure re-architecture, shortage of specialized AI infrastructure engineering talent, and vendor lock-in risk from proprietary AI operating system stacks as key risks to the AI infrastructure optimization market. Our analysis shows that vendors unable to adapt to open, interoperable architectures risk losing enterprise accounts to competitors with more portable, standards-aligned platforms, particularly as multi-cloud strategies gain adoption.
What Are the Key Growth Pathways for the AI Infrastructure Optimization Market?
Key growth pathways include expanding unified AI operating system portfolios, scaling DPU-native storage and inference caching capabilities, and deepening penetration into government organizations and research institution customer segments. NMSC's analysis indicates that vendors pursuing these pathways while maintaining interoperability across hardware ecosystems will be best positioned to capture the market's projected growth through 2035.
About the Author
 Mayurima Roy is a research analyst delivering data-driven insights that support strategic planning and market understanding. She combines analytical rigor with strong content development skills, translating complex information into clear, actionable narratives for diverse audiences. Her work includes structured research, trend tracking, competitive assessment, and insight-led content creation that supports informed decision-making. Curious and detail-oriented by nature, she continually deepens her understanding of evolving markets while pursuing creative interests such as crafting and video creation.
About the Reviewer
 Supradip Baul is an accomplished business consultant and strategist with over a decade of rich experience in market intelligence, strategy, technology, and business transformation. His work has included rigorous qualitative and quantitative analysis across multiple industries, helping clients shape investment decisions and long-term roadmaps. Earlier in his career, he was associated with Gartner, where he contributed to industry-leading reports and market share analyses. He has worked with leading global companies and holds an MBA with a dual specialization in Marketing and Finance.
At Next Move Strategy Consulting, we understand that insightful market research is the cornerstone of successful business decisions. That's why we employ a robust and multifaceted approach, combining various methodologies to deliver the most accurate and actionable data for our clients.

Research Landscape
We navigate the world of research with two primary approaches:
Qualitative Approach
Our qualitative research methodologies involve immersive techniques such as in-depth interviews, focus groups, and observational studies. By engaging directly with individuals and stakeholders, we uncover valuable insights that quantitative data alone may overlook.

Quantitative Research
In tandem with qualitative methodologies, NMSC leverages the power of Quantitative Research to provide a robust foundation of numerical insights. Through systematic data collection and analysis, we quantify patterns, preferences, and market trends, offering a comprehensive view of the business landscape.
Our quantitative research approach employs diverse tools, including surveys, experiments, and statistical modelling. These methodologies enable us to gather data from a large and representative sample, ensuring the statistical significance of our findings. By employing structured questionnaires and standardized data collection methods, we guarantee the reliability and validity of the information we present to our clients.
Quantitative research is particularly effective in measuring the prevalence of trends, assessing market size, and gauging the impact of various factors on consumer behavior. The numerical precision attained through this approach equips our clients with actionable insights, facilitating data-driven decision-making and strategy formulation.


Our Specialized Toolbox for Industry-Specific Market Research
We deploy a specialized arsenal of techniques tailored to meet your unique requirements. Here's a glimpse into our comprehensive toolbox:

Information Procurement
The stage entails acquiring market data or relevant information through various sources and methodologies.


Market Research Approach
We utilize both top-down and bottom-up approaches in market research analysis to achieve a comprehensive understanding of the market dynamics, leveraging the broad perspective of industry trends and macroeconomic factors alongside detailed insights from specific segments and individual companies.

Porters Five Forces Analysis
We conduct Porter's Five Forces analysis to evaluate the competitive landscape of an industry, providing us with insights into factors that affect profitability and strategic positioning.

SWOT Analysis

Forecasting
We utilize a forecasting model to predict future consumption by considering parameters like population, economics, regulations, market competition, drivers, constraints, technology, and pricing. We also employ statistical techniques such as multilinear regression, exponential smoothing, moving average, ARIMA, and Monte Carlo simulations for accurate predictions. In econometric forecasting, we analyzed short-term and long-term event impacts, attributing values based on regulatory frameworks, economic factors, and market events.





 Speak to Our Analyst