Cotton Candy Machines Market Global Industry Analysis and Forecast (2026–2035)

Cotton Candy Machines Market size was USD 873.11 Million in 2026, projected to reach USD 1,425.75 Million by 2035, growing at a CAGR of 5.6% from 2026 to 2035. Key drivers include rising commercial entertainment demand, retail impulse purchase expansion, and vending channel growth, with North America leading the market.

Download Free Sample PDF
Base Year (2025)
$826.81 Billion
Forecast (2035)
$1,425.75 Billion
CAGR (2026-2035)
5.6%
Top Region
North America

What Is the Cotton Candy Machines Market Size?

The global Cotton Candy Machines Market reached USD 826.81 Million in 2025 and is estimated at USD 873.11 Million in 2026, forecast to reach USD 1,425.75 Million by 2035 at a CAGR of 5.6% between 2026 and 2035. North America leads with approximately 34% revenue share in 2025, while Commercial Cotton Candy Machines are the dominant product type, holding approximately 51% of total market revenue.

Our assessment indicates that material and operational upgrades are reshaping equipment design. Manufacturers are adopting stainless steel bowls, improved insulation, and programmable spinning speeds. These changes reduce downtime and simplify cleaning. Commercial operators running high-traffic venues now demand machines that sustain continuous output across long shifts. Scale expectations are rising as event and retail operators expand their dessert offerings.

Cotton Candy Machines Market Global Industry Analysis and Forecast (2026–2035) Revenue Forecast

Values in USD Billion

2025 $0.83 Billion
2025
2026 $0.87 Billion
2026
2027 $0.92 Billion
2027
2028 $0.97 Billion
2028
2029 $1.03 Billion
2029
2030 $1.09 Billion
2030
2031 $1.15 Billion
2031
2032 $1.21 Billion
2032
2033 $1.28 Billion
2033
2034 $1.35 Billion
2034
2035 $1.43 Billion
2035

Key Takeaways

By Product Type: Commercial Cotton Candy Machines held the largest share, expanding from USD 423.70 Million in 2025 to USD 722.52 Million by 2035; Automatic Cotton Candy Vending Machines are the fastest-growing at 5.9% CAGR from 2026–2035.

By Heating Technology: Standard Heating Element Machines held the largest share, expanding from USD 498.55 Million in 2025 to USD 846.83 Million by 2035; Induction Heating Machines are the fastest-growing at 5.8% CAGR from 2026–2035.

By Application: Entertainment & Amusement Venues held the largest share, expanding from USD 350.30 Million in 2025 to USD 643.41 Million by 2035; Retail & Vending Operations is the fastest-growing at 6.4% CAGR from 2026–2035.

By Distribution Channel: Online Retail held the largest share, expanding from USD 365.25 Million in 2025 to USD 711.76 Million by 2035, while also growing at 6.9% CAGR from 2026–2035.

Dominant Region: North America dominated the global market with a 34.0% revenue share (USD 281.12 Million) in 2025. This position is supported by a dense network of theme parks, cinema chains, and steady replacement demand across established commercial operators in the U.S. and Canada.

Fastest-Growing Region: Asia-Pacific is expected to register the highest CAGR of 8.4% during 2026–2035, driven by expanding urban entertainment districts, shopping centers, and tourism attractions across high-density markets.

Dominant Country: The U.S. led the market with an estimated USD 219.27 Million in 2025 (~78% of North America), supported by commercial concession operators at sports arenas, theme parks, and cinema chains.

Fastest-Growing Country: India is among the fastest-growing major countries, projected to expand from USD 44.65 Million in 2025 at a CAGR of approximately 10.2%, driven by temple fairs, wedding and festival catering, and the growth of organized amusement venues.

Next Move Strategy Consulting's analysis indicates that the market offers an absolute opportunity of USD 552.64 Million between 2026 and 2035. This increase reflects new unit placements in entertainment venues and retail locations. Replacement demand from existing commercial operators adds further volume. Vendors that align product portfolios with high-throughput and compact formats can capture a meaningful share of this incremental value across regions.

Competitive activity in cotton candy machines centers on established commercial equipment suppliers. Gold Medal Products Co., Inc. offers small and medium machines for both commercial and retail buyers. Hamilton Beach Brands Holding, Inc., Nostalgia Products Group, and Waring Commercial, Inc. extend reach through broad distribution. Distribution through food service distributors and vending channel operators strengthens supply chain scale. Larger suppliers gain purchasing leverage on motors, heating components, and stainless-steel parts.

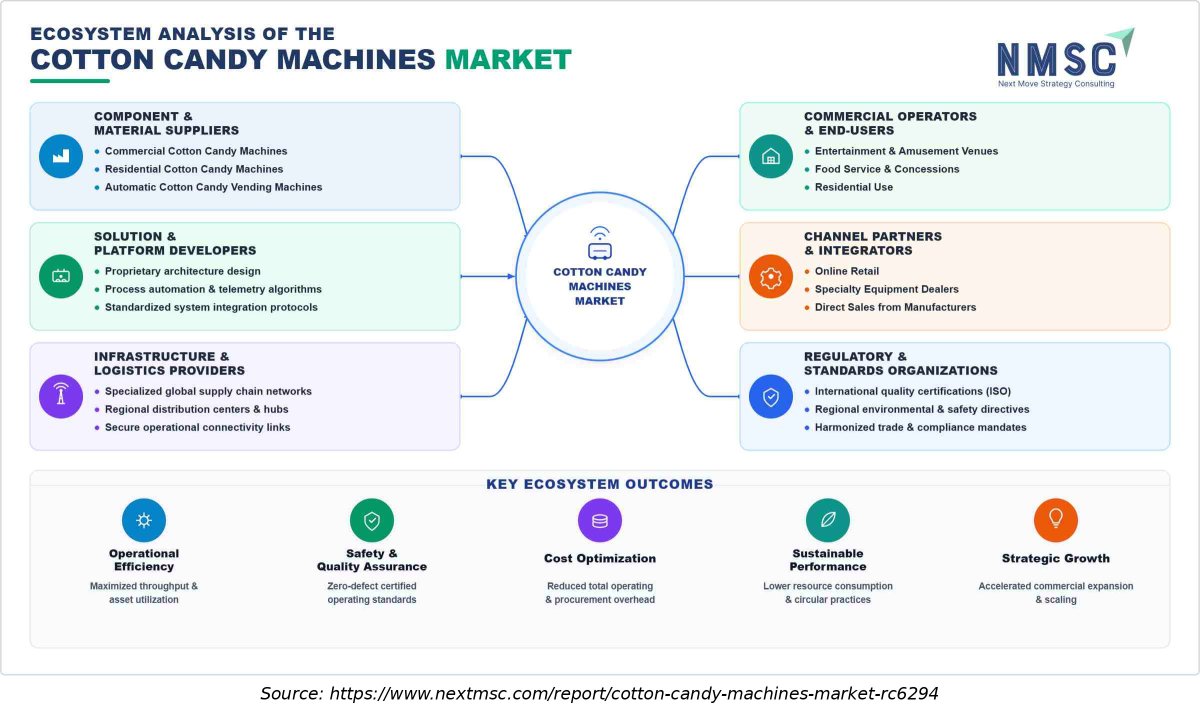
Ecosystem Analysis of the Cotton Candy Machines Market

The market ecosystem includes component and materials suppliers, cotton candy machine manufacturers and assemblers, importers and distributors, specialist equipment dealers and e-commerce sellers, maintenance and replacement-parts providers, and end users such as concession operators, amusement venues, food-service businesses, event organizers, retailers, and households. These participants support equipment production, distribution, installation, operation, cleaning, repair, and replacement.

What Does the Cotton Candy Machines Market Encompass?

The market covers equipment designed to heat and spin sugar into cotton candy for commercial, vending, event, and household use. Product types include commercial concession machines, residential countertop makers, and automated vending machines. Core equipment components include a heating assembly, spinning head, motor, controls, and collection bowl. The scope includes household machines where they are sold as cotton candy-making equipment; it excludes unrelated confectionery machinery and cotton candy consumables.
Equipment specifications commonly address heating performance, motor durability, bowl and cabinet materials, removable components, guarding, cleanability, electrical requirements, and output capacity. Product-specific electrical and sanitation listings may influence commercial procurement. Requirements differ by jurisdiction and equipment design, so no single standard applies universally.

Market Drivers & Dynamics

Interactive Dataset
Rising Commercial Entertainment Demand driver High Theme parks, cinemas, and fairs require consistent cotton candy machine output for high visitor volumes Immediate
Retail Impulse Purchase Expansion driver High Compact cotton candy machines in retail stores drive impulse sales and in-store traffic Immediate
Vending Channel Growth driver Medium Self-service cotton candy vending machines open recurring revenue opportunities for placement operators Medium-term
Equipment Cost Sensitivity restraint High Commercial cotton candy machine prices, such as Sweet Robo listings of approximately USD 15,000 for robotic units, restrain adoption among smaller independent operators due to higher capital expenditure requirements. Immediate
Food Safety Maintenance Requirements restraint Medium Regular cleaning and sanitation of cotton candy machine components adds labor and operating overhead Medium-term
Seasonal Demand Variability restraint Low Event-driven cotton candy machine purchases fluctuate with seasonal tourism and festival calendars Long-term
Source: Next Move Strategy Consulting

Growth Drivers

Growth Inhibitors

Segmentation Analysis

2025 (USD Billion)
2035 (USD Billion)
Commercial Cotton Candy Machines 2025: $423.70 Billion | 2035: $722.52 Billion
Commercial C
Residential Cotton Candy Machines 2025: $253.32 Billion | 2035: $436.63 Billion
Residential
Automatic Cotton Candy Vending Machines 2025: $149.79 Billion | 2035: $266.60 Billion
Automatic Co
Commercial Cotton Candy Machines $423.70 Billion $722.52 Billion 5.5%
Residential Cotton Candy Machines $253.32 Billion $436.63 Billion 5.6%
Automatic Cotton Candy Vending Machines $149.79 Billion $266.60 Billion 5.9%

Which Product Type Segment Dominates the Market?

Commercial Cotton Candy Machines hold the largest share at about 51%, or USD 423.70 Million in 2025. Concession stands, amusement parks, and food operators rely on these units for high daily output. Next Move Strategy Consulting's analysis indicates that operators value consistent throughput and durable build quality. Automatic Cotton Candy Vending Machines expand at the fastest 5.9% CAGR through 2035. Their unattended operation suits high-footfall retail locations and reduces labor needs.

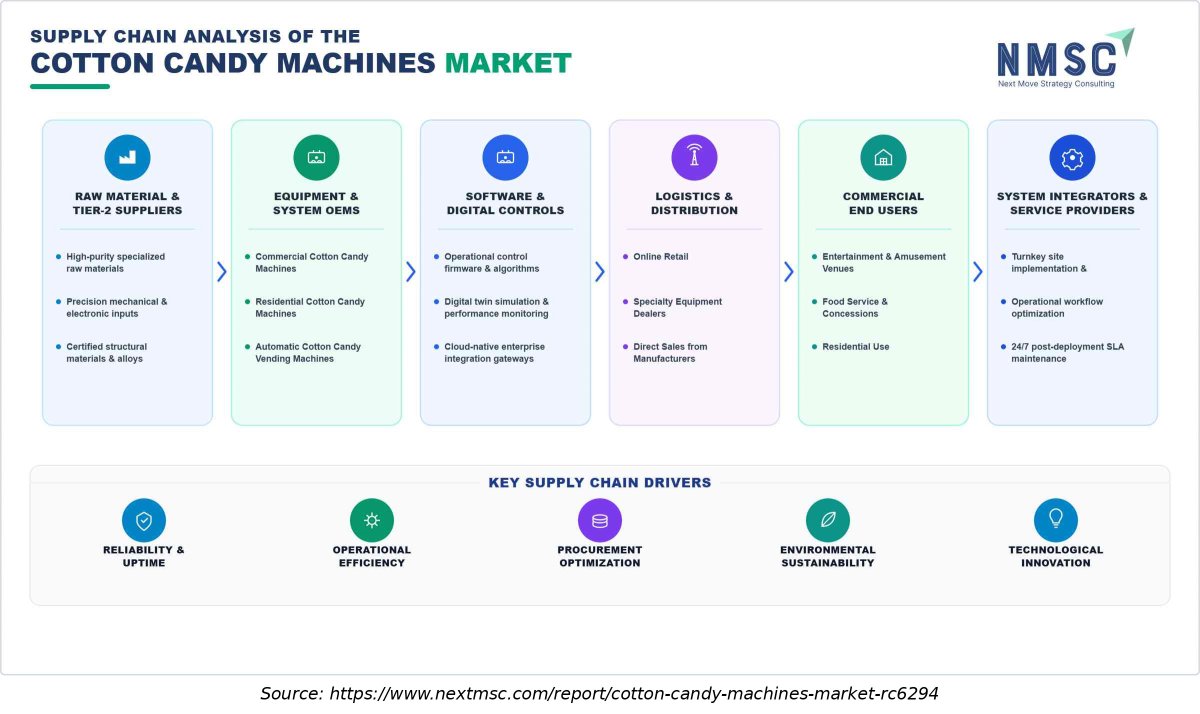
Supply Chain Analysis of the Cotton Candy Machines Market

Supply Chain Analysis of the Cotton Candy Machines Market
The supply chain begins with suppliers of heating elements, motors, electrical controls, stainless steel, molded components, and other parts. Manufacturers assemble and test machines before selling through direct channels, importers, distributors, specialist dealers, and online retailers. After-sales providers supply replacement parts, cleaning guidance, repairs, and maintenance. End users include concessionaires, amusement and event venues, food-service operators, retailers, vending operators, and households.

Growth Opportunities

Our analysis shows that three structural whitespace opportunities are positioned to generate meaningful commercial returns in the Cotton Candy Machines Market through 2035:

Can Compact Commercial Machines Serve Space-Constrained Locations?

Compact and cart-mounted machines can suit smaller concession counters, temporary events, and venues with limited service space. Suppliers can address this need through clear capacity options, transport features, accessible controls, and straightforward cleaning. The commercial opportunity depends on distributor sales and end-user placements.
Can After-Sales Service and Replacement Parts Create Additional Revenue?

Cotton candy machines contain replaceable motors, heating elements, spinning heads, belts, controls, and other service components. Manufacturers and dealers can support repeat customer relationships through replacement parts, repair services, maintenance guidance, and equipment refurbishment. The size of this opportunity depends on service networks, parts catalogues, and aftermarket sales.


Can Automated and Customized Formats Support Premium Placements?

Automated vending systems and customized concession configurations serve locations that prioritize customer presentation, self-service operation, or distinctive product formats. Suppliers can differentiate through machine reliability, payment options, service coverage, replenishment arrangements, and customization. Premium pricing and placement economics vary by model and venue.

Regional Outlook

2025 (USD Billion)
2035 (USD Billion)
North Americ
Europe
Asia-Pacific
Latin Americ
Middle East
Region 2025 (USD Billion) 2035 (USD Billion) CAGR (%)
North America $10.0 USD Billion $40.0 USD Billion 9.0%
Europe $17.1 USD Billion $51.1 USD Billion 27.0%
Asia-Pacific $24.2 USD Billion $62.2 USD Billion 25.0%
Latin America $31.3 USD Billion $73.3 USD Billion 23.0%
Middle East & Africa $38.4 USD Billion $84.4 USD Billion 12.0%

Regional data is locked

Unlock complete regional numbers for this market.

Unlock Full Data

Competitive Landscape

The market includes manufacturers, equipment dealers, and vending solution providers. Gold Medal Products Co., Inc., Nostalgia Products Group, Hamilton Beach Brands Holding, Inc., and Paragon International, Inc. represent established participants. Benchmark USA Inc., Prince Castle, Inc., Winco Inc., and Waring Commercial, Inc. serve commercial kitchens and food service buyers. Cuisinart and Kitchen Chef Products, Inc. address broader consumer and small operator demand. Our assessment indicates that competition centers on durability, service reach, and price positioning.

How Do Companies Compete in the Cotton Candy Machines Market?

Manufacturers and suppliers compete on machine output, heating and motor performance, construction quality, ease of cleaning, parts availability, warranty coverage, distribution reach, and price. Official product catalogues from Gold Medal Products, Paragon International, Nostalgia Products, Winco, and other suppliers document cotton candy equipment across commercial and household use cases. Competitors range from active product manufacturers to brands with legacy models and resellers.

Which Competitive Archetypes Dominate the Cotton Candy Machines Market?

Market participants fall into three main archetypes. Commercial equipment specialists focus on high-output machines for amusement and concession operators. Automated vending solution providers build unattended machines for retail locations. Broad appliance brands extend consumer kitchen lines into cotton candy equipment. Gold Medal Products concentrates on commercial and professional-grade models rather than home units. Each archetype serves distinct buyer needs and operating environments.

What Innovation and Differentiation Strategies Are Companies Pursuing?

Documented product differentiation includes stainless-steel construction, removable spinning heads, electronic heat controls, higher serving output, cart-mounted formats, and automated vending configurations. Each feature is specific to a named model and manufacturer. Advanced features such as induction heating controls and programmable motor speeds vary by manufacturer and model, offering enhanced thermal efficiency for commercial high-throughput environments.

Key Market Players

Based on research conducted by NMSC, the following 20 companies represent the validated leadership set across Cotton Candy Machines Market developers, manufacturers, and solution providers:

Gold Medal Products Co., Inc. Nostalgia Products Group Hamilton Beach Brands Holding, Inc. Paragon International, Inc. Benchmark USA Inc. Prince Castle, Inc. Winco Inc. Waring Commercial, Inc. Cuisinart (Conair Corporation) Kitchen Chef Products, Inc. Great Northern Popcorn Company Star Manufacturing International Limited Olde Midway Company Lello Appliances, Inc. Ardell Products, Inc. Sweet Creations (Gold Medal affiliates), Inc. Candy Floss Machines Ltd. Spectrum Brands Holdings Shenzhen Hanfeng Electric Appliance Co., Inc. Zhongshan Yuanfeng Electrical Appliance Co., Inc.

Latest Developments

During our market evaluation, we noticed that recent commercial activities within the industry reflect the latest market developments:

Date Event
January 2026 Gold Medal Products Co. relocated its Memphis branch to a larger facility at 1687 N. Shelby Oaks Drive, Memphis. The expanded showroom and warehouse provide greater capacity, inventory availability and customer engagement, strengthening its regional concession equipment distribution and service operations.
May 2025 Gold Medal Products Co. relocated its Memphis branch to an expanded facility at 1687 N. Shelby Oaks Drive, Memphis, enhancing showroom capacity, inventory availability, and regional concession equipment servicing across the southeastern U.S.

Investment Opportunities

Where Are Capital Investments Concentrating?

Potential investment areas include commercial machine manufacturing capacity, automated vending equipment, replacement-parts availability, distributor coverage, and service capabilities. Investment activity is tracked through company announcements, capacity additions, product launches, and financial disclosures.

How Is Manufacturing and Distribution Investment Shaping Market Capacity?

Manufacturers and distributors may invest in production capacity, inventory, branch locations, dealer coverage, and service infrastructure to improve product availability. Gold Medal Products’ Memphis branch expansion is a verified example of distribution infrastructure investment. It is a company-specific development rather than evidence of a market-wide capacity trend.

What ESG Considerations Are Relevant to Cotton Candy Machine Investment?

Relevant equipment-level considerations include electricity consumption, heating efficiency, product durability, repairability, packaging, and the availability of replacement parts. Longer equipment life and repairable components may reduce premature replacement and material use. Quantified environmental benefits depend on product-level energy, lifecycle, and materials data.

Key Benefits for Stakeholders

How Does This Report Benefit Industry Leaders and Enterprise Operators?

Operational executives gain empirical benchmarks for equipment planning. Procurement directors can compare segment shares across commercial, residential, and vending machines. Commercial operators use the forecast to time capacity additions. The report links market size from USD 826.81 Million in 2025 to USD 1,425.75 Million by 2035. These figures support budgeting and supplier selection decisions.

How Does This Report Benefit Investors and Financial Analysts?

Investors gain a clear view of market valuation over the forecast period. The market is projected to reach USD 1,425.75 Million by 2035 from USD 873.11 Million in 2026. The 5.6% CAGR offers a benchmark for comparing opportunities. Segment-level data highlights where margin potential may be strongest. Analysts can use these trends to refine portfolio decisions.

How Does This Report Benefit Equipment Manufacturers and Product Development Teams?

Product teams can prioritize roadmap investments using segment growth data. Automatic vending and induction heating represent the fastest-growing areas. Vendors can target Retail & Vending Operations, which posts a 6.4% CAGR. Competitive analysis highlights where differentiation through durability and design matters most. These insights help teams align features with buyer priorities.

Key Market Segments Evaluated

By Product Type

  • Commercial Cotton Candy Machines 
    • Small-Batch Carnival Units
    • High-Output Concession Units
  • Residential Cotton Candy Machines 
    • Compact Home Units
    • Multi-Flavor Home Units
  • Automatic Cotton Candy Vending Machines 
    • Coin/Card-Operated Units
    • Smart Connected Units

By Heating Technology

  • Standard Heating Element Machines 
    • Single-Head Units
    • Multi-Head Units
  • Induction Heating Machines 
    • Low-Power Units
    • High-Throughput Units

By Application

  • Entertainment & Amusement Venues 
    • Theme Parks
    • Fairs & Carnivals
  • Food Service & Concessions 
    • Cinemas
    • Stadiums & Event Venues
  • Residential Use
  • Retail & Vending Operations 
    • Standalone Kiosks
    • Mall-Based Vending

By Distribution Channel

  • Online Retail 
    • E-commerce Marketplaces
    • Brand Websites
  • Specialty Equipment Dealers 
    • Regional Distributors
    • Foodservice Equipment Suppliers
  • Direct Sales from Manufacturers

By Region

  • North America 
    • U.S.
    • Canada
    • Mexico.
  • Europe 
    • UK
    • Germany
    • France
    • Italy
    • Rest of Europe.
  • Asia-Pacific 
    • China
    • India
    • Japan
    • South Korea
    • Australia
    • Rest of APAC.
  • Latin America 
    • Brazil
    • Argentina
    • Rest of Latin America.
  • Middle East & Africa 
    • UAE
    • Saudi Arabia
    • South Africa
    • Rest of MEA.

Conclusion & Recommendations

What Is the Long-Term Outlook for the Cotton Candy Machines Market?

The long-term outlook for the Cotton Candy Machines Market is positive, with revenue expanding from USD 873.11 Million in 2026 to USD 1,425.75 Million by 2035 at a 5.6% CAGR. Growth is underpinned by commercial entertainment demand, retail impulse purchase expansion, and vending channel growth. Operators increasingly favor reliable, efficient equipment. Vendors that match these needs are well placed through 2035.

What Strategic Positioning Recommendations Does NMSC Offer?

Cotton Candy Machines vendors should prioritize automated vending formats, induction heating, and online distribution to capture high-growth market segments. Manufacturers should strengthen dealer coverage, replacement-parts availability, and service networks to retain commercial operators as installed bases age. After-sales service and replacement-parts offerings should be developed as standard packages to capture recurring demand among concession and venue operators.

How Attractive Is the Cotton Candy Machines Market for Investment?

Investment attractiveness is positive, supported by the USD 552.64 Million absolute growth opportunity between 2026 and 2035. Asia-Pacific at 8.4% CAGR represents the highest relative growth, while North America offers the largest absolute revenue base with an established commercial operator population and replacement-driven demand.

What Are the Key Market Shifts and Risks in the Cotton Candy Machines Market?

Key market shifts include the expansion of automated vending formats, the adoption of induction heating, and the growth of online distribution as a primary buying channel. Primary risks include equipment cost sensitivity among small operators, food safety and sanitation maintenance requirements, and seasonal demand variability.

What Are the Primary Growth Pathways Through 2035?

The most attractive pathway lies in automatic vending for retail locations. Retail & Vending Operations post the fastest 6.4% CAGR through 2035. Induction heating presents a second pathway with a 5.8% CAGR. Online distribution offers a third route with a 6.9% CAGR. Participants that align with these pathways can capture a meaningful share of the USD 552.64 Million opportunity.

Delivered Customizations

We have successfully delivered the following deep-dive customizations:

Client Request Customization Delivered Value Adds
Global Trade Flow Assessment
  • Country-wise import and export analysis for cotton candy machines using relevant HS codes from UN Comtrade and WITS.
  • Identifies key exporting and importing countries, supporting sourcing decisions and market entry prioritization.
Historical Equipment Sales Analysis
  • Historical sales, shipment, and revenue analysis of cotton candy machines by product type.
  • Reveals which machine categories are gaining or losing share, guiding product portfolio and capacity planning.
Company-Level Product Type Share Assessment
  • Company-level share analysis by machine product type, such as countertop, floor-standing, and portable models.
  • Shows where leading manufacturers are concentrated, highlighting white-space opportunities and competitive positioning.
Product Type Performance Benchmarking
  • Benchmarking of output capacity, heating power, bowl configuration, and portability across machine product types.
  • Supports product design, feature prioritization, and price-to-performance positioning against competing models.
Installed Base and Replacement Demand Analysis
  • Estimated installed base and replacement cycle analysis by product type across theme parks, cinemas, fairs, and retail concessions.
  • Pinpoints replacement-driven demand pools and helps target venue segments most likely to upgrade equipment.
Regional Certification and Compliance Mapping
  • Country-level mapping of electrical safety, food-contact, and equipment certification requirements by machine product type.
  • Reduces market entry delays and compliance costs by clarifying certification pathways for each target region.

FAQs

About the Author

Liza Phukan

Liza Phukan

Liza Phukan is Research Associate at Next Move Strategy Consulting, where she has covered emerging industries and market research across sectors for 3.5 years. Her work includes analyzing industry developments, validating market data, and developing structured business content from research findings. She uses secondary research and data-validation practices to turn complex market information into clear decision-useful market analysis for business audiences and support report development and B2B.

About the Reviewer

Supradip Baul

Supradip Baul

Supradip Baul is an accomplished business consultant and strategist with over a decade of rich experience in market intelligence, strategy, technology, and business transformation. His work has included rigorous qualitative and quantitative analysis across multiple industries, helping clients shape investment decisions and long-term roadmaps. Earlier in his career, he was associated with Gartner, where he contributed to industry-leading reports and market share analyses. He has worked with leading global companies and holds an MBA with a dual specialization in Marketing and Finance.

Download Free Sample

Kevin Coker

KEVIN COKER

Founder, CEO and Board Diector

Proxima Clinical Research

I have been using Next MSC reports for product positioning in a new geography for a long time. They have by far the best reports I have found and the price is reasonable too!

Ross J Mckenzie

ROSS J MCKENZIE

Business Insight Manager

Staysure Group

“Next MSC have been incredibly helpful in providing detailed & robust information on our market, alongside quantifying growth by different segments. The process to procure was simple and easy, with sample reports and regular contact to ensure we had what we needed. Succinct detail on their sources & methodologies is also greatly received, allowing transparency in this respect helps build trust in the detail you pay for. Joseph in particular was fantastic, and helped ensure efficient provision of the insight pack – thank you NMSC!”.

Diana Trejo

DIANA TREJO

Assistant Manager

Sumitomo Corporation de Mexico, S.A. de C.V.

Recently, we purchased a report on the Mexico Data Center Market from Next Move Strategy Consulting. The service has been excellent, with support that is always timely and thoroughly professional. The information provided is interesting, highly useful, and delivered with clarity. I would highly recommend NextMSC for anyone seeking insightful and dependable analysis.

Melanie Samko

MELANIE SAMKO

Director of Marketing

TOSOH BIOSCIENCE, INC.

The information provided by NMSC is incredibly valuable, thank you so much for such a excellent work. I really appreciate it. I will make sure to reference all of it, in my summary document.

Nishant Awate

NISHANT AWATE

Business Development Global Sales

Zehnder Group Deutschland GmbH

Our experience working with Next Move Strategy Consulting was positive. The team was responsive, professional, and open to incorporating our specific requirements throughout the project. The India AHU market study was comprehensive and well structured, covering market value and volume forecasts, product and application segments, and key industry trends. The inclusion of both AHU and residential MVHR market insights made the study particularly relevant for our strategic market assessment. Overall, the report provides a solid foundation for evaluating market potential, identifying priority segments, and supporting business-development decisions in India.

Custom Market Research Services

We will customize the research for you if the listed report does not fully match your requirements.

Get 30% Free Customization

Select License

This website uses cookies to ensure you get the best experience on our website. Learn more

✖