Data Center Automatic Transfer Switches and Switchgears Market Global Industry Analysis and Forecast (2026–2035)

Rising AI workloads, hyperscale campus commitments and tighter uptime standards lift global revenue from USD 4.20 Billion in 2025 to USD 14.60 Billion by 2035, a 12.4% CAGR across 2026–2035, with North America leading demand.

Download Free Sample PDF
Base Year (2025)
$4.20 Billion
Forecast (2035)
$14.60 Billion
CAGR (2026-2035)
12.4%
Top Region
North America

What Is the Data Center Automatic Transfer Switches and Switchgears Market Size?

The global Data Center ATS and Switchgears Market was valued at USD 4.20 Billion in 2025, is estimated at USD 5.10 Billion in 2026, and is forecast to reach USD 14.60 Billion by 2035, growing at a 12.4% CAGR from 2026–2035. North America holds roughly 38% share, while low voltage switchgear accounts for about 41% of product revenue.

Our assessment indicates that the segment snapshot below captures where revenue concentrates and where growth is accelerating fastest across product, facility and installation choices.

Data Center Automatic Transfer Switches and Switchgears Market Global Industry Analysis and Forecast (2026–2035) Revenue Forecast

Values in USD Billion

2025 $4.20 Billion
2025
2026 $5.10 Billion
2026
2027 $5.73 Billion
2027
2028 $6.44 Billion
2028
2029 $7.24 Billion
2029
2030 $8.14 Billion
2030
2031 $9.15 Billion
2031
2032 $10.28 Billion
2032
2033 $11.56 Billion
2033
2034 $12.99 Billion
2034
2035 $14.60 Billion
2035

Key Takeaways

By Product: Low voltage switchgear held the largest share, expanding from USD 1.75 Billion in 2025 to USD 5.35 Billion by 2035; medium voltage switchgear is the fastest growing at 14.4% CAGR from 2026–2035.

By Data Center Type: Hyperscale held the largest share, expanding from USD 1.55 Billion in 2025 to USD 6.30 Billion by 2035; edge is the fastest growing at 16.7% CAGR from 2026–2035.

By Installation Model: Conventional site-built systems held the largest share, expanding from USD 3.00 Billion in 2025 to USD 8.80 Billion by 2035; prefabricated and modular power systems are the fastest growing at 15.8% CAGR from 2026–2035.

Dominant Region: North America, expanding from USD 1.60 Billion in 2025 to USD 4.95 Billion by 2035.

Fastest-Growing Region: Asia-Pacific at 13.7% CAGR from 2026–2035, rising from USD 1.30 Billion in 2025 to USD 5.10 Billion by 2035.

Dominant Country: U.S., expanding from USD 1.40 Billion in 2025 to USD 4.20 Billion by 2035.

Fastest-Growing Country: India at 17.2% CAGR from 2026–2035, rising from USD 0.14 Billion in 2025 to USD 0.75 Billion by 2035.

Investors face an absolute revenue opportunity of USD 9.50 Billion between 2026 and 2035, which positions power transfer and distribution equipment as one of the most capital efficient ways to gain exposure to the AI infrastructure buildout. Suppliers with qualified hyperscale relationships and spare factory capacity are best placed to capture the largest share of that incremental revenue.

According to NMSC analysis, prefabricated and modular power systems will lift their share of spending from about 30% in 2026 to about 40% by 2035, because operators increasingly buy factory tested lineups that cut on site commissioning time. This shift also favours vendors able to combine switchgear, transfer switching and integration services under one delivery contract.

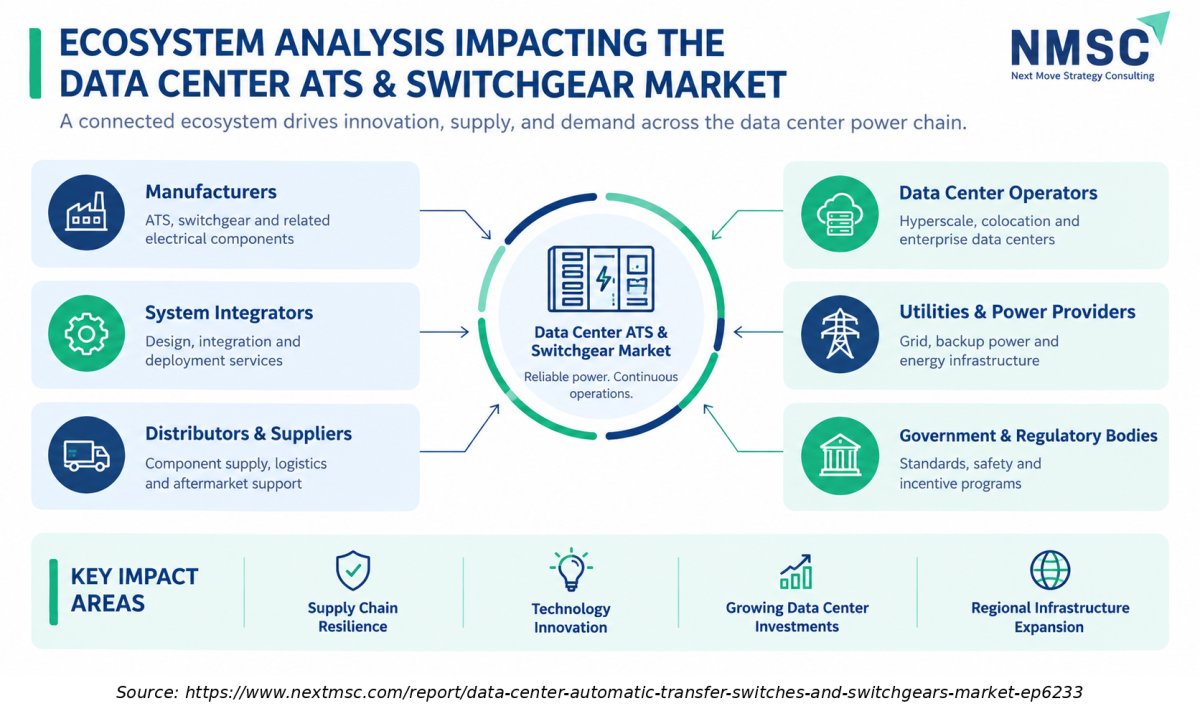
Ecosystem Analysis Impacting the Data Center ATS & Switchgear Market

The ecosystem analysis illustrates how manufacturers, system integrators, distributors, data center operators, utilities, and regulatory bodies contribute to the Data Center ATS and Switchgear Market. Their collaboration supports equipment supply, system integration, reliable power delivery, regulatory compliance, and technological innovation, helping address the evolving power infrastructure needs of data centers.

What Does the Data Center Automatic Transfer Switches and Switchgears Market Encompass?

The market covers automatic transfer switches, low voltage switchgear and medium voltage switchgear installed inside data centers to select, protect and isolate utility, generator and battery power paths. Automatic transfer switches move critical load between sources without operator action, while switchgear distributes, protects and isolates that power across the facility. The scope excludes uninterruptible power supplies, generators and cooling plant.
Our findings suggest that the structure of demand has shifted from standalone equipment toward integrated, prefabricated power blocks delivered to hyperscale, colocation, enterprise and edge sites. Standards such as NFPA 110 for emergency and standby power, UL 1008 for transfer switch equipment and the IEC 60947 and IEC 62271 series for switching devices and high voltage switchgear define performance and testing, while operators increasingly specify digital monitoring and remote diagnostics.

Segmentation Analysis

2025 (USD Billion)
2035 (USD Billion)
Automatic transfer switches 2025: $0.95 Billion | 2035: $3.05 Billion
Automatic tr
Low voltage switchgear 2025: $1.75 Billion | 2035: $5.35 Billion
Low voltage
Medium voltage switchgear 2025: $1.50 Billion | 2035: $6.20 Billion
Medium volta
Automatic transfer switches $0.95 Billion $3.05 Billion 11.4%
Low voltage switchgear $1.75 Billion $5.35 Billion 10.9%
Medium voltage switchgear $1.50 Billion $6.20 Billion 14.4%

Which Product Segment Leads the Data Center ATS and Switchgears Market ?

Low voltage switchgear leads because every row, hall and rack feed need breakers and distribution boards, which keeps volumes high even when unit values are modest. Medium voltage switchgear grows fastest at 14.4% from 2026 to 2035, as campuses above 100 megawatts shift distribution to higher voltage and Eaton, Schneider Electric and ABB add factory capacity. Automatic transfer switches follow at 11.4%, supported by NFPA 110 compliant standby designs.

2025 (USD Billion)
2035 (USD Billion)
Category A
Category B
Category C
Category D
Segment Item 2025 (USD Billion) 2035 (USD Billion) CAGR
Category A $10.0 USD Billion $40.0 USD Billion 24.0%
Category B $17.1 USD Billion $51.1 USD Billion 18.0%
Category C $24.2 USD Billion $62.2 USD Billion 8.0%
Category D $31.3 USD Billion $73.3 USD Billion 10.0%

Segment-wise data is locked

Unlock complete segment-wise numbers for By Data Center Type.

Unlock Full Data
2025 (USD Billion)
2035 (USD Billion)
Category A
Category B
Category C
Category D
Segment Item 2025 (USD Billion) 2035 (USD Billion) CAGR
Category A $10.0 USD Billion $40.0 USD Billion 15.0%
Category B $17.1 USD Billion $51.1 USD Billion 13.0%
Category C $24.2 USD Billion $62.2 USD Billion 23.0%
Category D $31.3 USD Billion $73.3 USD Billion 17.0%

Segment-wise data is locked

Unlock complete segment-wise numbers for By Installation Model.

Unlock Full Data

Growth Opportunities

We found that three whitespace areas offer operators and suppliers the clearest route to above market revenue through 2035.

Can Prefabricated Medium Voltage Lineups Shorten Time to Power for Hyperscale’s?

Hyperscale data center operators prioritise time to energisation, making integrated medium-voltage lineups an option for simplifying installation and commissioning. NMSC estimates that the prefabricated and modular power-systems segment could grow from USD 1.55 billion in 2026 to USD 5.80 billion by 2035, implying approximately 15.8% CAGR. These estimates should be validated, and only revenue attributable to in-scope ATS and switchgear should be counted in the target market. segment, which grows from USD 1.55 Billion in 2026 to USD 5.80 Billion by 2035. Buyers gain schedule certainty, and suppliers gain larger scope per project.

Does Retrofit of Ageing Enterprise Sites Create a Replacement Wave?

Some enterprise data centers may still operate switchgear and transfer switches installed more than 15 years ago, potentially creating opportunities for upgrades to modern protection and monitoring systems. The scale of this replacement opportunity should be supported by asset-age or refurbishment data. Upgrading these assets to digital, remotely monitored units is cheaper than new construction and avoids grid interconnection delays. Service oriented suppliers and regional installers benefit most, particularly in Europe and North America where enterprise sites remain numerous.

Will Edge Facilities in India and Southeast Asia Open Volume Demand for Compact Transfer Switches?

Growth in distributed inference, cloud services and data-localisation requirements may support demand for smaller data center facilities in India and Southeast Asia. Such facilities can require compact automatic transfer switches and low-voltage distribution equipment, although the scale of this demand should be validated using country-level capacity and deployment data. Edge revenue rises from USD 0.40 Billion in 2026 to USD 1.60 Billion by 2035. Local assemblers with certified product ranges and quick delivery are best placed to serve this fragmented, volume driven demand.

Regional Outlook

2025 (USD Billion)
2035 (USD Billion)
North Americ
Europe
Asia-Pacific
Middle East
Latin Americ
Region 2025 (USD Billion) 2035 (USD Billion) CAGR (%)
North America $10.0 USD Billion $40.0 USD Billion 9.0%
Europe $17.1 USD Billion $51.1 USD Billion 27.0%
Asia-Pacific $24.2 USD Billion $62.2 USD Billion 25.0%
Middle East & Africa $31.3 USD Billion $73.3 USD Billion 23.0%
Latin America $38.4 USD Billion $84.4 USD Billion 12.0%

Regional data is locked

Unlock complete regional numbers for this market.

Unlock Full Data

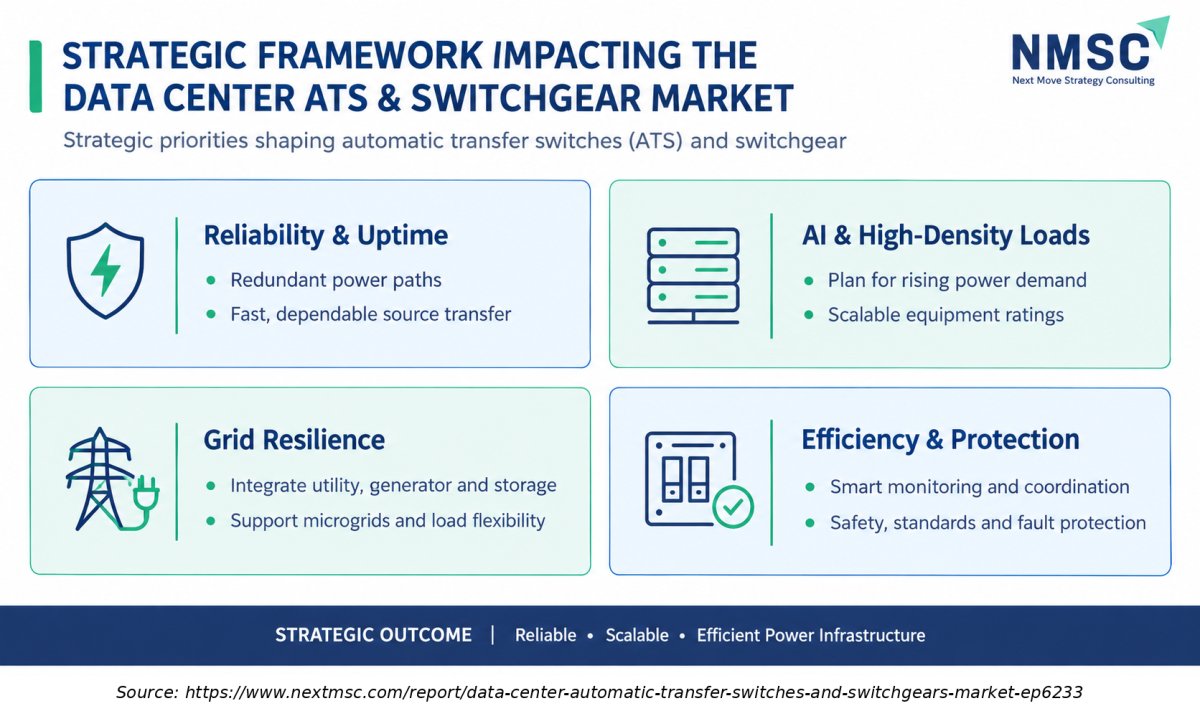
Strategic Framework Impacting the Data Center ATS & Switchgear Market

Strategic Framework Impacting the Data Center ATS & Switchgear Market
The strategic framework highlights the key priorities shaping the Data Center ATS and Switchgear Market, including power reliability, rising demand from AI and high-density computing, grid resilience, and equipment safety. Redundant power paths, scalable equipment ratings, smart monitoring, and effective fault protection are essential considerations for supporting continuous data center operations and efficient power infrastructure.

Competitive Landscape

Based on research conducted by NMSC, we found that the competitive industry is concentrated among global electrical groups that combine switchgear manufacturing, digital controls and large service networks.

How Do Companies Compete in the Data Center ATS and Switchgears Market ?

Suppliers compete on delivery speed, qualification with hyperscale buyers, breadth of portfolio and service coverage. Factory capacity has become the sharpest differentiator, since customers reward vendors that can ship medium voltage lineups within predictable windows. Pricing power is stronger for integrated scope, while commodity low voltage boards face regional competition and more frequent tender based pricing.

Which Company Archetypes Dominate the Industry?

Three archetypes dominate. Diversified electrification groups such as Schneider Electric, ABB, Siemens and Eaton offer full grid to chip portfolios. Data center specialists such as Vertiv bundle power with thermal and services. Component focused groups such as Legrand supply busways, distribution and monitoring. Their differentiation themes are portfolio breadth, hyperscale relationships, digital services and local manufacturing proximity.

What Innovation and Differentiation Strategies Are Shaping Competition?

Vendors are differentiating through software defined protection, embedded monitoring and standardised reference designs. Schneider Electric offers ASCO and Transfer Pact transfer switch ranges with transfer times as fast as 500 milliseconds, and ABB's direct current portfolio targets future high-density halls. Geographic expansion follows customer clusters, and pricing increasingly rewards bundled engineering and lifecycle service contracts.

How Active Is M&A in the Data Center ATS and Switchgears Market?

Recent acquisitions and announced transactions indicate continued consolidation among electrical equipment suppliers. However, the developments cited in this report do not, by themselves, establish that industry-wide consolidation is accelerating. Legrand reported seven acquisitions since the start of 2026, all focused on energy and digital transition markets, and ABB agreed to pay about USD 0.50 Billion for a 51% stake in a venture built from Mitsubishi Electric's low voltage power distribution unit. Further deals are likely as vendors secure scarce factory space.

Key Market Players

During our market evaluation, we noticed that six verified companies lead supply of transfer switches, switchgear and integrated power systems to data centers, ranked here on qualitative scale and evidence of data center exposure.

Schneider Electric SE Eaton Corporation plc ABB Ltd. Siemens AG Vertiv Holdings Co Legrand SA

Expert Insights

Peter Koerte

Peter Koerte

CEO | Siemens Smart Infrastructure

"“None of this is possible without the next generation of switchgear: the technological core of the super brain of tomorrow’s industry.”"

Analyst Interpretation

Peter Koerte highlighted the importance of next-generation switchgear in meeting the growing power demands of AI data centers. Siemens also announced a €300 million investment to strengthen its electrical infrastructure manufacturing capacity in Germany

Investment Opportunities

Where Is Capital Flowing in the Data Center ATS and Switchgears Market ?

Capital is flowing into factory capacity, acquisitions and integrated power products. Eaton plans a USD 0.03 Billion medium voltage plant, Schneider Electric Infrastructure raised its Vadodara expansion budget, and Legrand continues acquiring in energy and digital transition niches. Investors seeking exposure can compare listed suppliers by data center revenue share and backlog coverage rather than by headline sales alone.

Which Infrastructure Investments Support Long Term Equipment Demand?

Grid interconnection upgrades, on site generation and battery storage determine how quickly campuses can energise, and each requires switching and protection equipment. Developments in backup power systems and storage linked microgrids expand transfer switch content per site. Utilities and developers that co finance substations create steady pull for medium voltage switchgear.

How Do ESG Considerations Influence Investment Decisions?

Sustainability reporting rules are shaping specifications, especially in Europe. Operators increasingly request SF6 free switchgear, energy efficient transformers and monitoring that supports emissions disclosure. Suppliers with documented low carbon product lines can win preferred status, while investors screen for factory energy use and responsible sourcing of copper and steel in the market.

Key Benefits for Stakeholders

What Value Does This Report Offer Enterprise and Industry Leaders?

Facility owners and operators gain a segmented view of equipment spending by product, facility type and installation model, which supports procurement planning and vendor negotiation. The regional and country analysis shows where lead times and local supply are most constrained, helping teams sequence projects and reserve factory slots before backlogs grow longer in the market.

How Does This Report Support Investors and Financial Analysts?

Investors receive reconciled 2025, 2026 and 2035 values, segment level growth rates and an assessment of supplier positioning. The matrix of drivers and restraints quantifies expected impact on growth, helping analysts stress test forecasts. Verified company developments give a factual basis for comparing capacity plans, acquisition strategies and exposure to data center demand.

What Does This Report Offer Technology Vendors and Product Teams?

Product teams can identify which voltage classes, transition modes and installation models are growing fastest, and where digital monitoring creates differentiation. The direct current architecture discussion highlights a design cycle that begins after 2030, while edge and prefabricated segment data guide portfolio decisions. Regional insights help vendors prioritise certification and local assembly investments.

Key Market Segments Evaluated

By Product

  • Automatic transfer switches
  • Low voltage switchgear
  • Medium voltage switchgear

By Data Center Type

  • Hyperscale
  • Colocation
  • Enterprise
  • Edge

By Installation Model

  • Prefabricated and modular power systems
  • Conventional site-built systems

By Region

  • North America 
    • U.S.
    • Canada
    • Mexico
  • Europe 
    • UK
    • Germany
    • France
    • Italy
    • Spain
    • Sweden
    • Denmark
    • Finland
    • Netherlands
    • Rest of Europe
  • Asia-Pacific 
    • China
    • India
    • Japan
    • South Korea
    • Taiwan
    • Indonesia
    • Vietnam
    • Australia
    • Philippines
    • Malaysia
    • Rest of APAC
  • Middle East & Africa 
    • Saudi Arabia
    • UAE
    • Egypt
    • Israel
    • Turkey
    • Nigeria
    • South Africa
    • Rest of MEA
  • Latin America 
    • Brazil
    • Argentina
    • Chile
    • Colombia
    • Rest of LATAM

Conclusion & Recommendations

The outlook is strongly positive. Revenue is projected to rise from USD 5.10 Billion in 2026 to USD 14.60 Billion by 2035, supported by IEA projections of doubling data centre electricity use by 2030. Our assessment indicates that growth will moderate from the 2026 surge as capacity catches up, yet remain well above general electrical equipment growth for the rest of the decade.

What Strategic Positioning Recommendations Does NMSC Offer?

We recommend that suppliers secure factory capacity early, standardise prefabricated reference designs and invest in monitoring software that raises switchgear from a commodity to a managed asset. Buyers should qualify two or more vendors, reserve production slots well ahead of site readiness and specify digital interfaces that keep options open for direct current architectures.

What Is the Investment Attractiveness of the Data Center ATS and Switchgears Market?

NMSC assesses the market's investment attractiveness based on projected demand growth, supplier order trends and manufacturing-capacity investment. These indicators should be considered alongside the unverified market-size estimates, exposure to hyperscale capital expenditure and the execution risks associated with capacity expansion. Medium voltage switchgear and prefabricated power systems offer the strongest growth at 14.4% and 15.8%. Investors should weigh these returns against cyclical exposure to hyperscale capital spending and the execution risk of rapid capacity expansion.

What Are the Market Shifts and Key Risks in the Data Center ATS and Switchgears Market?

The main shifts are the move to prefabricated delivery, software defined protection and early direct current designs. Principal risks include a slowdown in AI capital spending, grid interconnection delays and volatile copper and steel prices. Concerns about volatility in the AI sector already weighed on supplier share prices in October 2026, which signals sensitivity to sentiment.

What Are the Primary Growth Pathways Through 2035?

Growth will come from three pathways: hyperscale campus expansion in North America and Asia-Pacific, edge and colocation roll out in emerging markets, and retrofit of ageing enterprise power systems. Our findings suggest that suppliers combining local assembly with global engineering can capture all three pathways while limiting tariff and logistics exposure.

FAQs

Sources & References

1.

International Energy Agency, Energy and AI

iea.org
2.

Vertiv Holdings Co, Form 8-K, fourth quarter and full year 2025 results (U.S. SEC)

sec.gov
3.

Legrand, 2026 first half results

legrand.com/en/node/6943
4.

Eaton, medium voltage switchgear investment announcement, 8 April 2026

businesswire.com
5.

Schneider Electric, transfer switch solutions press release

se.com
6.

ABB Ltd., third quarter 2026 results and investor information

global.abb
7.

Siemens AG, fiscal 2026 third quarter results

siemens.com
8.

National Fire Protection Association, NFPA 110

nfpa.org
9.

International Electrotechnical Commission, IEC 60947 and IEC 62271 series

iec.ch
10.

UL Solutions, UL 1008 transfer switch equipment

ul.com
11.

European Commission, Energy Efficiency Directive

energy.ec.europa.eu

Market Drivers & Dynamics

Interactive Dataset
AI workload driven capacity additions driver +3.4% Global, led by North America 2026–2032
Hyperscale campus commitments driver +2.6% North America, Asia-Pacific 2026–2031
Uptime and standby power standards driver +1.4% Global 2026–2035
Edge and colocation expansion driver +1.2% Asia-Pacific, Europe 2027–2035
Prefabricated power system adoption driver +1.0% North America, Europe 2026–2033
Factory capacity and lead time limits restraint −1.6% North America, Europe 2026–2028
Copper and electrical steel cost volatility restraint −1.0% Global 2026–2029
Shift toward direct current distribution restraint −0.8% Global 2030–2035
Source: Next Move Strategy Consulting

Growth Drivers

What Is the Primary Growth Driver in the Data Center Automatic Transfer Switches and Switchgears Market?

AI driven electricity demand is the primary driver. The International Energy Agency projects that global data-center electricity consumption will reach approximately 945 TWh by 2030, more than doubling from 2024, while electricity consumption by AI-optimised data centers is projected to more than quadruple over the same period. Every added megawatt of critical load needs source selection and protection, so the Data Center ATS and Switchgears Market scales with AI optimized datacenterinfrastructure investment.

How Is Hyperscale Capital Spending Driving the Market Growth?

Hyperscale operators are placing multiyear orders for power equipment, and vendors confirm the effect. Vertiv reported fourth quarter 2025 organic orders up about 252% and a backlog of USD 15.0 Billion, while Siemens reported triple digit growth in data center orders over the first nine months of fiscal 2026. These order and backlog figures indicate strong demand across the companies' broader portfolios, but they do not independently establish revenue visibility for the specific data center ATS and switchgear market through 2028.

Growth Inhibitors

What Is Restraining the Data Center ATS and Switchgears Market ?

Delivery capacity is the main restraint. Vertiv reported a fourth-quarter 2025 book-to-bill ratio of approximately 2.9x, while ABB's chief financial officer cited a company-wide order backlog of USD 32 billion in October 2026. These figures indicate demand across the suppliers' broader portfolios but do not isolate data center ATS and switchgear orders. Long lead times for medium-voltage equipment can delay some projects, although their effect on overall market shipments requires product-specific evidence. projects, which tempers shipments in the market until new plants start production.

What Are the Growth Opportunities?

Can Prefabricated Medium Voltage Lineups Shorten Time to Power for Hyperscale’s?

Hyperscale data center operators prioritise time to energisation, making integrated medium-voltage lineups an option for simplifying installation and commissioning. NMSC estimates that the prefabricated and modular power-systems segment could grow from USD 1.55 billion in 2026 to USD 5.80 billion by 2035, implying approximately 15.8% CAGR. These estimates should be validated, and only revenue attributable to in-scope ATS and switchgear should be counted in the target market. segment, which grows from USD 1.55 Billion in 2026 to USD 5.80 Billion by 2035. Buyers gain schedule certainty, and suppliers gain larger scope per project.

Does Retrofit of Ageing Enterprise Sites Create a Replacement Wave?

Some enterprise data centers may still operate switchgear and transfer switches installed more than 15 years ago, potentially creating opportunities for upgrades to modern protection and monitoring systems. The scale of this replacement opportunity should be supported by asset-age or refurbishment data. Upgrading these assets to digital, remotely monitored units is cheaper than new construction and avoids grid interconnection delays. Service oriented suppliers and regional installers benefit most, particularly in Europe and North America where enterprise sites remain numerous.

Will Edge Facilities in India and Southeast Asia Open Volume Demand for Compact Transfer Switches?

Growth in distributed inference, cloud services and data-localisation requirements may support demand for smaller data center facilities in India and Southeast Asia. Such facilities can require compact automatic transfer switches and low-voltage distribution equipment, although the scale of this demand should be validated using country-level capacity and deployment data. Edge revenue rises from USD 0.40 Billion in 2026 to USD 1.60 Billion by 2035. Local assemblers with certified product ranges and quick delivery are best placed to serve this fragmented, volume driven demand.

About the Author

Mayurima Roy

Mayurima Roy

Mayurima Roy is Research Analyst at Next Move Strategy Consulting, where she has spent 4 years working across the firm's full industry coverage rather than a single fixed vertical. Her work centers on structured research, ongoing trend tracking, competitive assessment, and insight-led content development, translating complex market data into clear, decision-ready narratives that support informed client decision-making across diverse global industries, market sectors, and world regions every day.

About the Reviewer

Supradip Baul

Supradip Baul

Supradip Baul is an accomplished business consultant and strategist with over a decade of rich experience in market intelligence, strategy, technology, and business transformation. His work has included rigorous qualitative and quantitative analysis across multiple industries, helping clients shape investment decisions and long-term roadmaps. Earlier in his career, he was associated with Gartner, where he contributed to industry-leading reports and market share analyses. He has worked with leading global companies and holds an MBA with a dual specialization in Marketing and Finance.

Download Free Sample

Kishu Kanda

KISHU KANDA

Strategy Analyst

Accenture

We purchased the AI Consumer Market Report from this company. Not only did they customize the report to meet our specific requirements, but they also showed great flexibility in accommodating our budget. The report we received fully met our expectations. Additionally, they provided prompt and thorough responses to both our pre-purchase and follow-up questions. We look forward to working with this company again in the future.

Gustaf Hummel Burstrom

GUSTAF HUMMEL BURSTROM

Founder

Revline Tools AB

Joseph and the team at Next Move Strategy Consulting have been excellent to work with, in supplying us with relevant market data and forecasts for our specific category. We had some special requirements and they were able to do a custom package to suit our needs. We would definitely recommend them to any other company needing market data and forecasts

Robert Sean Trevino

ROBERT SEAN TREVINO

Sr. Director, Head of Strategic Insights & Analytics

Foundation Medicine

I realized that it was a reliable source of information. These days, there are many people who are looking for authentic data, and this is one of the only sources that can offer them with what they need;

Ross J Mckenzie

ROSS J MCKENZIE

Business Insight Manager

Staysure Group

“Next MSC have been incredibly helpful in providing detailed & robust information on our market, alongside quantifying growth by different segments. The process to procure was simple and easy, with sample reports and regular contact to ensure we had what we needed. Succinct detail on their sources & methodologies is also greatly received, allowing transparency in this respect helps build trust in the detail you pay for. Joseph in particular was fantastic, and helped ensure efficient provision of the insight pack – thank you NMSC!”.

Henri Knyphausen

HENRI KNYPHAUSEN

Partner at Singulier [Ex-BCG]

Singulier

I recently engaged NEXTMSC.com for a commercial due diligence project within the intralogistics sector, and I am pleased to provide a reference based on my experience. In utilizing NEXTMSC.com's services, I found their report to offer valuable insights into market dynamics and key industry players. The initial report provided a solid foundation for our analysis. However, as we were investigating a smaller target in the market, and I had specific customization requests requiring additional research. These requests included detailed information on product portfolios of various players and sub-market sizes, both inclusive and exclusive of certain product categories. NEXTMSC.com demonstrated commendable responsiveness and agility in accommodating these customization requests. Within a timeframe of 1-2 weeks, they delivered a revised report that met our specific needs. Furthermore, they were receptive to my follow-up inquiries, ensuring clarity and understanding of the data provided. The final deliverable significantly contributed to our due diligence efforts. One of NEXTMSC.com's notable strengths lies in their qualitative research capabilities. However, for future engagements, I would recommend the inclusion of a quantified market model in Excel format. Such a model would offer the ability to conduct in-depth analyses and explore various market segments, including country-specific data and subcomponent breakdowns. Based on my positive experience, I would not hesitate to work with NEXTMSC.com again. Their responsiveness, willingness to accommodate customization requests, and commitment to delivering actionable insights make them a reliable partner for commercial research projects.

Custom Market Research Services

We will customize the research for you if the listed report does not fully match your requirements.

Get 30% Free Customization

Select License

This website uses cookies to ensure you get the best experience on our website. Learn more

✖