Data Usability System Market Global Industry Analysis and Forecast (2026–2035)

Rising enterprise demand for trusted, AI ready data lifts global revenue from USD 9.80 Billion in 2025 to USD 31.60 Billion by 2035, a 12.3% CAGR over 2026–2035, with North America leading adoption.

Download Free Sample PDF
Base Year (2025)
$9.80 Billion
Forecast (2035)
$31.60 Billion
CAGR (2026-2035)
12.3%
Top Region
North America

What Is the Data Usability System Market Size?

The global Data Usability System Market was valued at USD 9.80 Billion in 2025 and is estimated at USD 11.10 Billion in 2026. It is forecast to reach USD 31.60 Billion by 2035, expanding at a 12.3% CAGR from 2026–2035. North America leads with roughly 41% share, and software platforms hold about 76%.

We observed that buyers now treat data usability as a precondition for deploying AI agents, which shifts spending from point tools toward unified platforms. The table below summarises the leading segments.

Data Usability System Market Global Industry Analysis and Forecast (2026–2035) Revenue Forecast

Values in USD Billion

2025 $9.80 Billion
2025
2026 $11.10 Billion
2026
2027 $12.47 Billion
2027
2028 $14.00 Billion
2028
2029 $15.72 Billion
2029
2030 $17.65 Billion
2030
2031 $19.83 Billion
2031
2032 $22.26 Billion
2032
2033 $25.00 Billion
2033
2034 $28.08 Billion
2034
2035 $31.60 Billion
2035

Key Takeaways

By Component: Software platforms held the largest share, expanding from USD 7.35 Billion in 2025 to USD 24.80 Billion by 2035; Software platforms are also the fastest growing at 12.8% CAGR from 2026–2035.

By Capability: Data quality and observability held the largest share, expanding from USD 3.90 Billion in 2025 to USD 12.60 Billion by 2035; Data cataloguing and governance is the fastest growing at 12.5% CAGR from 2026–2035.

By End User Industry: BFSI held the largest share, expanding from USD 2.60 Billion in 2025 to USD 7.70 Billion by 2035; Healthcare and life sciences is the fastest growing at 13.9% CAGR from 2026–2035.

Dominant Region: North America, with USD 4.10 Billion in 2025 rising to USD 12.00 Billion by 2035.

Fastest-Growing Region: Asia-Pacific at 14.2% CAGR from 2026–2035, reaching USD 8.10 Billion by 2035.

Dominant Country: U.S., with USD 3.55 Billion in 2025 rising to USD 10.20 Billion by 2035.

Fastest-Growing Country: India at 17.6% CAGR from 2026–2035, reaching USD 1.50 Billion by 2035.

The Data Usability System Market presents an absolute investment opportunity of USD 20.50 Billion between 2026 and 2035, which positions data readiness spending as one of the more durable enterprise software themes of the decade.

According to NMSC analysis, vendors that bundle quality scoring, lineage and access control inside one metadata layer win larger renewals, because buyers prefer one accountable platform over stitched tools.

What Does the Data Usability System Market Encompass?

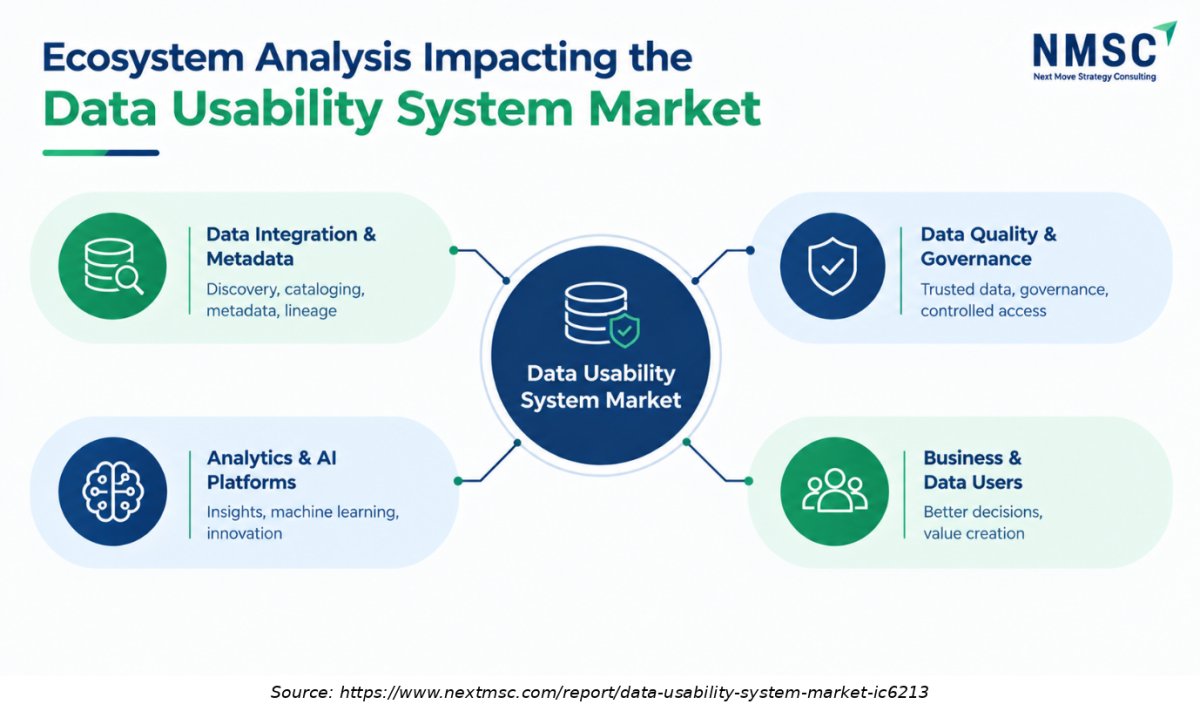
The Data Usability System Market covers software platforms and associated services that make enterprise data discoverable, trustworthy and ready for analytics and AI use. Core capabilities include data quality and observability, data cataloguing and governance, and data preparation with self-service access. Coverage excludes general data storage, raw pipeline tools sold alone, and business intelligence front ends.
The regulatory setting shapes demand directly. Regulation (EU) 2023/2854, known as the Data Act, became applicable on 12 September 2025 and sets rules on data access, sharing and interoperability across the European Union. Privacy statutes such as GDPR, India's Digital Personal Data Protection Act and Brazil's LGPD add lineage and access control duties that platform buyers must evidence.

Market Drivers & Dynamics

Interactive Dataset
AI and agent readiness programs driver +2.6% Global 2026–2035
Data sharing and privacy regulation driver +1.8% Europe, Asia-Pacific 2026–2031
Cloud data platform migration driver +1.5% North America, Europe 2026–2032
Skills shortage in data stewardship restraint −1.2% Global 2026–2030
Tool sprawl and integration cost restraint −0.9% North America, Europe 2026–2029
Platform consolidation and pricing pressure restraint −0.7% Global 2026–2030
Source: Next Move Strategy Consulting

Growth Drivers

What Is the Primary Growth Driver in the Data Usability System Market?

AI readiness programs are the primary driver of the Data Usability System Market. Enterprises moving agents and generative AI into production discover that poor labels, duplicate records and missing lineage cause visible failures. Budget owners therefore fund quality scoring and catalogue coverage before model rollout. We estimate that AI-related initiatives account for roughly 2.6 percentage points of the forecast CAGR, an industry-derived estimate based on vendor release patterns.

How Is Regulation Driving Market Growth?

Regulation converts data hygiene from an option into an obligation. The EU Data Act became applicable on 12 September 2025, and several of its interoperability and access duties phase in through 2027. Providers must document formats, provenance and access rights, which requires cataloguing and lineage tooling. Similar rules in India, Brazil and Saudi Arabia widen the compliance driven buyer base across regions.

Growth Inhibitors

What Is Restraining the Data Usability System Market?

A shortage of trained data stewards and the cost of integrating overlapping tools restrain adoption. Many enterprises run separate quality, catalogue and observability products, which raises administration effort and delays value realization. Smaller firms often defer purchases until a cloud suite bundles the capabilities. We treat the combined drag of about 2.8 percentage points as an industry derived estimate.

Segmentation Analysis

2025 (USD Billion)
2035 (USD Billion)
Software platforms 2025: $7.35 Billion | 2035: $24.80 Billion
Software pla
Services 2025: $2.45 Billion | 2035: $6.80 Billion
Services
Software platforms $7.35 Billion $24.80 Billion 12.8%
Services $2.45 Billion $6.80 Billion 10.8%

Which Component Leads the Data Usability System Market?

Software platforms dominate and also grow fastest, rising from USD 7.35 Billion in 2025 to USD 24.80 Billion by 2035 at 12.8% CAGR. Subscription pricing and agent features move spend toward platforms. Services still matter for implementation and stewardship outsourcing, yet they grow at 10.8% because cloud suites reduce custom effort.

2025 (USD Billion)
2035 (USD Billion)
Data quality
Data catalog
Data prepara
Segment Item 2025 (USD Billion) 2035 (USD Billion) CAGR
Data quality and observability $10.0 USD Billion $40.0 USD Billion 25.0%
Data cataloguing and governance $17.1 USD Billion $51.1 USD Billion 11.0%
Data preparation and access $24.2 USD Billion $62.2 USD Billion 25.0%

Segment-wise data is locked

Unlock complete segment-wise numbers for By Capability.

Unlock Full Data
2025 (USD Billion)
2035 (USD Billion)
BFSI
Healthcare a
Retail and c
IT and telec
Manufacturin
Segment Item 2025 (USD Billion) 2035 (USD Billion) CAGR
BFSI $10.0 USD Billion $40.0 USD Billion 27.0%
Healthcare and life sciences $17.1 USD Billion $51.1 USD Billion 9.0%
Retail and consumer goods $24.2 USD Billion $62.2 USD Billion 19.0%
IT and telecom $31.3 USD Billion $73.3 USD Billion 17.0%
Manufacturing and energy $38.4 USD Billion $84.4 USD Billion 18.0%

Segment-wise data is locked

Unlock complete segment-wise numbers for By End User Industry.

Unlock Full Data

Growth Opportunities

We found that three opportunities stand out for vendors and investors over the forecast window.

Where Does Unstructured Data Readiness Create New Revenue?

Enterprises hold large volumes of contracts, call transcripts and documents that generative AI now consumes. Quality, classification and access control for unstructured content remain thinly served. Vendors that extend catalogues and quality scoring to documents can charge for new asset classes. Healthcare, legal heavy BFSI and public sector buyers are the first beneficiaries, and attach rates to existing governance contracts look attractive.

How Can Mid-Market Packaging Unlock Underserved Buyers?

Midsize firms need data trust but lack stewards and budgets for enterprise suites. Prebuilt quality rules, usage based pricing and managed services let vendors reach this tier through cloud marketplaces. The beneficiary segment is services and software bundles in retail and consumer goods, where margins are tight and data teams are small. Channel partners that deliver outcome-based onboarding can capture much of this demand.

What Value Lies in Cross Border Compliance Automation?

Multinationals face overlapping rules from the EU Data Act, GDPR and national privacy laws. Automated policy mapping, lineage reports and access reviews reduce audit effort and fines exposure. Compliance automation modules sell well to BFSI and healthcare buyers because regulators ask for evidence on request. Vendors with strong regional data residency options hold an advantage in Europe, the Middle East and Asia-Pacific.

Regional Outlook

2025 (USD Billion)
2035 (USD Billion)
North Americ
Europe
Asia-Pacific
Middle East
Latin Americ
Region 2025 (USD Billion) 2035 (USD Billion) CAGR (%)
North America $10.0 USD Billion $40.0 USD Billion 9.0%
Europe $17.1 USD Billion $51.1 USD Billion 27.0%
Asia-Pacific $24.2 USD Billion $62.2 USD Billion 25.0%
Middle East & Africa $31.3 USD Billion $73.3 USD Billion 23.0%
Latin America $38.4 USD Billion $84.4 USD Billion 12.0%

Regional data is locked

Unlock complete regional numbers for this market.

Unlock Full Data

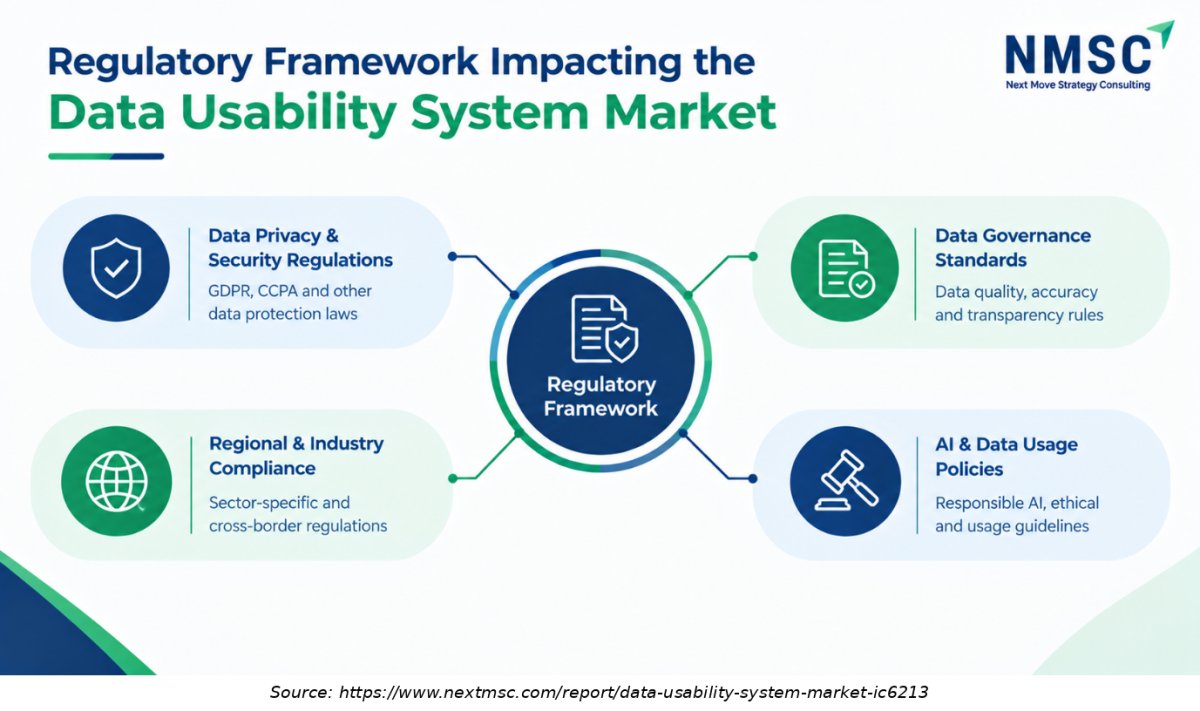
Regulatory framework Impacting the Data Usability System Market
The regulatory framework impacting the Data Usability System Market includes data privacy laws, data protection standards, data-sharing regulations, and AI governance requirements. These regulations guide how organizations collect, access, manage, and share data while ensuring privacy, security, transparency, and compliance.
Competitive Landscape

How Do Companies Compete in the Data Usability System Market?

Vendors compete on breadth of integrated capability, depth of automation and ecosystem reach. Hyperscale’s bundle catalogues and quality scoring with their data platforms, while specialists differentiate through connector coverage and vendor neutral operation. Pricing strategies range from consumption meters to enterprise subscriptions. Buyers weigh time to value, and partner networks strongly influence shortlists in regulated industries.

Which Vendor Archetypes Dominate?

Three archetypes dominate. Cloud and enterprise suite owners such as Microsoft, IBM and Salesforce compete on platform reach. Data management specialists such as Informatica within Salesforce, Qlik and Precisely compete on integration and quality depth. Governance focused vendors such as Collibra and Ataccama compete on unified trust, stewardship workflows and policy automation across mixed estates.

How Do Innovation and Differentiation Strategies Differ?

Differentiation now centers on agents, open interfaces and shared context. Precisely exposes platform APIs through a hosted Model Context Protocol server, Ataccama promotes an AI agent for remediation, and Microsoft offers AI generated quality rules. Vendors invest in lineage, data products and access governance, because customers want evidence that data is fit for each AI use case.

What Is the Pattern of M&A Activity?

Consolidation is steady. Salesforce agreed to acquire Informatica in May 2025, Qlik closed its Talend acquisition in 2023, and Collibra acquired Raito in June 2025 to add data access governance. Acquirers seek integration, quality and governance depth that supports AI agents. Geographic expansion typically follows through partners, and smaller specialists remain attractive tuck in targets.

Key Market Players

Based on research conducted by NMSC, we identified seven verified companies that design, develop and sell platforms for the Data Usability System Market, ranked qualitatively by platform breadth and operational scale.

Microsoft Corporation International Business Machines Corporation Salesforce, Inc. (including Informatica) Qlik Technologies Inc. (including Talend) Precisely Software Incorporated Collibra Ataccama

Latest Developments

We found that recent company and policy events point toward consolidation and agent led automation.

Date Event
October 2026 Collibra announced its acquisition of Munich-based trail ML, adding AI agents that interpret applicable frameworks, assess control effectiveness, identify gaps, gather evidence, and automate governance workflows
June 2026 Ataccama added governed data-product capabilities to Ataccama ONE and joined the Open Semantic Interchange initiative
May 2026 Precisely enhanced its Data Integrity Suite with a Data Integration Agent, a data-product marketplace delivered through its Huwise partnership, and expanded APIs exposed through a Precisely-hosted MCP server
February 2026 Ataccama launched Agentic Data Observability in Ataccama ONE, combining pipeline observability, unified alerting, automated data-quality checks, business context, and incident workflows

Expert Insights

Robin Sutara

Robin Sutara

Field Chief Data Strategy Officer | Databricks

"AI has unlocked a whole set of personas that we have to democratize and unlock access to data for."

Analyst Interpretation

The statement highlights the growing importance of data usability systems that allow employees with skills to access and understand organizational data. Natural-language interfaces, self-service analytics, and data-discovery capabilities can simplify interaction with complex datasets. This supports demand for systems that make enterprise data more accessible and useful across business functions

Investment Opportunities

Where Are Capital Inflows Concentrating?

Capital is flowing toward platform consolidation and agent features. Salesforce paid roughly USD 8 Billion for Informatica, and strategic investors continue to back specialists in quality and observability. Private equity also targets carve outs of mature data management assets. We expect investment appetite to track the USD 20.50 Billion opportunity between 2026 and 2035, favouring vendors with recurring revenue and strong cloud retention.

Which Infrastructure Investments Support Growth?

Infrastructure spending supports faster, safer data access. Enterprises invest in metadata stores, lineage capture, regional hosting and connectors that let quality checks run where data lives. Cloud providers are adding native governance services, and sovereign hosting requirements create demand for local capacity. Vendors that automate deployment across hybrid estates shorten sales cycles and lower service costs.

How Do ESG Considerations Shape Investment?

ESG reporting depends on reliable, auditable data. Emissions, supply chain and workforce metrics require lineage and quality controls before disclosure, which expands the buyer base into sustainability teams. Responsible AI policies also demand documented data provenance and bias checks. Investors increasingly screen vendors on privacy practice, energy efficient architectures and governance features that support credible reporting.

Key Benefits for Stakeholders

How Does the Data Usability System Market Report Benefit Enterprise and Industry Leaders?
Enterprise leaders gain a segment level view of capability spending, regional adoption and vendor archetypes. The forecast tables help size budgets for quality, catalogue and governance programs against AI timelines. Regulatory commentary highlights obligations under the EU Data Act and national privacy laws. Leaders can benchmark deployment choices and prioritize investments by industry and capability.

How Does the Report Benefit Investors and Financial Analysts?

Investors receive base, current and forecast values with CAGR calculations on one consistent basis from 2026 to 2035. The analysis separates growth by capability, industry and region, and flags consolidation patterns across recent transactions. Analysts can test valuation assumptions against the USD 20.50 Billion absolute opportunity and identify segments where recurring revenue and regulatory demand overlap.

How Does the Report Benefit Technology Vendors and Product Teams?

Product teams see where agents, data products and unified governance are changing buying criteria. Regional and country views identify markets with strong compliance pull, such as India and Saudi Arabia. Competitive archetypes and recent releases guide positioning, partnerships and pricing. Vendors can also use the opportunity analysis to prioritize roadmap items for unstructured data and mid-market packaging.

Key Market Segments Evaluated

By Component

  • Software platforms
  • Services

By Capability

  • Data quality and observability
  • Data cataloguing and governance
  • Data preparation and access

By End User Industry

  • BFSI
  • Healthcare and life sciences
  • Retail and consumer goods
  • IT and telecom
  • Manufacturing and energy

By Region

  • North America 
    • U.S.
    • Canada
    • Mexico
  • Europe 
    • UK
    • Germany
    • France
    • Italy
    • Spain
    • Sweden
    • Denmark
    • Finland
    • Netherlands
    • Rest of Europe
  • Asia-Pacific 
    • China
    • India
    • Japan
    • South Korea
    • Taiwan
    • Indonesia
    • Vietnam
    • Australia
    • Philippines
    • Malaysia
    • Rest of APAC
  • Middle East & Africa 
    • Saudi Arabia
    • UAE
    • Egypt
    • Israel
    • Turkey
    • Nigeria
    • South Africa
    • Rest of MEA
  • Latin America 
    • Brazil
    • Argentina
    • Chile
    • Colombia
    • Rest of LATAM

Conclusion & Recommendations

The long-term outlook is constructive. Revenue should rise from USD 11.10 Billion in 2026 to USD 31.60 Billion by 2035 as AI programs, regulation and cloud migration reinforce demand. Software platforms keep gaining share, and governance and catalogue capabilities grow fastest. Growth should stay broad based, with Asia-Pacific and healthcare supplying the strongest incremental momentum through the forecast period.

What Strategic Positioning Recommendations Does NMSC Offer?

NMSC recommends that vendors unify quality, catalogue and access governance on one metadata layer and expose it through open interfaces for agents. Enterprises should consolidate tools, assign data product owners and tie quality metrics to AI use cases. Services firms should package compliance and stewardship outcomes. Regional partnerships and in market hosting remain essential for Europe, the Gulf and India.

How Strong Is the Investment Attractiveness of the Data Usability System Market?

Attractiveness is high but selective. Recurring subscriptions, regulatory pull and strategic acquirer interest support valuations, while tool sprawl and pricing pressure Favor scaled platforms. Investors should Favor vendors with measurable retention, cloud native delivery and credible agent roadmaps. Specialists with unique capabilities in unstructured data or access governance remain logical targets for larger suites seeking depth.

What Are the Market Shifts and Key Risks in the Data Usability System Market?

Key shifts include consolidation, agentic automation and the rise of data products as a procurement unit. Risks include skills shortages, integration complexity and slower budgets if AI pilots disappoint. Regulatory fragmentation across countries raises compliance cost, and hyperscale bundling may compress standalone pricing. Vendors should monitor these forces quarterly and adjust packaging before renewal cycles.

What Are the Primary Growth Pathways Through 2035?

Growth pathways include expansion into unstructured data, mid-market bundles, compliance automation and emerging regions. Healthcare, manufacturing and public sector programs offer the fastest incremental demand. Partnerships with cloud providers and integrators extend reach, while marketplace listings shorten procurement. Vendors executing on two or three of these pathways should outperform the 12.3% market growth rate.

FAQs

Sources & References

1.

Informatica Inc. Form 8-K, Salesforce transaction announcement (SEC)

sec.gov
2.

Informatica Inc. Form 8-K, second quarter 2025 results (SEC)

sec.gov
3.

Qlik, Qlik acquires Talend press release

qlik.com
4.

Microsoft Learn, Microsoft Purview data governance overview

learn.microsoft.com
5.

Microsoft Learn, Microsoft Purview data quality overview

learn.microsoft.com
6.

IBM, watsonx.data intelligence documentation

ibm.com
7.

IBM, Governance and Catalog product page

ibm.com
8.

Collibra, Collibra Platform

collibra.com
9.

Collibra, Raito acquisition press release (PR Newswire)

prnewswire.com
10.

Precisely, Data Integrity Suite data quality service release

precisely.com
11.

Precisely, new AI agents release, February 2026 (PR Newswire)

prnewswire.com
12.

Precisely, Agentic-Ready Data release, May 2026 (PR Newswire)

prnewswire.com
13.

Ataccama, company news release, February 2026

ataccama.com
14.

EUR-Lex, Regulation (EU) 2023/2854 (Data Act)

eur-lex.europa.eu
15.

BigDATAwire, Informatica and Salesforce announcement coverage (executive statement)

bigdatawire.com

About the Author

Mayurima Roy

Mayurima Roy

Mayurima Roy is Research Analyst at Next Move Strategy Consulting, where she has spent 4 years working across the firm's full industry coverage rather than a single fixed vertical. Her work centers on structured research, ongoing trend tracking, competitive assessment, and insight-led content development, translating complex market data into clear, decision-ready narratives that support informed client decision-making across diverse global industries, market sectors, and world regions every day.

About the Reviewer

Supradip Baul

Supradip Baul

Supradip Baul is an accomplished business consultant and strategist with over a decade of rich experience in market intelligence, strategy, technology, and business transformation. His work has included rigorous qualitative and quantitative analysis across multiple industries, helping clients shape investment decisions and long-term roadmaps. Earlier in his career, he was associated with Gartner, where he contributed to industry-leading reports and market share analyses. He has worked with leading global companies and holds an MBA with a dual specialization in Marketing and Finance.

Download Free Sample

Diana Trejo

DIANA TREJO

Assistant Manager

Sumitomo Corporation de Mexico, S.A. de C.V.

Recently, we purchased a report on the Mexico Data Center Market from Next Move Strategy Consulting. The service has been excellent, with support that is always timely and thoroughly professional. The information provided is interesting, highly useful, and delivered with clarity. I would highly recommend NextMSC for anyone seeking insightful and dependable analysis.

Melanie Samko

MELANIE SAMKO

Director of Marketing

TOSOH BIOSCIENCE, INC.

The information provided by NMSC is incredibly valuable, thank you so much for such a excellent work. I really appreciate it. I will make sure to reference all of it, in my summary document.

Kishu Kanda

KISHU KANDA

Strategy Analyst

Accenture

We purchased the AI Consumer Market Report from this company. Not only did they customize the report to meet our specific requirements, but they also showed great flexibility in accommodating our budget. The report we received fully met our expectations. Additionally, they provided prompt and thorough responses to both our pre-purchase and follow-up questions. We look forward to working with this company again in the future.

Kevin Coker

KEVIN COKER

Founder, CEO and Board Diector

Proxima Clinical Research

I have been using Next MSC reports for product positioning in a new geography for a long time. They have by far the best reports I have found and the price is reasonable too!

Henri Knyphausen

HENRI KNYPHAUSEN

Partner at Singulier [Ex-BCG]

Singulier

I recently engaged NEXTMSC.com for a commercial due diligence project within the intralogistics sector, and I am pleased to provide a reference based on my experience. In utilizing NEXTMSC.com's services, I found their report to offer valuable insights into market dynamics and key industry players. The initial report provided a solid foundation for our analysis. However, as we were investigating a smaller target in the market, and I had specific customization requests requiring additional research. These requests included detailed information on product portfolios of various players and sub-market sizes, both inclusive and exclusive of certain product categories. NEXTMSC.com demonstrated commendable responsiveness and agility in accommodating these customization requests. Within a timeframe of 1-2 weeks, they delivered a revised report that met our specific needs. Furthermore, they were receptive to my follow-up inquiries, ensuring clarity and understanding of the data provided. The final deliverable significantly contributed to our due diligence efforts. One of NEXTMSC.com's notable strengths lies in their qualitative research capabilities. However, for future engagements, I would recommend the inclusion of a quantified market model in Excel format. Such a model would offer the ability to conduct in-depth analyses and explore various market segments, including country-specific data and subcomponent breakdowns. Based on my positive experience, I would not hesitate to work with NEXTMSC.com again. Their responsiveness, willingness to accommodate customization requests, and commitment to delivering actionable insights make them a reliable partner for commercial research projects.

Custom Market Research Services

We will customize the research for you if the listed report does not fully match your requirements.

Get 30% Free Customization

Select License

This website uses cookies to ensure you get the best experience on our website. Learn more

✖