Flexibility Platform Market Size, Share, Trends and Growth Analysis, By End User (System Operators, Energy Retailers and Utilities, Independent Aggregators, Asset Owners and IPPs, C&I End Users, Mobility Operators and OEMs, and Community & Microgrids), By Flexible Resource (Load, EV & Charging, Battery Energy Storage, Distributed Generation, Mixed DER, and Others), By Platform Function, By Commercial Model, By Deployment Model, and Region – Global Industry Report and Forecast, 2026–2035
Industry: Energy & Power | Publishing Date: July 18, 2026 | Last Updated: September 30, 2026 | No of Pages: N/A | No. of Tables: N/A | No. of Figures: N/A | Format: PDF | Report Code: EP5215
What Is the Flexibility Platform Market Size?
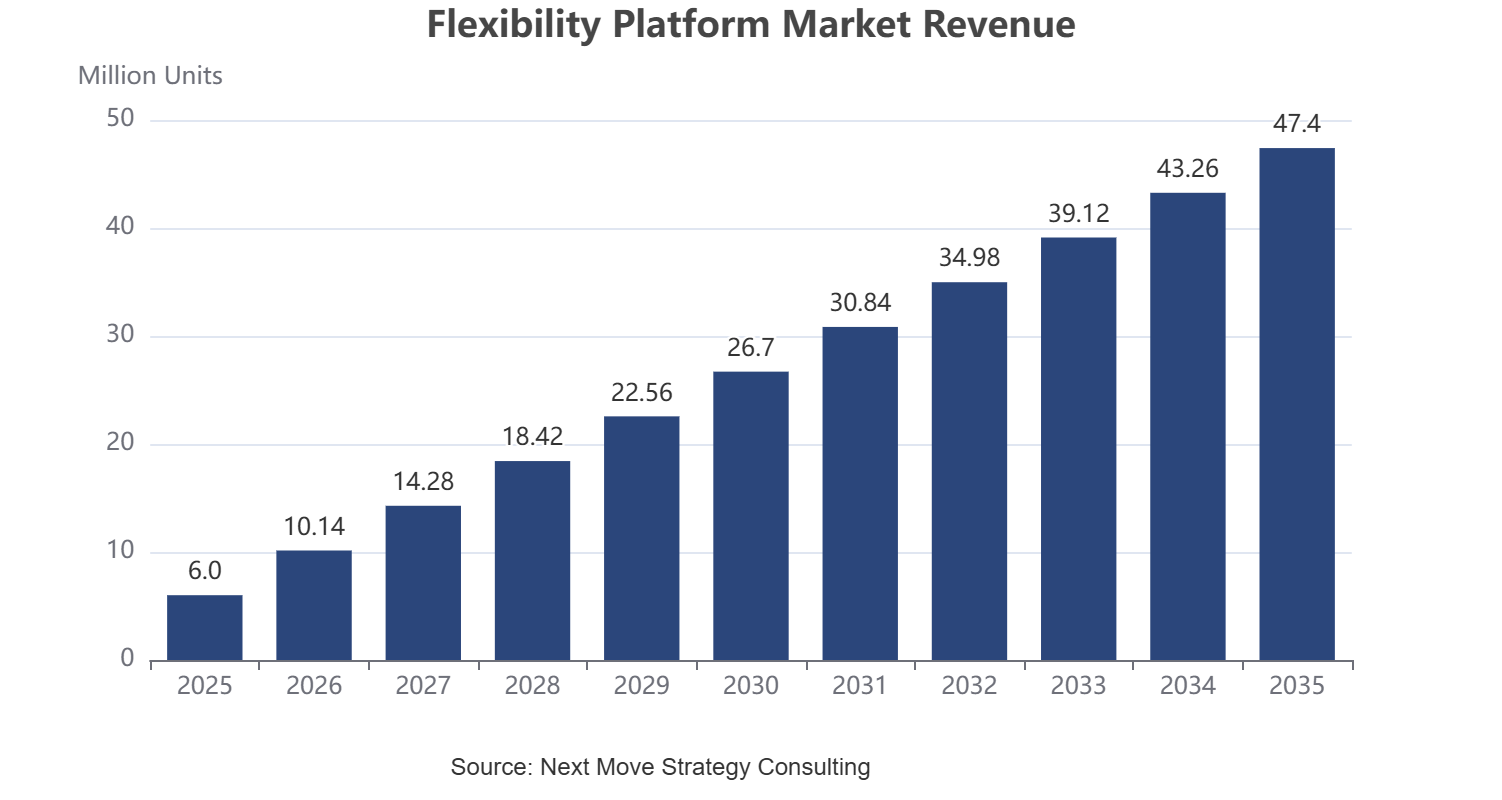
The global flexibility platform market size was valued at USD 6.0 billion in 2025 and is estimated at USD 7.4 billion in 2026, forecast to reach USD 47.4 billion by 2035, expanding at a 22.9% CAGR between 2026 and 2035. North America leads with approximately 34% share, while Load-based flexibility dominates all other flexible resource types with approximately 30% share.
We observed that growth is broad-based across every segmentation axis, with battery energy storage commercialization and data center load flexibility driving the dominant structural shifts through 2035.
|
Key Takeaways |
|
By System Operators: DSO Flexibility Procurement held the largest share of approximately 34% (USD 2.04 Billion) in 2025; Local Constraint Markets is the fastest-growing sub-segment at 25.1% CAGR from 2026–2035. |
|
By Energy Retailers and Utilities: Residential DR and VPP Programs held the largest share of approximately 31% (USD 1.86 Billion) in 2025; EV and V2G Programs is the fastest-growing sub-segment at 26.0% CAGR from 2026–2035. |
|
By Independent Aggregators: Third Party Asset Aggregation held the largest share of approximately 36% (USD 2.16 Billion) in 2025; Local Flexibility Markets is the fastest-growing sub-segment at 28.0% CAGR from 2026–2035. |
|
By Asset Owners and IPPs: BESS Commercialization held the largest share of approximately 38% (USD 2.28 Billion) in 2025; Hybrid Asset Optimization is the fastest-growing sub-segment at 24.2% CAGR from 2026–2035. |
|
By C&I End Users: Industrial Load Flexibility held the largest share of approximately 33% (USD 1.98 Billion) in 2025; Data Center Flexibility is the fastest-growing sub-segment at 27.6% CAGR from 2026–2035. |
|
By Mobility Operators and OEMs: Fleet and Depot Charging held the largest share of approximately 37% (USD 2.22 Billion) in 2025; V2G and V2X Aggregation is the fastest-growing sub-segment at 28.6% CAGR from 2026–2035. |
|
By Community and Microgrids: Community Flexibility held the largest share of approximately 39% (USD 2.34 Billion) in 2025; Campus and Municipal is the fastest-growing sub-segment at 24.5% CAGR from 2026–2035. |
|
By Flexible Resource: Load held the largest share of approximately 30% (USD 1.80 Billion) in 2025; Battery Energy Storage is the fastest-growing sub-segment at 25.5% CAGR from 2026–2035. |
|
By Platform Function: Dispatch and Control held the largest share of approximately 27% (USD 1.62 Billion) in 2025; Trading and Market Access is the fastest-growing sub-segment at 25.9% CAGR from 2026–2035. |
|
By Commercial Model: SaaS held the largest share of approximately 34% (USD 2.04 Billion) in 2025; Performance Fee is the fastest-growing sub-segment at 26.9% CAGR from 2026–2035. |
|
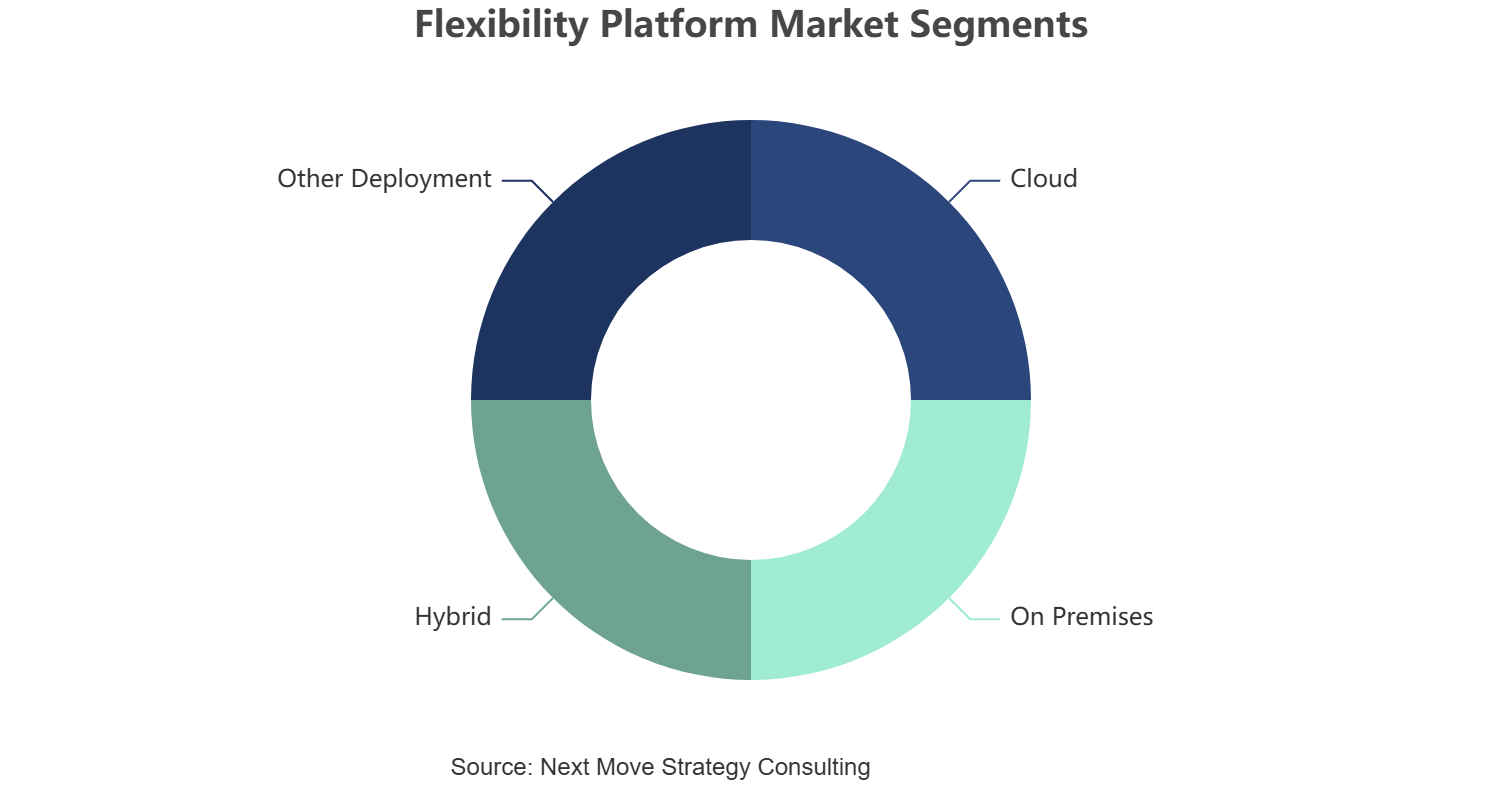
By Deployment Model: Cloud held the largest share of approximately 58% (USD 3.48 Billion) in 2025; Hybrid is the fastest-growing sub-segment at 27.3% CAGR from 2026–2035. |
|
Dominant Region: North America dominated with approximately 34% revenue share (USD 2.04 Billion) in 2025. |
|
Fastest-Growing Region: Asia-Pacific is expected to register the highest CAGR of 28.0% during 2026–2035. |
|
Dominant Country: U.S. led with approximately USD 1.59 Billion in 2025. |
|
Fastest-Growing Country: India is the fastest-growing country at approximately 32.2% CAGR from 2026–2035. |
Market Opportunity: The flexibility platform market is expected to create an absolute dollar opportunity of USD 40.0 billion between 2026 and 2035, presenting significant investment potential across the distributed energy resource orchestration and grid services value chain.
According to Next Move Strategy Consulting analysis, independent aggregators are increasingly bundling battery storage, EV charging, and industrial load assets into single-platform portfolios to qualify for wholesale and ancillary service markets, a shift that favors platform providers with multi-resource orchestration capability over single-asset specialists as market rules mature through 2035.
What Does the Flexibility Platform Market Encompass?
The flexibility platform market encompasses software and orchestration systems that enroll, forecast, dispatch, and settle distributed energy resources, including batteries, electric vehicles, demand response loads, and distributed generation, on behalf of system operators, utilities, aggregators, and asset owners. Our assessment indicates that the scope spans cloud-native SaaS platforms, managed services, and integration layers supplied to DSOs, TSOs, energy retailers, C&I end users, mobility operators, and community microgrid operators participating in wholesale, ancillary service, and local flexibility markets worldwide.
Regulatory frameworks such as the U.S. Federal Energy Regulatory Commission's Order 2222, which opens wholesale markets to distributed energy resource aggregations, and the European Union's Electricity Market Design reforms shape platform interoperability and market-access requirements, while national flexibility market pilots led by system operators increasingly influence platform certification standards. We observed that technology adoption is shifting toward AI-driven forecasting and real-time dispatch engines that replace static demand response scheduling. Next Move Strategy Consulting's analysis indicates that this structural shift, combined with rising data center and EV charging load growth, is redefining procurement criteria across the flexibility platform market.
|
Field |
Details |
|
Market Size in 2025 |
USD 6.0 Billion |
|
Market Size in 2026 |
USD 7.4 Billion |
|
Revenue Forecast in 2035 |
USD 47.4 Billion |
|
Growth Rate |
CAGR of 22.9% from 2026 to 2035 |
|
Analysis Period |
2025–2035 |
|
Base Year Considered |
2025 |
|
Forecast Period |
2026–2035 |
|
Market Size Estimation |
Revenue (USD Billion) |
|
Companies Profiled |
20 |
|
Countries Covered |
33 |
|
Market Share |
Available for Top 10 Companies |
Key Emerging Trends
Based on research conducted by Next Move Strategy Consulting, we found that four structural trends are reshaping platform architecture, market participation, and stakeholder engagement across the industry.
How Is AI-Driven Forecasting Transforming Flexibility Dispatch?
Machine-learning forecasting engines are replacing static scheduling algorithms to improve dispatch accuracy across distributed asset portfolios. We observed that Kraken Technologies' AI-powered orchestration platform, expanded through a 2026 partnership with Schneider Electric, coordinates electric vehicles, batteries, and heat pumps alongside utility-scale storage to shift consumption in real time. Aggregators are adopting these engines to satisfy tightening dispatch-accuracy requirements set by system operators across wholesale and ancillary service markets.
Why Are OEM-Direct API Integrations Gaining Traction in Mobility Flexibility?
Automakers are increasingly integrating charging application programming interfaces directly with flexibility platforms rather than relying solely on third-party hardware. Our findings suggest that Kaluza's direct API partnership with BMW Group, launched in November 2025, enables automated vehicle-to-grid smart charging without additional hardware. Original equipment manufacturers are expanding these direct integrations, positioning platform providers as embedded infrastructure within next-generation electric vehicle ecosystems.
How Is Data Center Load Growth Reshaping C&I Flexibility Demand?
Rising electricity demand from data centers is elevating commercial and industrial flexibility as a grid-capacity tool rather than a cost-saving measure alone. We observed that platform providers are partnering with grid-visibility specialists to forecast congestion and shift data center and industrial loads in real time, unlocking network capacity without immediate infrastructure investment. This trend is accelerating platform adoption among large-load customers seeking faster grid connections.
What Role Does Global Utility Licensing Play in Platform Scaling?
Multi-market licensing agreements between platform providers and global utility groups are accelerating platform scaling beyond single-country deployments. Our analysis shows that Kaluza's global agreement with ENGIE, signed in September 2025, deploys its Energy Intelligence Platform across ENGIE's international business-to-consumer operations. Energy retailers are increasingly favoring platform vendors with proven multi-market deployment track records over single-region specialists.
Ecosystem Analysis of the Flexibility Platform Market
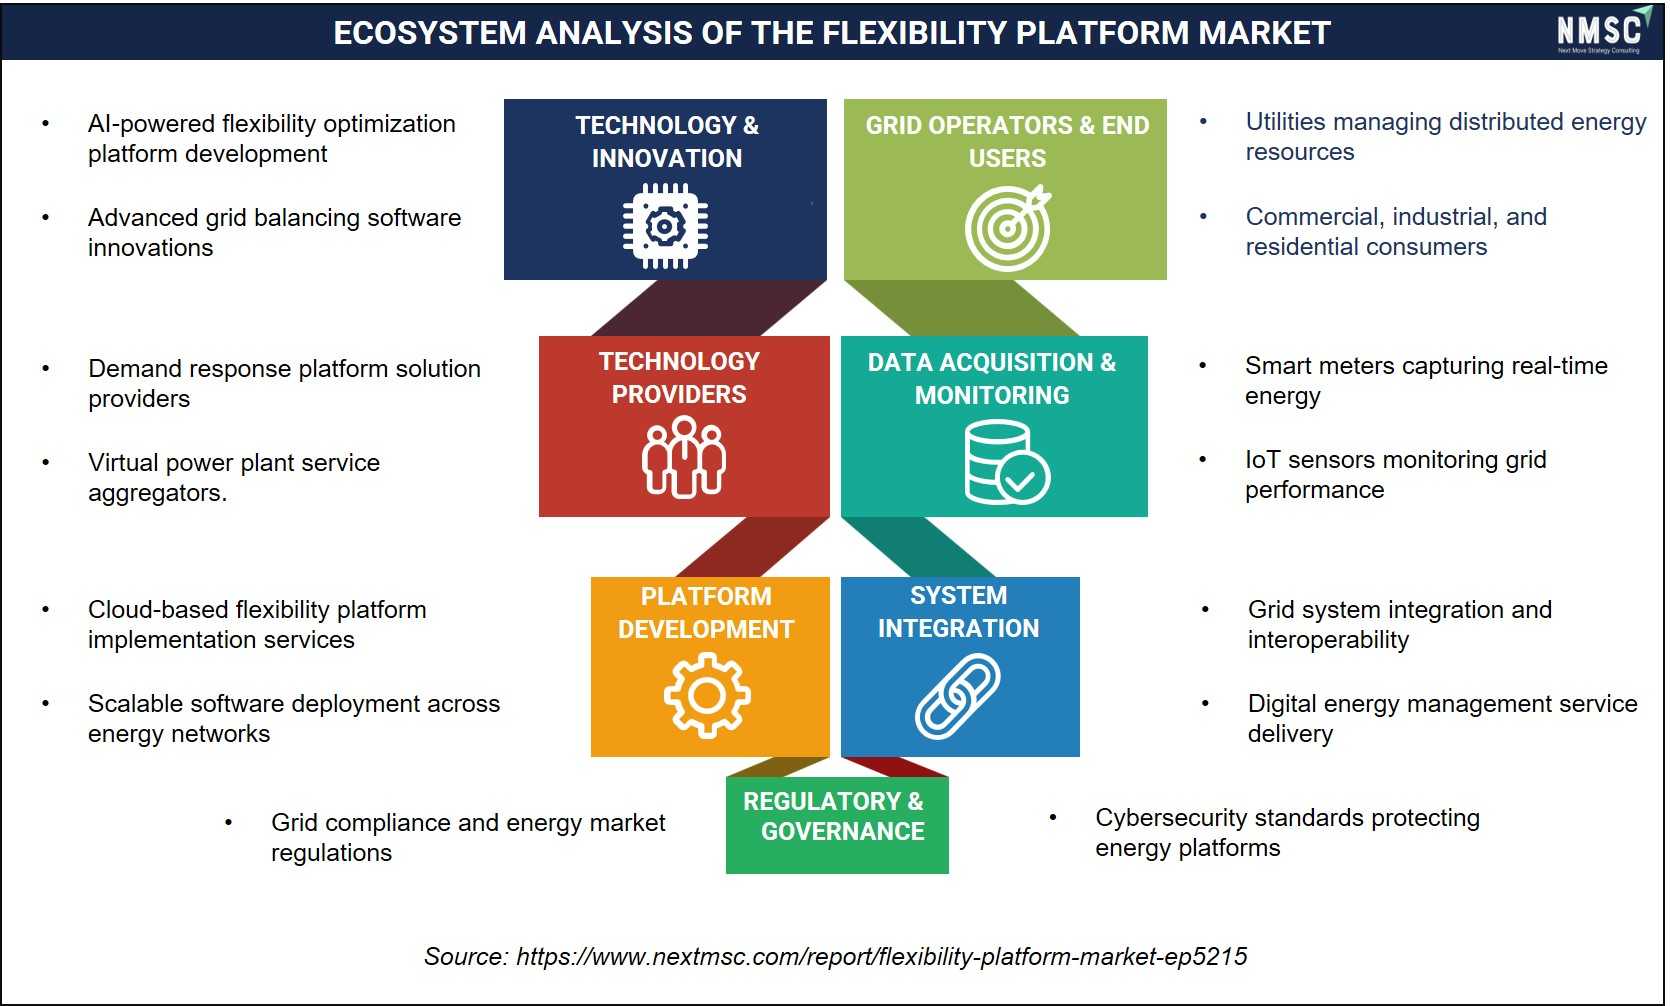
The Ecosystem Analysis of the Flexibility Platform Market illustrates the collaboration among technology providers, platform developers, system integrators, utilities, grid operators, and end users to enable grid flexibility. Advanced data acquisition, real-time monitoring, and digital platform integration support efficient distributed energy resource (DER) management. Regulatory frameworks and ongoing technological innovation further drive interoperability, demand response, virtual power plants, and optimized energy balancing across modern electricity networks.
Growth Drivers and Restraints
Growth Catalyst and Risk Assessment Matrix
|
Factors |
Type |
(+/−) % Impact on CAGR |
Geographic Relevance |
Impact Timeline |
|
Rising data center and AI-driven electricity load growth |
Driver |
+4.8% |
Global |
2026-2035 |
|
FERC Order 2222 and wholesale market access for DER aggregations |
Driver |
+3.6% |
North America |
2026-2035 |
|
EU Electricity Market Design reform and national flexibility markets |
Driver |
+3.1% |
Europe |
2026-2035 |
|
Falling battery storage costs and BESS commercialization |
Driver |
+3.4% |
Global |
2026-2035 |
|
Expansion of EV fleets and V2G-capable charging infrastructure |
Driver |
+2.7% |
Global |
2026-2035 |
|
Renewable capacity additions requiring grid balancing services |
Driver |
+2.2% |
Asia-Pacific |
2026-2035 |
|
Utility digitalization and cloud-native platform migration |
Driver |
+1.9% |
Global |
2026-2032 |
|
Grid interconnection queue congestion and permitting delays |
Restraint |
-1.6% |
North America, Europe |
2026-2035 |
|
Fragmented, evolving market rules across jurisdictions |
Restraint |
-1.3% |
Global |
2026-2032 |
|
Cybersecurity and data-interoperability compliance costs |
Restraint |
-0.9% |
Europe, North America |
2028-2035 |
What Is the Primary Growth Driver of the Flexibility Platform Market?
Rising electricity demand from data centers and AI compute infrastructure is the primary driver of the market. The U.S. Federal Energy Regulatory Commission's Order 2222 continues to open wholesale and ancillary service markets to distributed energy resource aggregations, sustaining demand for platforms that coordinate batteries, EVs, and industrial loads. We observed that this policy shift, reinforced by accelerating large-load grid connection requests, continues to anchor baseline platform adoption across developed and emerging electricity markets alike.
How Is Battery Storage Commercialization Driving Flexibility Platform Market Growth?
Falling battery storage costs and accelerating BESS commercialization are driving market growth toward multi-resource orchestration platforms. The International Energy Agency continues to track declining battery pack costs alongside rising utility-scale storage deployment. Our assessment indicates that this cost trend, combined with expanding electric vehicle fleets, is compressing adoption timelines for platforms capable of dispatching batteries and EV charging assets jointly across wholesale and local flexibility markets.
What Is Restraining Flexibility Platform Market Expansion?
Fragmented and evolving market rules across jurisdictions restrain platform standardization and slow cross-border scaling. The International Renewable Energy Agency tracks wide variation in flexibility market design maturity across regions, complicating platform certification for aggregators operating internationally. We found that smaller regional platform providers face particular exposure, as limited scale reduces their ability to absorb compliance costs compared with larger, multi-market platform groups.
Segmentation Analysis
Segment Sizing: By Flexible Resource
|
Segment |
2025 (USD) |
2035 (USD) |
CAGR% (2026–2035) |
|
Load |
USD 1.80 Billion |
USD 10.43 Billion |
19.2% |
|
EV and Charging |
USD 1.32 Billion |
USD 11.38 Billion |
24.0% |
|
Battery Energy Storage |
USD 1.56 Billion |
USD 15.17 Billion |
25.5% |
|
Distributed Generation |
USD 0.78 Billion |
USD 5.69 Billion |
22.0% |
|
Mixed DER |
USD 0.42 Billion |
USD 3.79 Billion |
24.6% |
|
Other Flexible Resource |
USD 0.12 Billion |
USD 0.95 Billion |
23.0% |
|
Total |
USD 6.00 Billion |
USD 47.40 Billion |
22.9% |
Which Flexible Resource Segment Dominates the Flexibility Platform Market?
Load, encompassing curtailable and shiftable demand response capacity, led the market with USD 1.80 billion in 2025, supported by its low integration cost and near-universal availability across residential, commercial, and industrial customers. We observed that Battery Energy Storage is the fastest-growing flexible resource, expanding at a 25.5% CAGR from 2026 to 2035, as falling storage costs and grid-balancing requirements accelerate BESS commercialization across every region.
Segment Sizing: By Platform Function
|
Segment |
2025 (USD) |
2035 (USD) |
CAGR% (2026–2035) |
|
Enrollment and Engagement |
USD 1.08 Billion |
USD 6.64 Billion |
19.9% |
|
Forecasting and Optimization |
USD 1.44 Billion |
USD 10.90 Billion |
22.4% |
|
Dispatch and Control |
USD 1.62 Billion |
USD 12.32 Billion |
22.5% |
|
Trading and Market Access |
USD 1.14 Billion |
USD 11.38 Billion |
25.9% |
|
Measurement and Settlement |
USD 0.54 Billion |
USD 4.74 Billion |
24.3% |
|
Other Platform Function |
USD 0.18 Billion |
USD 1.42 Billion |
23.0% |
|
Total |
USD 6.00 Billion |
USD 47.40 Billion |
22.9% |
Which Platform Function Segment Leads Flexibility Platform Market Demand?
Dispatch and Control functionality remained the leading platform function within the market, valued at USD 1.62 billion in 2025, on sustained demand for real-time asset coordination across wholesale and ancillary service programs. Our findings suggest that Trading and Market Access is the fastest-growing function, registering a 25.9% CAGR from 2026 to 2035, as aggregators increasingly require direct market-bidding capability to monetize flexibility across multiple revenue streams.
Segment Sizing: By Commercial Model
|
Segment |
2025 (USD) |
2035 (USD) |
CAGR% (2026–2035) |
|
SaaS |
USD 2.04 Billion |
USD 16.59 Billion |
23.3% |
|
Managed Service |
USD 1.44 Billion |
USD 8.53 Billion |
19.5% |
|
Performance Fee |
USD 1.14 Billion |
USD 12.32 Billion |
26.9% |
|
Transaction Fee |
USD 0.78 Billion |
USD 6.64 Billion |
23.9% |
|
Integration Services |
USD 0.42 Billion |
USD 2.37 Billion |
18.9% |
|
Other Commercial Model |
USD 0.18 Billion |
USD 0.95 Billion |
18.1% |
|
Total |
USD 6.00 Billion |
USD 47.40 Billion |
22.9% |
Which Commercial Model Is Most Widely Adopted in the Flexibility Platform Market?
SaaS remained the dominant commercial model across the market, reaching USD 2.04 billion in 2025 due to its lower upfront cost and rapid deployment advantages for utilities and aggregators. Based on research conducted by Next Move Strategy Consulting, we found that Performance Fee models represent the fastest-growing category at a 26.9% CAGR from 2026 to 2035, reflecting asset owners' preference for revenue-aligned pricing structures tied to realized flexibility value.
Growth Opportunities
Our analysis shows that three forward-looking opportunities stand out for stakeholders positioning within the flexibility platform market over the 2026-2035 forecast period.
How Can Data Center Flexibility Platforms Unlock Value for C&I End Users?
Data center flexibility presents a whitespace opportunity for platform providers serving large-load commercial and industrial customers seeking faster grid connections. Suppliers that commercialize congestion-forecasting and real-time load-shifting capability stand to capture recurring platform subscription revenue as data center operators increasingly treat flexibility as a prerequisite for interconnection approval, particularly in constrained North American and European grid regions.
Where Does Performance Fee Pricing Create New Demand Among Asset Owners?
Independent power producers and asset owners represent an underpenetrated opportunity for platforms offering performance-fee and revenue-share pricing models. Providers that develop transparent, auditable value-attribution engines can secure long-term contracts with BESS and renewable asset owners, benefiting from recurring, revenue-aligned income tied to realized wholesale and ancillary market participation.
How Can V2G-Ready Mobility Platforms Benefit Fleet Operators and OEMs?
Fleet operators and automotive OEMs seeking vehicle-to-grid revenue create an opportunity for platform providers offering direct API integration and depot-charging orchestration. Early movers that secure OEM partnerships for bidirectional charging can differentiate with commercial fleet operators pursuing new revenue streams from idle vehicle batteries across logistics and last-mile delivery fleets.
Strategic Framework of the Flexibility Platform Market
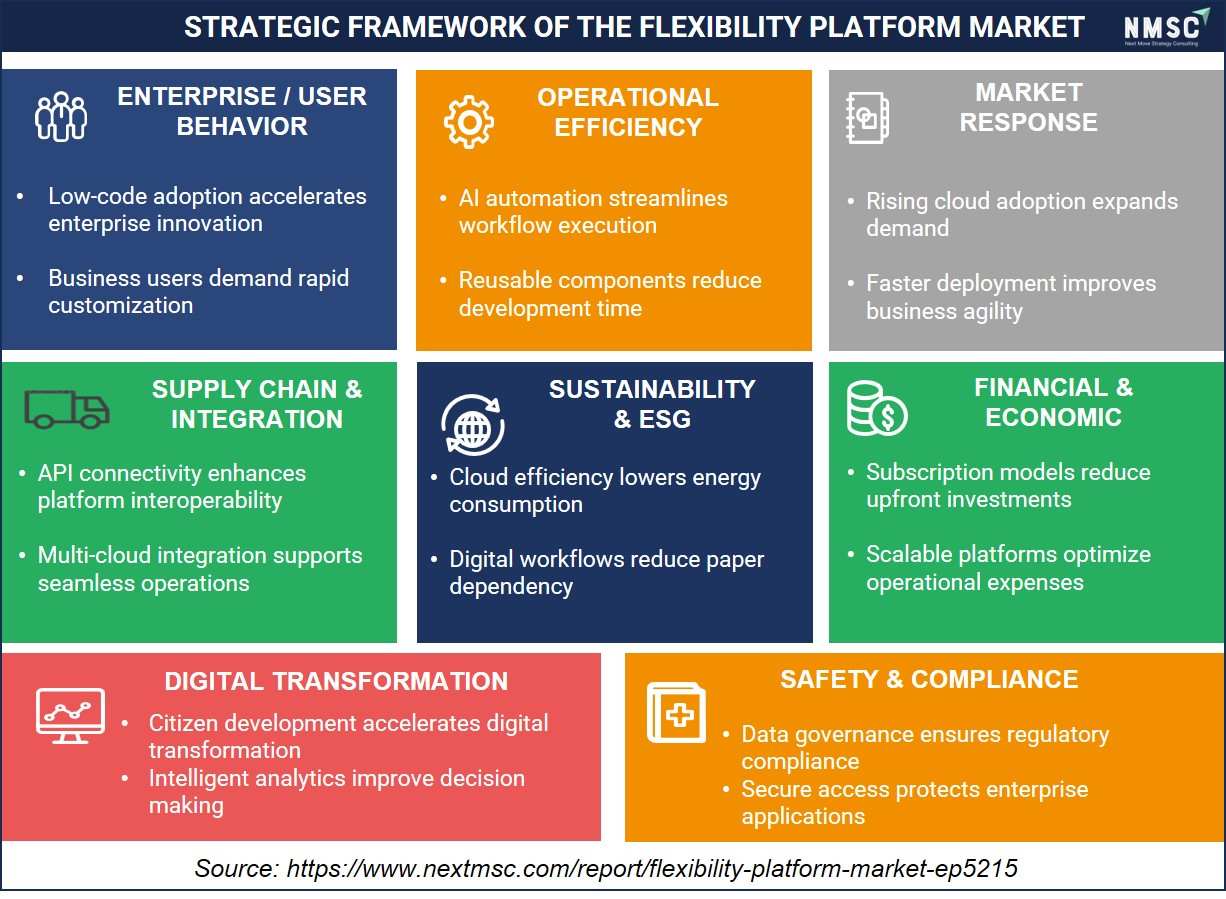
The Strategic Framework of the Flexibility Platform Market highlights how AI-driven automation, cloud adoption, and platform interoperability are transforming grid flexibility management. Organizations are leveraging scalable, cloud-based platforms to optimize distributed energy resources, improve operational efficiency, and accelerate digital transformation. Increasing focus on data governance, regulatory compliance, sustainability, and cost-effective subscription models is enabling utilities, aggregators, and enterprises to enhance grid reliability, flexibility, and long-term business value.
Regional Outlook
Geographic Performance Snapshot
|
Region |
2025 (USD) |
2035 (USD) |
CAGR% (2026–2035) |
Key Driver |
|
North America |
USD 2.04 Billion |
USD 12.32 Billion |
19.7% |
FERC Order 2222 market access and mature DER aggregation infrastructure |
|
Europe |
USD 1.80 Billion |
USD 11.38 Billion |
20.2% |
EU Electricity Market Design reform and national flexibility market rollouts |
|
Asia-Pacific |
USD 1.32 Billion |
USD 15.64 Billion |
28.0% |
Rapid renewable capacity additions and expanding data center load growth |
|
Middle East & Africa |
USD 0.48 Billion |
USD 4.74 Billion |
25.7% |
Grid modernization investment tied to national diversification programs |
|
Latin America |
USD 0.36 Billion |
USD 3.32 Billion |
24.9% |
Distributed generation growth and expanding organized retail electricity markets |
|
Total |
USD 6.00 Billion |
USD 47.40 Billion |
22.9% |
– |
North America Flexibility Platform Market Outlook
North America leads the flexibility platform market with an established wholesale market structure and mature distributed energy resource aggregation infrastructure. We observed that the U.S. Federal Energy Regulatory Commission's Order 2222 sustains demand for platforms capable of bidding aggregated resources into wholesale markets, while data center operators increasingly specify flexibility platforms to accelerate grid connections. Technology adoption remains advanced, with AI-driven dispatch engines gaining share across the region's deregulated electricity markets.
Europe Flexibility Platform Market Outlook
Europe's flexibility platform market reflects a mature but regulation-intensive landscape shaped by the European Union's Electricity Market Design reform and national flexibility market pilots. Our findings suggest that platform providers across the UK, Germany, and France are accelerating adoption of local flexibility market participation tools to satisfy distribution system operator congestion management requirements. Technology adoption favors interoperable, standards-based platforms, supported by regional system operators investing in common flexibility market frameworks.
Asia-Pacific Flexibility Platform Market Outlook
Asia-Pacific is the fastest-growing flexibility platform market region, propelled by rapid renewable capacity additions in China and India and expanding data center load growth across the region. We found that regulatory frameworks remain less harmonized than in Europe, giving platform providers flexibility to scale rapidly across emerging deregulated markets. Technology adoption is accelerating as regional utilities, including several China-based grid operators, expand distributed energy resource management deployments.
Middle East & Africa Flexibility Platform Market Outlook
The flexibility platform market in Middle East & Africa is expanding as Gulf Cooperation Council economies diversify into renewable-heavy grid infrastructure and hospitality-driven electricity demand rises. Our analysis shows that Saudi Arabia and the UAE are attracting grid-modernization investment tied to national diversification programs. Regulatory influence remains moderate, while technology adoption is gradually shifting toward imported flexibility platforms as regional utilities align with global grid-balancing expectations.
Latin America Flexibility Platform Market Outlook
Latin America's flexibility platform market is supported by growing distributed generation penetration in Brazil and Argentina and expanding organized retail electricity markets. We observed that regulatory frameworks are less stringent than in North America or Europe, though national utilities operating locally are introducing demand response and local flexibility programs. Technology adoption remains centered on residential demand response platforms, with competitive intensity increasing as regional utilities partner with global platform integrators.
U.S. Flexibility Platform Market
Based on our estimates, the U.S. market was valued at approximately USD 1.59 billion in 2025 and is projected to reach USD 8.63 billion by 2035, growing at an 18.4% CAGR. Demand is anchored by mature wholesale market participation, high data center load growth, and Federal Energy Regulatory Commission Order 2222 market-access provisions. Technology penetration favors AI-driven dispatch platforms, and competitive intensity remains high among established aggregators serving deregulated regional transmission organizations.
Canada Flexibility Platform Market
The market in Canada reached roughly USD 0.29 billion in 2025 and is forecast to hit USD 1.85 billion by 2035 at a 20.5% CAGR. Demand structure mirrors U.S. wholesale and demand response participation patterns, while provincial system operators shape aggregation-eligibility requirements. Technology penetration is rising as utilities request cloud-native flexibility platforms, with competitive intensity moderate given the market's reliance on cross-border platform vendors from the U.S.
UK Flexibility Platform Market
As per our estimate, the UK market stood at about USD 0.38 billion in 2025, advancing toward USD 2.16 billion by 2035 at a 19.0% CAGR. Demand is driven by established local flexibility market pilots run by distribution system operators navigating post-net-zero grid congestion challenges. Regulatory influence from Ofgem's flexibility market design guidance is notable, and technology adoption favors platforms with proven local flexibility market participation, given the concentration of active DSO-led programs.
Germany Flexibility Platform Market
According to our analysis, Germany's market reached close to USD 0.47 billion in 2025 and is expected to hit USD 2.84 billion by 2035, growing at a 19.8% CAGR. Demand is supported by Germany's large renewable generation base and expanding battery storage fleet, led by domestic aggregators such as Next Kraftwerke. Regulatory influence is well established under national balancing market rules, technology penetration is advanced, and competitive intensity remains high among long-standing domestic aggregators.
France Flexibility Platform Market
Based on our estimates, France's market reached approximately USD 0.29 billion in 2025, projected to climb to USD 1.71 billion by 2035 at a 19.5% CAGR. Demand is supported by France's prominent residential demand response and EV smart-charging programs, led by domestic aggregators such as Voltalis, which shape household flexibility adoption. Regulatory influence from national grid balancing rules is notable, and competitive intensity remains high given the concentration of established domestic aggregators.
China Flexibility Platform Market
The market in China stood at roughly USD 0.40 billion in 2025 and is forecast to reach USD 4.54 billion by 2035, registering a 27.6% CAGR. Demand is fueled by rapid renewable capacity additions and a dense base of regional grid operators requiring balancing services. Regulatory influence is increasing gradually, technology penetration is accelerating through utility-led pilot deployments, and competitive intensity remains elevated among numerous China-based platform vendors.
India Flexibility Platform Market
As per our estimate, India's market was valued at about USD 0.21 billion in 2025, projected to reach USD 3.44 billion by 2035 at a 32.2% CAGR, the fastest among covered countries. Demand structure reflects rising renewable integration needs and expanding organized demand response programs under the Ministry of Power's regulatory guidance. Regulatory influence remains developing, while technology penetration is rising quickly as utilities localize flexibility platform sourcing to serve India's growing electricity demand.
Japan Flexibility Platform Market
According to our analysis, Japan's market reached close to USD 0.19 billion in 2025 and is expected to hit USD 1.72 billion by 2035, growing at a 25.0% CAGR. Demand is supported by Japan's post-liberalization electricity market structure and expanding renewable curtailment management needs. Regulatory influence is well established, technology penetration is advanced among domestic utilities, and competitive intensity remains high among long-standing regional aggregators.
South Korea Flexibility Platform Market
Based on our estimates, South Korea's market stood at approximately USD 0.13 billion in 2025, forecast to reach USD 1.56 billion by 2035 at a 28.0% CAGR. Demand structure benefits from the country's aggressive renewable expansion targets and growing EV charging infrastructure rollout. Technology penetration is high, with domestic utilities piloting AI-driven dispatch platforms, and competitive intensity remains pronounced amid rapid platform innovation cycles.
Australia Flexibility Platform Market
The flexibility platform market in Australia reached about USD 0.11 billion in 2025 and is projected to reach USD 1.10 billion by 2035, expanding at a 26.3% CAGR. Demand is supported by the Australian Energy Market Operator's wholesale demand response mechanism and growing rooftop solar and battery penetration. Regulatory influence stems from AEMO's market rules, while technology adoption favors platforms supporting residential virtual power plant aggregation amid rising competitive intensity.
UAE Flexibility Platform Market
As per our estimate, the UAE market was valued near USD 0.12 billion in 2025, projected to reach USD 1.04 billion by 2035 at a 24.7% CAGR. Demand structure is shaped by the UAE's role as a regional grid-modernization and clean energy investment hub. Regulatory influence remains moderate, technology penetration is improving through imported flexibility platforms, and competitive intensity is rising as utilities expand distributed energy resource programs to serve Gulf markets.
Saudi Arabia Flexibility Platform Market
According to our analysis, Saudi Arabia's market reached roughly USD 0.13 billion in 2025 and is expected to hit USD 1.42 billion by 2035, growing at a 26.6% CAGR. Demand is driven by Vision 2030-linked grid diversification investment and rising renewable capacity additions requiring balancing services. Regulatory influence is developing under national grid-code guidelines, and technology penetration is advancing as domestic utilities scale platform deployments.
South Africa Flexibility Platform Market
Based on our estimates, South Africa's market stood at about USD 0.07 billion in 2025, forecast to reach USD 0.62 billion by 2035 at a 24.8% CAGR. Demand structure reflects a developing grid-modernization program addressing chronic supply constraints across the national utility network. Regulatory influence remains moderate, technology penetration is gradually improving, and competitive intensity is limited given reliance on imported platform components from Europe and North America.
Brazil Flexibility Platform Market
The market in Brazil reached approximately USD 0.17 billion in 2025 and is projected to reach USD 1.46 billion by 2035, registering a 24.3% CAGR. Demand is underpinned by Brazil's large distributed generation base and expanding organized retail electricity market. Regulatory influence stems from national grid modernization initiatives, technology penetration favors demand response platforms, and competitive intensity remains moderate among regional utility integrators.
Argentina Flexibility Platform Market
As per our estimate, Argentina's market was valued near USD 0.07 billion in 2025, projected to reach USD 0.63 billion by 2035 at a 25.5% CAGR. Demand structure is supported by steady distributed generation and demand response adoption despite macroeconomic volatility. Regulatory influence remains limited, technology penetration is modest, and competitive intensity is centered on a small number of regional distributors serving domestic utilities.
Competitive Landscape
We observed that the flexibility platform market features a moderately consolidated competitive landscape, with global energy-technology platforms competing alongside specialized regional aggregators on orchestration breadth, market access, and pricing innovation.
Key Takeaways
|
Dimension |
Description |
|
Market Structure |
Moderately consolidated; the top companies profiled in this report collectively account for a majority of global flexibility platform market revenue, while numerous regional European and North American aggregators serve local flexibility market demand. |
|
Innovation Focus |
AI-driven forecasting and dispatch, multi-resource orchestration across batteries, EVs, and industrial loads, and direct OEM API integration dominate current innovation pipelines across leading platform providers. |
|
M&A Activity |
Selective consolidation through platform and capability acquisitions, exemplified by Kaluza's acquisition of Australian energy software specialist Beige Technologies to broaden its distributed energy resource optimization portfolio. |
How Do Companies Compete in the Flexibility Platform Market?
Companies compete primarily on multi-resource orchestration breadth, market-access certification, and AI-driven forecasting accuracy across the industry. Global players such as Kraken Technologies and Kaluza leverage broad platform integrations and utility partnerships to serve multinational energy retailers, while regional European aggregators compete on local flexibility market expertise and rapid certification turnaround for smaller distribution system operators.
Which Competitive Archetypes Dominate the Flexibility Platform Market?
Two archetypes dominate the market: diversified global energy-technology platforms offering full-stack orchestration and utility integration, and specialized regional aggregators focused on local flexibility market participation. Kraken Technologies and Kaluza exemplify the diversified archetype through multi-market utility deployments, while Next Kraftwerke and Voltalis exemplify the regional specialization archetype serving European aggregation demand.
How Are Companies Differentiating Through Innovation in Flexibility Platforms?
Innovation and differentiation strategy increasingly center on AI-driven dispatch accuracy and direct OEM integration. Kraken Technologies' Schneider Electric partnership and Kaluza's BMW Group API integration both replace generic hardware-dependent charging with software-native coordination. Our analysis shows that suppliers unable to demonstrate credible multi-resource orchestration risk exclusion from utility request-for-proposal shortlists across North America and Europe.
What M&A and Expansion Activity Is Shaping the Flexibility Platform Market?
Mergers, acquisitions, and geographic expansion continue to consolidate orchestration capabilities within the industry. Kaluza's acquisition of Beige Technologies broadened its Asia-Pacific distributed energy resource capability, while Kaluza's joint venture with Mitsubishi Corporation in Japan illustrates how diversified platform groups pursue geographic expansion and utility-partnership leverage across global electricity markets.
Key Market Players
Our assessment indicates that the following 20 companies are actively shaping platform innovation, market-access certification, and orchestration capability within the global flexibility platform market.
-
Kraken Technologies Limited
-
Enel X S.r.l.
-
EnergyHub, Inc.
-
Voltalis S.A.
-
Next Kraftwerke GmbH
-
Sympower B.V.
-
GridBeyond Limited
-
The Mobility House GmbH
-
Kaluza Limited
-
ev.energy Ltd.
-
Piclo Ltd
-
NODES AS
-
Flexitricity Limited
-
Flower Infrastructure Technologies AB
-
terralayr AG
-
gridX GmbH
-
Nuvve Holding Corp.
-
Ohme Operations UK Ltd
-
Axle Energy Limited
-
Virtual Peaker, Inc.
Latest Developments
We found that recent developments within the flexibility platform market are concentrated on AI-driven orchestration partnerships and multi-market utility licensing, reflecting the industry's broader scaling transition.
|
Date |
Event |
|
June 2026 |
Kraken Technologies (Octopus Energy Group) and Schneider Electric announced a strategic partnership combining AI-powered flexibility orchestration with real-time grid-visibility technology to accelerate data center and industrial grid connections. |
|
November 2025 |
Kaluza and BMW Group launched a direct API integration enabling fully automated vehicle-to-grid smart charging for BMW and MINI drivers in the UK without additional hardware. |
Expert Insights
 “Responding to changing customer demands, managing energy volatility and innovating at pace are critical challenges for today’s energy companies. Kaluza is empowering retailers to thrive in the face of this new complexity with our sophisticated and flexible platform that drives progress towards a digitised, decarbonised future.”
— Melissa Gander, CEO, Kaluza
Statement made in May 2024 upon her appointment as CEO during Kaluza's global expansion.
Market Interpretation
The comment highlights how digital flexibility platforms are becoming essential infrastructure for modern energy retailers. Increasing electrification, distributed energy resources, EV charging, and renewable integration are driving utilities toward AI-enabled flexibility platforms capable of optimizing demand response, customer engagement, and grid balancing. Consequently, software-driven flexibility management is becoming a strategic investment area across global electricity markets.
Investment Opportunities
What Capital Inflows Are Targeting the Flexibility Platform Market?
Capital inflows into the flexibility platform market are increasingly directed toward AI-driven forecasting engines and multi-market licensing expansion. Strategic energy groups and utility investors continue to fund platform consolidation, as seen in AGL Energy's investment in Kaluza. We observed that investors favor platform providers demonstrating validated multi-resource orchestration, viewing wholesale market-access certification as a proxy for long-term utility contract retention.
How Is Infrastructure Investment Supporting Flexibility Platform Scaling?
Infrastructure investment is expanding cloud compute and data-integration capacity to support real-time dispatch across growing distributed energy resource fleets. Our findings suggest that platform providers are investing in edge-computing and API infrastructure to improve dispatch latency across battery, EV, and industrial load categories, supporting the precision required for wholesale and ancillary service market participation.
What ESG Considerations Are Shaping Flexibility Platform Investment Decisions?
Environmental, social, and governance considerations are central to investment decisions across the industry, with grid decarbonization impact and demand-side emissions reduction as key criteria. The International Energy Agency's electricity market data continues to inform utility sustainability disclosures. We found that investors increasingly favor platform providers with measurable grid-balancing and renewable-integration impact, treating it as a governance indicator alongside data security and market-access compliance.
Key Benefits for Stakeholders
How Does This Report Benefit Enterprise and Industry Leaders?
Enterprise and industry leaders gain access to validated segmentation, competitive benchmarking, and regional demand forecasts that support platform sourcing and portfolio decisions across the flexibility platform industry. Our analysis shows that detailed platform function, commercial model, and deployment model breakdowns help procurement teams align specifications with market-access and regulatory requirements while identifying underserved segments for portfolio expansion.
How Does This Report Benefit Investors and Financial Analysts?
Investors and financial analysts benefit from consistent, single-point market size and CAGR estimates that support valuation and capital-allocation decisions across the flexibility platform market supply chain. We observed that the report's regional and segment-level growth differentials help identify which platform providers and aggregators are best positioned to capture above-market growth in data center and BESS-linked categories through 2035.
How Does This Report Benefit Technology Vendors and Product Teams?
Technology vendors and product teams gain insight into emerging platform requirements, including AI-driven dispatch, direct OEM integration, and performance-fee commercial models, that are reshaping the industry. Our findings suggest that this analysis helps product teams prioritize development roadmaps around multi-resource orchestration and market-access certification increasingly required by utility request-for-proposal processes.
Key Market Segments
By System Operators
-
DSO flexibility procurement
-
TSO balancing and reserves
-
Local constraint markets
-
Congestion management
-
Other System Operator Flexibility
By Energy Retailers and Utilities
-
Residential DR and VPP programs
-
C&I demand response programs
-
EV and V2G programs
-
Customer engagement platforms
-
Other Utility Led Flexibility
By Independent Aggregators
-
Third-party asset aggregation
-
Wholesale trading
-
Ancillary services access
-
Local flexibility markets
-
Other Aggregator Driven Flexibility
By Asset Owners and IPPs
-
BESS commercialization
-
Renewable optimization
-
Hybrid asset optimization
-
Route to market
-
Other Asset Owner Monetization
By C&I End Users
-
Industrial load flexibility
-
Commercial building DR
-
Data center flexibility
-
Process load optimization
-
Other Site Level Flexibility
By Mobility Operators and OEMs
-
Fleet and depot charging
-
OEM EV programs
-
V2G and V2X aggregation
-
Charging networks
-
Other Mobility Sector Flexibility
By Community and Microgrids
-
Community flexibility
-
Microgrid platforms
-
Campus and municipal
-
Other Non-Standard Flexibility Buyers
By Flexible Resource
-
Load
-
EV and Charging
-
Battery Energy Storage
-
Distributed Generation
-
Mixed DER
-
Other Flexible Resource
By Platform Function
-
Enrollment and Engagement
-
Forecasting and Optimization
-
Dispatch and Control
-
Trading and Market Access
-
Measurement and Settlement
-
Other Platform Function
By Commercial Model
-
SaaS
-
Managed Service
-
Performance Fee
-
Transaction Fee
-
Integration Services
-
Other Commercial Model
By Deployment Model
-
Cloud
-
On Premises
-
Hybrid
-
Other Deployment
By Region
-
North America: U.S., Canada, Mexico
-
Europe: UK, Germany, France, Italy, Spain, Sweden, Denmark, Finland, Netherlands, Rest of Europe
-
Asia-Pacific: China, India, Japan, South Korea, Taiwan, Indonesia, Vietnam, Australia, Philippines, Malaysia, Rest of APAC
-
Middle East & Africa: Saudi Arabia, UAE, Egypt, Israel, Turkey, Nigeria, South Africa, Rest of MEA
-
Latin America: Brazil, Argentina, Chile, Colombia, Rest of LATAM
Conclusion and Recommendations
What Is the Long-Term Outlook for the Flexibility Platform Market?
The long-term outlook for the market remains positive, with global revenue projected to grow nearly eightfold from USD 6.0 billion in 2025 to USD 47.4 billion by 2035 at a 22.9% CAGR. We observed that sustained data center load growth, battery storage commercialization, and wholesale market-access reform will continue underpinning demand across utility, aggregator, and mobility flexibility applications through the forecast period.
What Strategic Positioning Should Flexibility Platform Suppliers Pursue?
Suppliers should prioritize multi-resource orchestration and AI-driven forecasting capability while pursuing direct OEM and grid-technology partnerships to secure long-term utility contracts. Our assessment indicates that providers investing early in wholesale market-access certification and performance-fee commercial models will be best positioned to capture premium pricing within the flexibility platform market.
How Attractive Is the Flexibility Platform Market for New Investment?
The flexibility platform industry presents an attractive investment case, supported by a USD 40.0 billion absolute dollar opportunity between 2026 and 2035 and above-average growth in Asia-Pacific and data center flexibility categories. We found that investment attractiveness is highest for platform providers combining wholesale market-access credentials with scaled multi-resource orchestration capacity.
What Market Shifts and Key Risks Should Stakeholders Monitor?
Stakeholders should monitor grid interconnection queue congestion, fragmented cross-jurisdiction market rules, and competitive pressure from vertically integrated utility in-house platforms as key risks to the flexibility platform market. Our analysis shows that suppliers unable to adapt to evolving market certification requirements risk losing utility contracts to competitors with proven multi-market deployment credentials.
What Are the Key Growth Pathways for the Flexibility Platform Market?
Key growth pathways include expanding data center and industrial load flexibility portfolios, scaling performance-fee commercial models, and deepening penetration into vehicle-to-grid mobility applications. Next Move Strategy Consulting's analysis indicates that suppliers pursuing these pathways while maintaining cost competitiveness in standard demand response categories will be best positioned to capture the flexibility platform market's projected growth through 2035.
About the Author
 Liza Phukan
— Liza Phukan is Research Associate at Next Move Strategy Consulting, where she has covered emerging industries and market research across sectors for 3.5 years. Her work includes analyzing industry developments, validating market data, and developing structured business content from research findings. She uses secondary research and data-validation practices to turn complex market information into clear decision-useful market analysis for business audiences and support report development and B2B.
Liza Phukan
— Liza Phukan is Research Associate at Next Move Strategy Consulting, where she has covered emerging industries and market research across sectors for 3.5 years. Her work includes analyzing industry developments, validating market data, and developing structured business content from research findings. She uses secondary research and data-validation practices to turn complex market information into clear decision-useful market analysis for business audiences and support report development and B2B.
About the Reviewer
 Supradip Baul
— Supradip Baul is an accomplished business consultant and strategist with over a decade of rich experience in market intelligence, strategy, technology, and business transformation. His work has included rigorous qualitative and quantitative analysis across multiple industries, helping clients shape investment decisions and long-term roadmaps. Earlier in his career, he was associated with Gartner, where he contributed to industry-leading reports and market share analyses. He has worked with leading global companies and holds an MBA with a dual specialization in Marketing and Finance.
Supradip Baul
— Supradip Baul is an accomplished business consultant and strategist with over a decade of rich experience in market intelligence, strategy, technology, and business transformation. His work has included rigorous qualitative and quantitative analysis across multiple industries, helping clients shape investment decisions and long-term roadmaps. Earlier in his career, he was associated with Gartner, where he contributed to industry-leading reports and market share analyses. He has worked with leading global companies and holds an MBA with a dual specialization in Marketing and Finance.
At Next Move Strategy Consulting, we understand that insightful market research is the cornerstone of successful business decisions. That's why we employ a robust and multifaceted approach, combining various methodologies to deliver the most accurate and actionable data for our clients.

Research Landscape
We navigate the world of research with two primary approaches:
Qualitative Approach
Our qualitative research methodologies involve immersive techniques such as in-depth interviews, focus groups, and observational studies. By engaging directly with individuals and stakeholders, we uncover valuable insights that quantitative data alone may overlook.

Quantitative Research
In tandem with qualitative methodologies, NMSC leverages the power of Quantitative Research to provide a robust foundation of numerical insights. Through systematic data collection and analysis, we quantify patterns, preferences, and market trends, offering a comprehensive view of the business landscape.
Our quantitative research approach employs diverse tools, including surveys, experiments, and statistical modelling. These methodologies enable us to gather data from a large and representative sample, ensuring the statistical significance of our findings. By employing structured questionnaires and standardized data collection methods, we guarantee the reliability and validity of the information we present to our clients.
Quantitative research is particularly effective in measuring the prevalence of trends, assessing market size, and gauging the impact of various factors on consumer behavior. The numerical precision attained through this approach equips our clients with actionable insights, facilitating data-driven decision-making and strategy formulation.


Our Specialized Toolbox for Industry-Specific Market Research
We deploy a specialized arsenal of techniques tailored to meet your unique requirements. Here's a glimpse into our comprehensive toolbox:

Information Procurement
The stage entails acquiring market data or relevant information through various sources and methodologies.


Market Research Approach
We utilize both top-down and bottom-up approaches in market research analysis to achieve a comprehensive understanding of the market dynamics, leveraging the broad perspective of industry trends and macroeconomic factors alongside detailed insights from specific segments and individual companies.

Porters Five Forces Analysis
We conduct Porter's Five Forces analysis to evaluate the competitive landscape of an industry, providing us with insights into factors that affect profitability and strategic positioning.

SWOT Analysis

Forecasting
We utilize a forecasting model to predict future consumption by considering parameters like population, economics, regulations, market competition, drivers, constraints, technology, and pricing. We also employ statistical techniques such as multilinear regression, exponential smoothing, moving average, ARIMA, and Monte Carlo simulations for accurate predictions. In econometric forecasting, we analyzed short-term and long-term event impacts, attributing values based on regulatory frameworks, economic factors, and market events.





 Speak to Our Analyst