Market")
India Air Handling Unit (AHU) Market Size, Share, and Trends Analysis Report By Component (Coils, Filters, Blowers and Fans, Humidifiers), By Product Type (Packaged, Modular, Custom), By Installation (Rooftop, Indoor), By Capacity, By Technology (Single Flux, Double Flux, Smart AHUs), By Application (Residential, Commercial, Industrial), By Buyer Type (Building Owners, EPC Contractors), By Sales Channel (Direct Sales, Distributor Sales) – Report Analysis and Forecast, 2026–2035
Industry: Construction & Manufacturing | Lastest Edition: July 15, 2026 | No of Pages: 175 | No. of Tables: 62 | No. of Figures: 54 | Format: PDF | Report Code : CM1645
What Is the India Air Handling Unit (AHU) Market Size?
The India Air Handling Unit (AHU) Market size was valued at USD 986 Million in 2025 and is estimated at USD 1,228 Million in 2026, forecast to reach USD 2,944.6 Million by 2035, expanding at a 10.21% CAGR between 2026 and 2035. We observed that indoor installation dominates all other components with approximately a 67.2% share.
We observed that growth is broad-based across every segmentation axis, with modular architecture adoption and industrial capacity expansion driving the dominant structural shifts through 2035.
|
Key Takeaways |
|
By Component: Coils held the largest share of approximately 27% (USD 271.24 Million) in 2025; Filters is the fastest-growing sub-segment at 13.05% CAGR from 2026–2035. |
|
By Product Type: Modular AHUs held the largest share of approximately 39% (USD 387.15 Million) in 2025; Modular AHUs is also the fastest-growing sub-segment at 11.61% CAGR from 2026–2035. |
|
By Installation: Indoor held the largest share of approximately 67% (USD 662.84 Million) in 2025; Rooftop is the fastest-growing sub-segment at 11.13% CAGR from 2026–2035. |
|
By Capacity: ≥ 50,001 m³/h held the largest share of approximately 34% (USD 332.34 Million) in 2025; ≥ 50,001 m³/h is also the fastest-growing sub-segment at 11.39% CAGR from 2026–2035. |
|
By Technology: Single Flux held the largest share of approximately 44% (USD 431.58 Million) in 2025; Smart AHUs is the fastest-growing sub-segment at 11.98% CAGR from 2026–2035. |
|
By Application: Commercial held the largest share of approximately 56% (USD 553.88 Million) in 2025; Industrial is the fastest-growing sub-segment at 11.93% CAGR from 2026–2035. |
|
By Buyer Type: Industrial Operators held the largest share of approximately 23% (USD 222.43 Million) in 2025; Industrial Operators is also the fastest-growing sub-segment at 13.42% CAGR from 2026–2035. |
|
By Sales Channel: Distributor Sales held the largest share of approximately 31% (USD 302.90 Million) in 2025; OEM Partnerships is the fastest-growing sub-segment at 12.00% CAGR from 2026–2035. |
Market Opportunity: The India Air Handling Unit (AHU) market is expected to create an absolute dollar opportunity of USD 1,716.6 million between 2026 and 2035, presenting significant investment potential across the commercial construction and industrial capacity expansion value chain.
According to NMSC analysis, EPC contractors and industrial operators are increasingly specifying modular, sensor-enabled AHU platforms at the design stage rather than retrofitting them later, a shift that favours manufacturers with strong project-engineering capabilities over pure equipment suppliers as commercial and industrial construction activity accelerates through 2035.
What Does the India Air Handling Unit (AHU) Market Encompass?
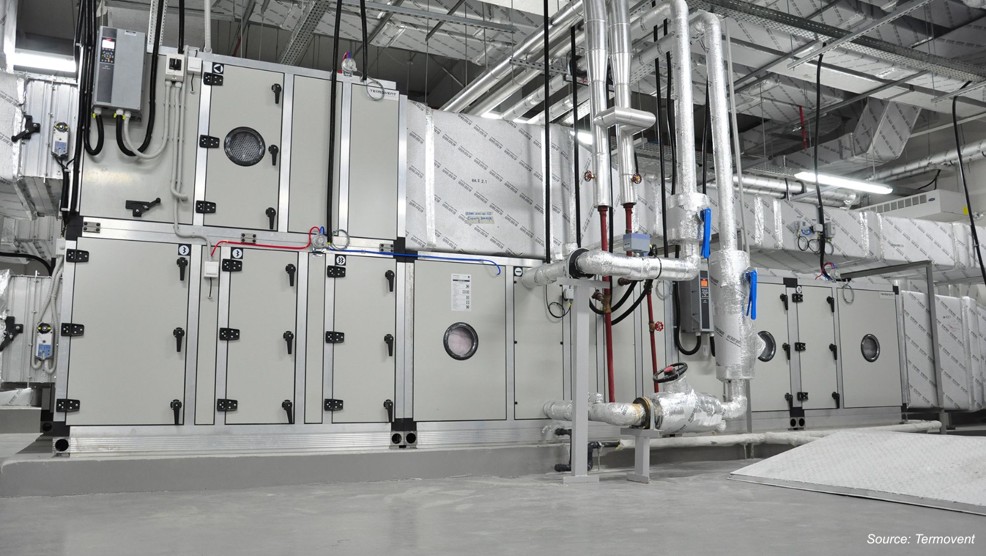
The India AHU Market encompasses equipment that conditions, filters, and circulates air within residential, commercial, and industrial buildings, integrating coils, filters, blowers, humidifiers, and control components into a single ducted system. Our assessment indicates that the scope spans packaged, modular, and custom AHU architectures supplied to building owners, developers, EPC contractors, and industrial operators across offices, malls, hotels, airports, healthcare facilities, data centers, and food and beverage plants nationwide.
The Bureau of Energy Efficiency's star-labeling and Eco Niwas Samhita building energy codes increasingly shape AHU motor and heat-recovery specifications, while the Central Public Works Department's mechanical, electrical, and plumbing guidelines influence institutional and government procurement. We observed that technology adoption is shifting toward sensor-enabled smart AHUs with variable frequency drives, replacing constant-speed single flux units. NMSC's analysis indicates that this structural shift, combined with rising demand for energy-efficient India HVAC systems, is redefining sourcing criteria across the AHU market.
|
Parameter |
Details |
|
Market Size in 2025 |
USD 986 Million |
|
Market Size in 2026 |
USD 1,228 Million |
|
Revenue Forecast in 2035 |
USD 2,944.6 Million |
|
Growth Rate |
CAGR of 10.21% from 2026 to 2035 |
|
Market Volume in 2025 |
89 thousand units |
|
Market Volume in 2026 |
113 thousand units |
|
Market Volume in 2035 |
319 thousand units |
|
Growth Rate (Volume) |
CAGR of 12.19% from 2026 to 2035 |
|
Analysis Period |
2025–2035 |
|
Base Year Considered |
2025 |
|
Forecast Period |
2026–2035 |
|
Market Size Estimation |
USD Million |
|
Companies Profiled |
20 |
|
Market Share |
Available for Top 10 Companies |
Ecosystem Analysis of the India Air Handling Unit (AHU) Industry
 MARKET")
The above infographic presents the ecosystem analysis of the India AHU Market, where energy-efficient designs and IoT integration are driving innovation across the value chain. These advancements are supported by robust supplier networks and automated manufacturing, which together ensure consistent product quality and production scalability. At the same time, compliance with energy and safety standards strengthens market credibility, while efficient logistics and strategic partnerships enable widespread supply to critical sectors like healthcare, IT, hospitality, and industrial infrastructure. Looking ahead, we observed that the growing role of smart monitoring and data-driven solutions will continue to shape the market's evolution across the country.
Key Emerging Trends
Based on research conducted by NMSC, we found that four structural trends are reshaping product design, sourcing, and stakeholder engagement across the India Air Handling Unit (AHU) market.
How Are Smart AHUs Transforming Building Energy Management?
Sensor-enabled Smart AHUs with variable frequency drives and building-management-system integration are replacing constant-speed single-flux units across new commercial construction. We observed that developers of large office campuses and IT parks increasingly specify demand-controlled ventilation to cut energy consumption. Blue Star Limited's expanded Sri City manufacturing capacity, commissioned in 2025, illustrates how domestic manufacturers are scaling production to meet this shift toward controls-integrated, energy-efficient commercial air handling equipment.
Why Is Modular AHU Adoption Accelerating Among EPC Contractors?
Modular AHU architectures, assembled from standardized panel sections, are gaining share as EPC contractors seek faster on-site installation and easier capacity scaling. We observed that this configuration reduces commissioning timelines on large hospital, airport, and industrial projects where construction schedules are compressed. Manufacturers such as Systemair India and TROX India are expanding modular product lines, positioning this format as the preferred choice for developers managing multi-building commercial and institutional portfolios nationwide.
How Is Healthcare Demand Reshaping AHU Filtration Requirements?
Hospitals and diagnostic centers are specifying higher-grade filtration and humidity control within AHUs to meet infection-control protocols established after recent public health investments. Our findings suggest that healthcare capital expenditure under the Ayushman Bharat infrastructure mission is expanding demand for HEPA-integrated custom AHUs in operating theatres and intensive care units. This trend is elevating the role of filters as a distinct, higher-margin component category within the broader market segmentation structure.
What Role Does Industrial Capacity Expansion Play in AHU Demand?
Expanding pharmaceutical, food and beverage, and electronics manufacturing capacity is driving demand for high-capacity AHUs above 50,001 m³/h. Our analysis shows that industrial operators are prioritizing rooftop-mounted units to conserve floor space in new manufacturing facilities. Companies such as FläktGroup India and ZECO Aircon Limited are scaling industrial-grade product lines, reflecting how production-linked incentive-driven manufacturing growth is reshaping demand across the industrial application segment.
Growth Drivers and Restraints
Growth Catalyst and Risk Assessment Matrix
|
Factors |
Type |
(+/−) % Impact on CAGR |
Geographic Relevance |
Impact Timeline |
|
Expansion of commercial office and IT park construction |
Driver |
+2.3% |
Western India, Southern India |
2026-2035 |
|
Healthcare infrastructure investment under national health missions |
Driver |
+1.7% |
National |
2026-2035 |
|
Energy-efficiency mandates under Bureau of Energy Efficiency codes |
Driver |
+1.5% |
National |
2026-2035 |
|
Growth of data center and industrial manufacturing capacity |
Driver |
+1.9% |
Southern India, Western India |
2026-2035 |
|
Rising adoption of smart, IoT-enabled building controls |
Driver |
+1.2% |
National |
2026-2032 |
|
Airport and hospitality sector capacity expansion |
Driver |
+0.9% |
National |
2026-2035 |
|
Volatility in steel and copper input costs |
Restraint |
-1.1% |
National |
2026-2035 |
|
Fragmented unorganized manufacturing competing on price |
Restraint |
-0.8% |
National |
2026-2032 |
|
Extended project approval and commissioning timelines |
Restraint |
-0.6% |
National |
2028-2035 |
What Is the Primary Growth Driver of the India AHU Market?
Expansion of commercial office and IT park construction is the primary driver of the market. The Ministry of Housing and Urban Affairs continues to report sustained growth in organized commercial floor space delivery across metro and Tier-1 cities. We observed that this construction pipeline, reinforced by rising occupier demand for certified green buildings, continues to anchor baseline consumption of packaged and modular AHUs across developed commercial corridors.
How Is Energy Efficiency Regulation Driving India AHU Market Growth?
Bureau of Energy Efficiency star-labeling requirements and the Eco Niwas Samhita building energy code are accelerating adoption of variable-frequency-drive and heat-recovery AHU configurations. India's Ministry of Power continues to expand mandatory energy-performance disclosure for large commercial buildings. Our assessment indicates that this regulatory pressure, combined with green-building certification demand, is compressing adoption timelines for smart AHUs across new commercial real estate developments in Western and Southern India.
What is Restraining in the India AHU Market Expansion?
Volatility in steel and copper input costs, tied to global commodity price cycles, restrains margin stability across AHU manufacturers. The Ministry of Commerce and Industry tracks recurring metal price fluctuations that compress fabrication margins and delay capital investment in new tooling. We found that smaller regional manufacturers face particular exposure, as limited scale reduces their ability to hedge raw-material procurement compared with larger, vertically integrated groups.
Segmentation Analysis
Segment Sizing: By Component
|
Segment |
2025 (USD Million) |
2035 (USD Million) |
CAGR% (2026-2035) |
|
Coils |
271.24 |
850.11 |
10.74% |
|
Filters |
184.46 |
713.22 |
13.05% |
|
Blowers and Fans |
236.80 |
613.79 |
8.64% |
|
Humidifiers |
92.75 |
267.24 |
9.81% |
|
Other Components |
200.75 |
500.25 |
8.21% |
Which Component Segment Dominates the India AHU Market?
Coils led the market with USD 271.24 Million in 2025, supported by their function as the core heat-exchange element required in nearly every AHU configuration. We observed that Filters is the fastest-growing component, expanding at a 13.05% CAGR from 2026 to 2035, as healthcare and industrial applications increasingly specify HEPA and high-efficiency filtration to meet stricter indoor air quality and ventilation system standards.
Segment Sizing: By Product Type
|
Segment |
2025 (USD Million) |
2035 (USD Million) |
CAGR% (2026-2035) |
|
Packaged AHUs |
242.10 |
582.89 |
7.83% |
|
Modular AHUs |
387.15 |
1,313.04 |
11.61% |
|
Custom AHUs |
356.76 |
1,048.68 |
10.03% |
Which Product Type Segment Leads the India AHU Market?
 Industry, By Product Type, 2025")
Modular AHUs led the market with USD 387.15 Million in 2025, supported by their faster on-site assembly and adaptability across commercial and institutional projects. Modular AHUs are also the fastest-growing product type, expanding at an 11.61% CAGR from 2026 to 2035, as EPC contractors increasingly favor standardized, factory-tested modules to compress installation timelines on large-scale hospital, airport, and office developments nationwide.
Segment Sizing: By Application
|
Segment |
2025 (USD Million) |
2035 (USD Million) |
CAGR% (2026-2035) |
|
Residential |
105.87 |
269.81 |
8.46% |
|
Commercial |
553.88 |
1,535.76 |
9.39% |
|
Industrial |
326.27 |
1,139.04 |
11.93% |
Which Application Segment Leads India AHU Market Demand?
Commercial applications remained the leading segment, valued at USD 553.88 Million in 2025 on sustained office, mall, hotel, and airport construction. Our findings suggest that Industrial is the fastest-growing application, registering an 11.93% CAGR from 2026 to 2035, as pharmaceutical, electronics, and industrial HVAC installations expand to support new manufacturing capacity across food and beverage and data center facilities.
 Industry, By Application, 2025")
Growth Opportunities
We found that three forward-looking whitespace opportunities stand out for stakeholders' positioning within the India AHU Market over the coming decade.
How Can Manufacturers Capture Demand from Healthcare Infrastructure Expansion?
Expanding hospital and diagnostic-center capacity under national health infrastructure missions creates a mechanism for AHU manufacturers to secure long-term supply contracts with healthcare developers. Custom, HEPA-integrated AHU suppliers stand to benefit most, as infection-control specifications favor higher-margin, application-engineered units over standard packaged configurations.
What Opportunity Does Data Center Growth Present for AHU Suppliers?
Rising data center cooling requirements create a mechanism for suppliers of precision, high-capacity AHUs to enter a fast-growing, technically demanding buyer segment. Industrial operators and data center developers stand to benefit from partnerships offering integrated humidity and particulate control engineered for server-room reliability.
How Can Smart AHU Retrofits Unlock Existing Building Stock in the India AHU Market?
A large installed base of aging constant-speed AHUs in existing commercial buildings creates a mechanism for suppliers to offer sensor-enabled retrofit packages that cut energy costs without full replacement. Building owners and facility-management firms stand to benefit most, gaining measurable energy savings that support green-building recertification goals.
Regulatory Framework Impacting the India Air Handling Unit (AHU) Industry
 MARKET")
The above infographic presents a regulatory framework impacting the India AHU Market, beginning with government initiatives such as production-linked incentives and energy efficiency programs that are actively promoting HVAC manufacturing and AHU adoption. Building codes and indoor air quality regulations are further driving system deployment across the country. Looking ahead, we observed that future regulations are increasingly focusing on smarter, energy-efficient AHUs and stricter air quality standards. Standardization through BIS certification and energy compliance reinforces product reliability, while enforcement via inspections and performance monitoring strengthens governance. Finally, import duties and tariffs continue to influence the cost structure of motors, filters, and control components across the market.
Competitive Landscape
We observed that the India AHU Market features a moderately fragmented competitive landscape, with established multinational HVAC groups competing alongside specialized domestic manufacturers on engineering capability, certification, and regional service reach.
|
Dimension |
Description |
|
Market Structure |
Moderately fragmented, leading multinational and domestic manufacturers profiled in this report collectively account for a significant share of branded India AHU Market revenue, while numerous regional fabricators serve cost-sensitive packaged AHU demand. |
|
Innovation Focus |
Sensor-enabled smart controls, modular architecture, and heat-recovery efficiency dominate current innovation pipelines across leading suppliers. |
|
M&A Activity |
Selective capacity and technology consolidation, exemplified by Systemair's acquisition of Chennai-based industrial fan manufacturer NADI Airtechnics to broaden its India component portfolio. |
 Industry, 2025")
How Do Companies Compete in the India AHU Market?
Companies compete primarily on certification credentials, engineering customization, and manufacturing scale across the industry. Global players such as Daikin Airconditioning India and Johnson Controls India leverage broad product portfolios and project-engineering capability to serve multinational developers, while regional fabricators compete on cost efficiency and rapid turnaround for standard packaged AHU formats supplied to smaller building owners and mechanical contractors.
Which Competitive Archetypes Dominate the India AHU Industry?
Two archetypes dominate the India AHU Market, as diversified multinational HVAC groups offering full-service design, certification, and after-sales support, and specialized domestic manufacturers focused on cost-competitive packaged and custom units. Blue Star Ltd. and Trane Technologies India exemplify the diversified archetype through integrated manufacturing and engineering services, while regional players such as Edgetech Air Systems and Advantek Air Systems exemplify the specialized domestic archetype serving regional project demand.
How Are Companies Differentiating Through Innovation in AHUs?
Innovation and differentiation strategy increasingly center on sensor integration and energy-recovery engineering. Systemair India's expanded Hyderabad manufacturing facility and TROX India's hygienic AHU certifications both reflect efforts to secure differentiated positioning in healthcare and data center applications. Our analysis shows that suppliers unable to demonstrate energy-efficiency credentials risk exclusion from developer and EPC contractor shortlists on certified green-building projects.
What M&A and Expansion Activity Is Shaping the India AHU Market?
Mergers, acquisitions, and capacity expansion continue to reshape manufacturing capability within the industry. Systemair's completed acquisition of NADI Airtechnics broadened its Indian industrial fan and component portfolio, while Daikin Airconditioning India's continued investment in domestic research and manufacturing infrastructure illustrates how multinational groups pursue localization and capacity expansion across the Indian HVAC and air handling value chain.
Key Market Players
Our assessment indicates that the following 20 companies are actively shaping product innovation, capacity expansion, and engineering capability within the India AHU Market.
-
Blue Star Ltd.
-
Daikin Airconditioning India Pvt Ltd.
-
Johnson Controls India Pvt Ltd.
-
Trane Technologies India Pvt Ltd.
-
FläktGroup India Pvt. Ltd.
-
TROX India Pvt Ltd.
-
Edgetech Air Systems Pvt. Ltd.
-
JPC Air Handlers Engineering
-
ZECO Aircon Limited (Munters Group)
-
Euroclima India Pvt. Ltd.
-
Advantek Air Systems Pvt. Ltd.
-
Avantech Aircon Pvt. Ltd.
-
VTS Clima India Pvt. Ltd.
-
Finpower Private Limited
-
Ventilair India Pvt. Ltd.
-
Ravi Aircon Private Limited
-
Climate Grip Pvt. Ltd.
Latest Developments
We found that recent capacity and technology investments within the India AHU and broader HVAC supply chain are concentrated on manufacturing expansion and localized research capability.
|
Date |
Event |
|
May 2026 |
FläktGroup announced Project GAGAN, a manufacturing facility in Pune capable of producing up to 6,500 HVAC units annually, including Air Handling Units (AHUs), Fan Wall Units, CRAH/CRAC units, CDUs, and heating and cooling coils for domestic and export markets. |
|
January 2024 |
Carrier India expanded its Made-in-India HVAC portfolio by adding locally manufactured Air Handling Units (AHUs) and Fan Coil Units (FCUs). |
Expert Insights
 “The impact on human beings, their health, quality of life and safety is incredibly high. Not only related to the buildings where people are present and benefit a lot from good indoor air quality but also to make processes that have significant importance for people such as pharmaceutical production plants or the food industry possible. On the other hand, the impact of HVACR on the world’s energy demand and environmental impact is very high. So the challenge and our responsibility is always to improve the effectiveness and sustainability of solutions but at the same time keep a high level of performance.”
— Martin Lenz, Chairperson, Eurovent Product Group ‘Air Handling Units’ (PG-AHU) & Head of International Business Development, TROX GmbH
Statement made during an interview published by Eurovent discussing the priorities and future direction of the Air Handling Unit industry.
Market Interpretation
The statement underscores the industry's growing focus on balancing indoor environmental quality with energy efficiency. As building owners increasingly prioritize sustainable infrastructure and occupant well-being, demand is shifting toward advanced AHUs featuring high-efficiency fans, intelligent controls, energy recovery technologies, and enhanced filtration systems. This trend is expected to accelerate AHU adoption across commercial buildings, healthcare facilities, data centers, and industrial applications.
Supply Chain Structure of the India AHU Market
 MARKET")
The above infographic presents the supply chain structure of the India air handling unit market, segmented into upstream and downstream activities. Upstream begins with raw materials like galvanized steel, aluminum, fans, filters, and motors, moving into fabrication, coil production, and assembly. Suppliers and utilities support manufacturing, while BIS and energy efficiency compliance ensure quality and safety. Moving downstream, nationwide logistics and dealer networks enable timely delivery to commercial buildings, hospitals, data centers, and industrial facilities. Looking ahead, we observed that aftermarket maintenance and technical support ensure long-term operational reliability across the market.
Investment Opportunities
What Capital Inflows Are Supporting the India AHU Market?
Domestic and multinational manufacturers are directing capital toward manufacturing capacity and research infrastructure across India. Daikin's announced Rs 1,000 crore Haryana research center investment and Blue Star's Rs 400 crore FY26 capital expenditure plan illustrate sustained capital inflows supporting India construction-linked HVAC and air handling capacity.
How Is Infrastructure Investment Shaping AHU Demand?
Government infrastructure spending on airports, healthcare facilities, and industrial corridors continues to expand the addressable base for commercial and industrial AHU installations. Our assessment indicates that public capital expenditure on hospital and airport modernization programs is creating multi-year procurement pipelines for custom and modular AHU suppliers across Tier-1 and Tier-2 cities.
What ESG Considerations Are Influencing AHU Investment Decisions?
Environmental, social, and governance considerations are increasingly influencing capital allocation toward energy-efficient AHU technologies. Bureau of Energy Efficiency disclosure requirements and green-building certification frameworks are encouraging developers to prioritize heat-recovery and variable-frequency-drive AHUs. We observed that investors are favoring manufacturers with documented energy-efficiency credentials as sustainability-linked financing gains traction across Indian commercial real estate in the India AHU Market.
Key Benefits for Stakeholders
How Does This Report Benefit Industry Leaders and Building Developers?
Industry leaders and building developers gain granular segmentation data across component, product type, capacity, and application axes, enabling informed specification decisions for new commercial and industrial projects. Our analysis, data, and forecasts help developers benchmark AHU procurement strategies against verified 2025–2035 market trajectories and evolving energy-efficiency requirements.
How Does This Report Benefit Investors and Financial Analysts in the India AHU Market?
Investors and financial analysts gain a validated 2025 base-year market size, a fundamentals-supported 2026–2035 CAGR, and segment-level growth trajectories that support capital allocation and competitive benchmarking decisions. The report's strategic insights into manufacturer capacity expansion and M&A activity help analysts assess relative positioning across the India AHU value chain.
How Does This Report Benefit Technology Vendors and Product Teams?
Technology vendors and product teams gain visibility into the fastest-growing sub-segments, including Smart AHUs, Filters, and Industrial Operators, informing product roadmap and go-to-market prioritization. The report's segmentation analysis and emerging trends assessment help product teams align feature development with documented buyer and application demand shifts through 2035.
Key Market Segments
By Component
-
Coils
-
Filters
-
Blowers and Fans
-
Humidifiers
-
Other Components
By Product Type
-
Packaged AHUs
-
Modular AHUs
-
Custom AHUs
By Installation
-
Rooftop
-
Indoor
By Capacity
-
≤ 5,000 m³/h
-
5,001–15,000 m³/h
-
15,001–30,000 m³/h
-
30,001–50,000 m³/h
-
≥ 50,001 m³/h
By Technology
-
Single Flux
-
Double Flux
-
Smart AHUs
By Application
-
Residential
-
Commercial
-
Offices
-
Malls
-
Hotels
-
Airports
-
Other Commercial
-
-
Industrial
-
Healthcare
-
Data Centers
-
Food & Beverage
-
Other Industrial
-
By Buyer Type
-
Building Owners
-
Developers
-
EPC Contractors
-
Mechanical Contractors
-
Government and Public Authorities
-
Industrial Operators
By Sales Channel
-
Direct Sales
-
Distributor Sales
-
OEM Partnerships
-
System Integrators
Conclusion and Recommendations
What Is the Long-Term Outlook for the India AHU Market?
The India AHU Market is positioned for sustained double-digit growth through 2035, underpinned by commercial construction, healthcare infrastructure expansion, and industrial capacity investment. We expect Modular AHUs and Smart AHUs to gain structural share as developers prioritize faster installation and measurable energy savings, while Coils and Commercial applications retain their position as the largest revenue contributors across the forecast period.
What Strategic Positioning Should Manufacturers Pursue?
Manufacturers should prioritize sensor-integration capability and modular manufacturing to align with EPC contractor procurement preferences. Our assessment indicates that suppliers investing in domestic research and certification infrastructure, following the pattern established by Daikin and Systemair, are best positioned to capture healthcare, data center, and industrial capacity expansion opportunities through 2035.
How Attractive Is the India AHU Market for Investment?
The market presents an attractive investment case, supported by a validated USD 1,716.6 million absolute dollar opportunity between 2026 and 2035 and a fundamentals-backed 10.21% CAGR. Capital allocation toward manufacturing capacity, as demonstrated by recent multi-hundred-crore investments from leading players, signals sustained investor and manufacturer confidence in the segment's growth trajectory.
What Market Shifts and Key Risks Should Stakeholders Monitor?
Stakeholders should monitor steel and copper input-cost volatility, which restrains margin stability across fabrication-intensive manufacturers. We found that extended project approval and commissioning timelines on large institutional projects also pose a risk to near-term revenue recognition, particularly for custom AHU suppliers dependent on large single-project orders.
What Are the Key Growth Pathways Through 2035?
Key growth pathways in the India AHU Market include expanding healthcare and data center-linked demand, scaling Smart AHU retrofit programs for existing commercial buildings, and deepening EPC contractor partnerships for modular product deployment. Our findings suggest that manufacturers combining energy-efficiency credentials with regional service infrastructure are best positioned to capture a disproportionate share of the market's projected USD 2,944.6 million 2035 revenue base.
 Market Revenue by 2030 (Billion USD)")
 Market Segmentation")
About the Author
 Mayurima Roy is a research analyst delivering data-driven insights that support strategic planning and market understanding. She combines analytical rigor with strong content development skills, translating complex information into clear, actionable narratives for diverse audiences. Her work includes structured research, trend tracking, competitive assessment, and insight-led content creation that supports informed decision-making. Curious and detail-oriented by nature, she continually deepens her understanding of evolving markets while pursuing creative interests such as crafting and video creation.
About the Reviewer
 Supradip Baul is an accomplished business consultant and strategist with over a decade of rich experience in market intelligence, strategy, technology, and business transformation. His work has included rigorous qualitative and quantitative analysis across multiple industries, helping clients shape investment decisions and long-term roadmaps. Earlier in his career, he was associated with Gartner, where he contributed to industry-leading reports and market share analyses. He has worked with leading global companies and holds an MBA with a dual specialization in Marketing and Finance.
At Next Move Strategy Consulting, we understand that insightful market research is the cornerstone of successful business decisions. That's why we employ a robust and multifaceted approach, combining various methodologies to deliver the most accurate and actionable data for our clients.

Research Landscape
We navigate the world of research with two primary approaches:
Qualitative Approach
Our qualitative research methodologies involve immersive techniques such as in-depth interviews, focus groups, and observational studies. By engaging directly with individuals and stakeholders, we uncover valuable insights that quantitative data alone may overlook.

Quantitative Research
In tandem with qualitative methodologies, NMSC leverages the power of Quantitative Research to provide a robust foundation of numerical insights. Through systematic data collection and analysis, we quantify patterns, preferences, and market trends, offering a comprehensive view of the business landscape.
Our quantitative research approach employs diverse tools, including surveys, experiments, and statistical modelling. These methodologies enable us to gather data from a large and representative sample, ensuring the statistical significance of our findings. By employing structured questionnaires and standardized data collection methods, we guarantee the reliability and validity of the information we present to our clients.
Quantitative research is particularly effective in measuring the prevalence of trends, assessing market size, and gauging the impact of various factors on consumer behavior. The numerical precision attained through this approach equips our clients with actionable insights, facilitating data-driven decision-making and strategy formulation.


Our Specialized Toolbox for Industry-Specific Market Research
We deploy a specialized arsenal of techniques tailored to meet your unique requirements. Here's a glimpse into our comprehensive toolbox:

Information Procurement
The stage entails acquiring market data or relevant information through various sources and methodologies.


Market Research Approach
We utilize both top-down and bottom-up approaches in market research analysis to achieve a comprehensive understanding of the market dynamics, leveraging the broad perspective of industry trends and macroeconomic factors alongside detailed insights from specific segments and individual companies.

Porters Five Forces Analysis
We conduct Porter's Five Forces analysis to evaluate the competitive landscape of an industry, providing us with insights into factors that affect profitability and strategic positioning.

SWOT Analysis

Forecasting
We utilize a forecasting model to predict future consumption by considering parameters like population, economics, regulations, market competition, drivers, constraints, technology, and pricing. We also employ statistical techniques such as multilinear regression, exponential smoothing, moving average, ARIMA, and Monte Carlo simulations for accurate predictions. In econometric forecasting, we analyzed short-term and long-term event impacts, attributing values based on regulatory frameworks, economic factors, and market events.


 Speak to Our Analyst