Micro Data Centers Market Global Industry Analysis and Forecast (2026–2035)

The global Micro Data Centers Market was valued at USD 9.90 billion in 2025 and is projected to reach USD 140.18 billion by 2035, growing at a 22.28% CAGR from 2026 to 2035 as edge AI, factory IT and grid constraints drive demand, with North America leading the market.
Download Free Sample PDF
Base Year (2025)
$9.90 Billion
Forecast (2035)
$140.18 Billion
CAGR (2026-2035)
22.3%
Top Region
North America

What Is the Micro Data Centers Market Size?
The global Micro Data Centers Market was valued at USD 9.90 Billion in 2025 and is estimated at USD 22.93 Billion in 2026. It is forecast to reach USD 140.18 Billion by 2035, growing at a 22.28% CAGR from 2026 to 2035. North America leads with approximately 35% share in 2026, while Hardware dominates the component mix at approximately 74%.
Our assessment indicates that the key takeaways below show where value concentrates across components, rack sizes, end users, regions and countries.

Micro Data Centers Market Global Industry Analysis and Forecast (2026–2035) Revenue Forecast
Values in USD Billion

2025 $9.90 Billion
2025
2026 $22.93 Billion
2026
2027 $28.04 Billion
2027
2028 $34.29 Billion
2028
2029 $41.92 Billion
2029
2030 $51.27 Billion
2030
2031 $62.69 Billion
2031
2032 $76.65 Billion
2032
2033 $93.73 Billion
2033
2034 $114.62 Billion
2034
2035 $140.18 Billion
2035

Key Takeaways

By Component: Hardware held the largest share, expanding from USD 7.48 Billion in 2025 to USD 84.10 Billion by 2035; Software is the fastest growing at 29.45% CAGR from 2026–2035.

By Rack Size: 25U to 42U held the largest share, expanding from USD 5.29 Billion in 2025 to USD 68.69 Billion by 2035; Above 42U is the fastest growing at 28.93% CAGR from 2026–2035.

By End User: IT and telecom held the largest share, expanding from USD 3.39 Billion in 2025 to USD 44.85 Billion by 2035; Healthcare is the fastest growing at 25.36% CAGR from 2026–2035.

Dominant Region: North America held the largest share, expanding from USD 3.52 Billion in 2025 to USD 42.05 Billion by 2035.

Fastest-Growing Region: Asia-Pacific is the fastest growing at 25.64% CAGR from 2026–2035, rising from USD 2.78 Billion in 2025 to USD 51.87 Billion by 2035.

Dominant Country: The U.S. held the largest national share, expanding from USD 2.83 Billion in 2025 to USD 32.38 Billion by 2035.

Fastest-Growing Country: India is the fastest growing at 32.93% CAGR from 2026–2035, rising from USD 0.31 Billion in 2025 to USD 10.37 Billion by 2035.

The Micro Data Centers Market presents an absolute investment opportunity of approximately USD 117.25 Billion between 2026 and 2035, rewarding vendors that pair rack scale integration with remote services early.
According to NMSC analysis, Services and Software together lift their combined share of market value from 26% in 2026 to 40% by 2035, which signals a shift from box sales to recurring monitoring revenue.

What Does the Micro Data Centers Market Encompass?
The Micro Data Centers Market covers self contained IT enclosures that integrate racks, power protection, cooling, security, fire suppression and remote monitoring into a single deployable unit. Vendors serving the edge datacenter segment, such as Schneider Electric, Vertiv, Eaton and Delta Electronics, position these systems for branch offices, factory floors, clinics and retail sites where no dedicated server room exists. Units range from wall mount cabinets to 42U and larger racks, and they ship pre integrated so that site work reduces to power and network connection.

Regulation shapes design choices more than purchase decisions. Reporting duties under the revised EU Energy Efficiency Directive apply to data centers with at least 500 kW of installed IT power, which places most single rack deployments outside the mandatory disclosure scope. Technology adoption is moving toward liquid cooling, AI based monitoring and rugged IP rated casings, and our findings suggest that buyers now specify cybersecurity and remote management features alongside thermal capacity.

Market Drivers & Dynamics

Interactive Dataset
Edge AI inference deployments near data sources driver +3.80% Global, led by North America and Asia-Pacific 2026–2032
Industry 4.0 factory and warehouse IT localization driver +2.60% Asia-Pacific, Europe 2026–2031
Grid and power constraints favoring distributed capacity driver +2.10% North America, Europe 2026–2030
Data residency and latency needs in regulated sectors driver +1.70% Europe, Middle East & Africa 2026–2029
Remote AI monitoring and managed services uptake driver +1.40% Global 2026–2033
Higher cost per kW versus centralized capacity restraint −2.30% Global 2026–2030
Power and thermal ceilings in compact enclosures restraint −1.90% Global 2026–2031
Fragmented standards and integration effort restraint −1.20% Emerging markets 2026–2029
Cybersecurity exposure at unattended sites restraint −1.00% Global 2026–2034
Source: Next Move Strategy Consulting

Growth Drivers

What Is the Primary Growth Driver in the Micro Data Centers Industry?

Rising AI-related electricity demand provides a broader structural backdrop for the Micro Data Centers Market. The International Energy Agency projects that global data center electricity consumption could reach approximately 945 TWh by 2030, with demand from AI-optimized data centers more than quadrupling over the period. In the United States, overall data center electricity consumption rose from 58 TWh in 2014 to 176 TWh in 2023 and is projected to reach 325–580 TWh by 2028. These sector-wide figures do not measure micro data center demand directly, but they highlight the value of rapidly deployable infrastructure for workloads that benefit from local processing, lower latency and reduced dependence on centralized capacity.

How Is Distributed AI Driving the Market Growth?

Regulated sectors such as finance, defense and healthcare face data residency, security and latency requirements that favor private or hybrid AI environments on premises. Vertiv's 2026 outlook highlights distributed AI as a leading force, and prefabricated designs can cut time to token by up to 50%. Micro data centers suit these buyers because a single rack with integrated power, cooling and monitoring can host inference locally, and our findings suggest healthcare and BFSI deployments will accelerate accordingly.

Growth Inhibitors

What Is Restraining the Micro Data Centers Market?

Capacity limits vary by configuration: some low-density in-rack systems support only a few kilowatts, while higher-capacity and liquid-cooled micro data centers can support more demanding workloads. Buyers deploying AI inference must match IT load, cooling capability and upgrade requirements to the intended application. Where compact systems cannot accommodate the required cluster, larger modular or conventional data center facilities may be more suitable.

What Are the Growth Opportunities?

Can Liquid Cooled AI Micro Data Centers Open a Premium Density Tier?

Racks above 42U form the fastest growing size tier at 28.93% CAGR, yet few suppliers ship standardized liquid cooled units. Vendors that integrate coolant distribution, power conversion and monitoring in one enclosure can price above conventional cabinets. The primary beneficiaries are research laboratories, analytics teams and industrial operators needing local inference at tens of kilowatts per rack.

Does Managed Micro Data Center Service Represent a Recurring Revenue Opportunity?

Services grow at 27.63% CAGR, outpacing hardware, because distributed fleets need remote monitoring, predictive maintenance and field dispatch. Subscription contracts convert one time enclosure sales into multi year revenue, and providers that bundle uptime guarantees gain pricing power. Retail chains, banks and healthcare networks with dozens of sites are the clearest beneficiaries of this model.

Can Healthcare Edge Deployments Become a Distinct Premium Vertical?

Healthcare grows at 25.36% CAGR, the fastest among end users, as hospitals localize imaging, diagnostics and patient record processing. Compact, quiet, secure enclosures that meet clinical environment needs can command premium pricing. Vendors offering compliance ready configurations and fast installation benefit most, and hospital networks gain lower latency without expanding central data rooms.

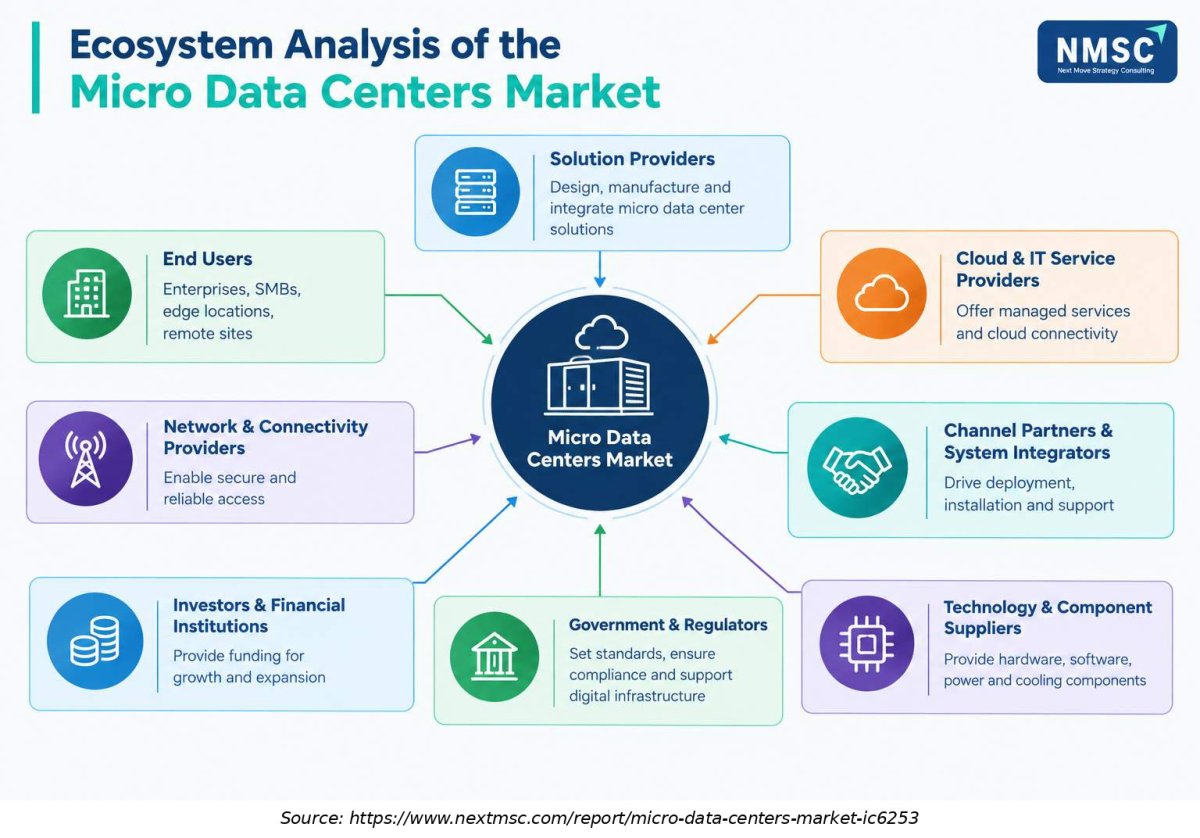
Ecosystem Analysis of the Micro Data Centers Market

The micro data centers market ecosystem comprises end users, solution providers, cloud and IT service providers, connectivity providers, channel partners, technology suppliers, investors, and regulatory authorities. These stakeholders collectively influence infrastructure design, deployment, connectivity, and operational performance. Their interdependence shapes adoption across enterprise, edge computing, and remote locations, while power availability, integration capabilities, and compliance requirements affect implementation decisions.

Segmentation Analysis

2025 (USD Billion)
2035 (USD Billion)
Hardware 2025: $7.48 Billion | 2035: $84.10 Billion
Hardware
Software 2025: $0.82 Billion | 2035: $21.03 Billion
Software
Services 2025: $1.60 Billion | 2035: $35.05 Billion
Services
Hardware $7.48 Billion $84.10 Billion 19.46%
Software $0.82 Billion $21.03 Billion 29.45%
Services $1.60 Billion $35.05 Billion 27.63%

Which Component Segment Leads the Micro Data Centers Market?

Hardware leads the component axis at approximately 74% of 2026 value, because every deployment requires racks, uninterruptible power, cooling and security components. Software is the fastest growing sub segment at 29.45% CAGR, followed by Services at 27.63%, as vendors bundle monitoring platforms such as EcoStruxure IT and managed predictive services with each enclosure. We observed that buyers increasingly judge suppliers on lifecycle visibility rather than cabinet specifications alone.

2025 (USD Billion)
2035 (USD Billion)
Category A
Category B
Category C
Category D
Segment Item 2025 (USD Billion) 2035 (USD Billion) CAGR
Category A $10.0 USD Billion $40.0 USD Billion 25.0%
Category B $17.1 USD Billion $51.1 USD Billion 11.0%
Category C $24.2 USD Billion $62.2 USD Billion 25.0%
Category D $31.3 USD Billion $73.3 USD Billion 11.0%

Segment-wise data is locked

Unlock complete segment-wise numbers for By Rack Size.

Unlock Full Data
2025 (USD Billion)
2035 (USD Billion)
Category A
Category B
Category C
Category D
Segment Item 2025 (USD Billion) 2035 (USD Billion) CAGR
Category A $10.0 USD Billion $40.0 USD Billion 27.0%
Category B $17.1 USD Billion $51.1 USD Billion 9.0%
Category C $24.2 USD Billion $62.2 USD Billion 19.0%
Category D $31.3 USD Billion $73.3 USD Billion 17.0%

Segment-wise data is locked

Unlock complete segment-wise numbers for By End User.

Unlock Full Data
2025 (USD Billion)
2035 (USD Billion)
Category A
Category B
Category C
Category D
Segment Item 2025 (USD Billion) 2035 (USD Billion) CAGR
Category A $10.0 USD Billion $40.0 USD Billion 14.0%
Category B $17.1 USD Billion $51.1 USD Billion 24.0%
Category C $24.2 USD Billion $62.2 USD Billion 22.0%
Category D $31.3 USD Billion $73.3 USD Billion 12.0%

Segment-wise data is locked

Unlock complete segment-wise numbers for By Region.

Unlock Full Data

Growth Opportunities

Our analysis shows that three whitespace opportunities are positioned to generate disproportionate revenue growth through 2035.

Can Liquid Cooled AI Micro Data Centers Open a Premium Density Tier?

Racks above 42U form the fastest growing size tier at 28.93% CAGR, yet few suppliers ship standardized liquid cooled units. Vendors that integrate coolant distribution, power conversion and monitoring in one enclosure can price above conventional cabinets. The primary beneficiaries are research laboratories, analytics teams and industrial operators needing local inference at tens of kilowatts per rack.

Does Managed Micro Data Center Service Represent a Recurring Revenue Opportunity?

Services grow at 27.63% CAGR, outpacing hardware, because distributed fleets need remote monitoring, predictive maintenance and field dispatch. Subscription contracts convert one time enclosure sales into multi year revenue, and providers that bundle uptime guarantees gain pricing power. Retail chains, banks and healthcare networks with dozens of sites are the clearest beneficiaries of this model.

Can Healthcare Edge Deployments Become a Distinct Premium Vertical?

Healthcare grows at 25.36% CAGR, the fastest among end users, as hospitals localize imaging, diagnostics and patient record processing. Compact, quiet, secure enclosures that meet clinical environment needs can command premium pricing. Vendors offering compliance ready configurations and fast installation benefit most, and hospital networks gain lower latency without expanding central data rooms.

Regional Outlook

2025 (USD Billion)
2035 (USD Billion)
North Americ
Asia-Pacific
Europe
Middle East
Latin Americ
Region 2025 (USD Billion) 2035 (USD Billion) CAGR (%)
North America $10.0 USD Billion $40.0 USD Billion 9.0%
Asia-Pacific $17.1 USD Billion $51.1 USD Billion 27.0%
Europe $24.2 USD Billion $62.2 USD Billion 25.0%
Middle East & Africa $31.3 USD Billion $73.3 USD Billion 23.0%
Latin America $38.4 USD Billion $84.4 USD Billion 12.0%

Regional data is locked

Unlock complete regional numbers for this market.

Unlock Full Data

Competitive Landscape

Our assessment indicates that the industry combines global power and cooling groups with regional specialists, and competition revolves around integration depth, remote services and cooling capability.

Dimension Description
Market Structure Global power and cooling groups lead, with a long tail of regional specialists and integrators
Innovation Focus Liquid cooling, rugged IP rated enclosures, courier shippable stackable designs and AI based remote monitoring
M&A Activity Vertiv completed its acquisition of ThermoKey in June 2026, expanding its heat-rejection and thermal-management capabilities, and announced an agreement to acquire UtilityInnovation Group in September 2026 to extend its microgrid controls and behind-the-meter power capabilities.

How Do Companies Compete in the Micro Data Centers Market?

Companies compete on integration depth, speed of delivery and lifecycle services. Eaton advertises shipment within days for stock configurations, while Schneider Electric and Delta Electronics sell configurable all in one cabinets with monitoring platforms. Pricing strategies favor bundled hardware and service contracts, and geographic expansion relies on channel partners, distributors and local integrators that handle installation and support.

Which Competitive Archetypes Dominate the Micro Data Centers Market?

Three archetypes dominate. Power and cooling groups such as Schneider Electric, Vertiv, Eaton and Delta Electronics differentiate through ecosystem breadth. Telecom and ICT suppliers such as Huawei and ZTE differentiate through prefabricated cabinets and operator relationships, while enclosure and thermal specialists such as Rittal and STULZ differentiate through engineering customization and liquid cooling options.

What Innovation and Differentiation Strategies Are Companies Pursuing?

We observed that suppliers invest in higher density cooling, sealed rugged casings and software driven operations. STULZ pairs its Micro DC with direct liquid cooling, Schneider Electric offers IP54 sealed 42U units, and Vertiv adds predictive services. Huawei integrates facial recognition access and mobile monitoring, and differentiation increasingly rests on remote manageability rather than cabinet hardware.

What M&A and Partnership Activity Is Shaping the Market?

Our findings suggest that consolidation targets adjacent power, thermal and prefabrication capability. Vertiv agreed to acquire ThermoKey in March 2026 to extend heat rejection, and agreed in September 2026 to acquire UtilityInnovation Group for microgrid and onsite power controls. Partnerships between IT vendors and enclosure makers also continue, and these deals widen integrated offerings for distributed AI.

Key Market Players

Based on research conducted by NMSC, the following 8 companies represent the validated leading providers of micro data center solutions, ranked qualitatively on verifiable portfolio depth and operating scale.

Schneider Electric SE Vertiv Holdings Co Huawei Technologies Co., Ltd. Eaton Corporation plc Delta Electronics, Inc. ZTE Corporation Rittal GmbH & Co. KG STULZ GmbH

Latest Developments

During our market evaluation, we noticed that 2025–2026 activity concentrates on edge AI platforms, predictive services and compact liquid cooled designs.

Date Event
Oct 2026 Zella DC introduced Zella Stack, a modular indoor micro data center designed for edge computing and AI workloads. Its stackable architecture supports configurations up to 48RU, with air- and liquid-cooling options capable of handling cooling loads of up to 124 kW.
Jul 2026 Supermicro launched validated Kubernetes Edge AI appliances in collaboration with Red Hat and Everpure, combining Supermicro hardware, Red Hat OpenShift, and Portworx data management to simplify AI inference deployments across retail, industrial, and distributed edge environments.
Jan 2026 Vertiv launched Next Predict, an AI-powered managed service that uses machine learning, anomaly detection, and predictive analytics to identify potential equipment issues and enable proactive maintenance across data center power, cooling, and IT infrastructure.
Jan 2026 IBM and Datavault AI announced plans to deploy enterprise AI services through the SanQtum AI platform across micro-edge data centers in New York and Philadelphia, combining IBM watsonx technologies with secure, distributed infrastructure to support low-latency enterprise AI applications.

Investment Opportunities

Where Are Capital Inflows Concentrating in the Micro Data Centers Market?

Capital flows toward vendors that combine enclosures with monitoring software and liquid cooling, and toward acquisitions that add thermal and power capability. Vertiv's 2026 agreements for ThermoKey and UtilityInnovation Group illustrate this pattern. Edge AI service networks such as the New York and Philadelphia micro facilities also attract private funding, and investors favor models with recurring service revenue.

How Is Infrastructure Investment Shaping Market Capacity?

Infrastructure investment is shifting toward prefabricated factories, regional assembly lines and field service networks that shorten delivery. Eaton advertises three business day shipment on stock units, and Zella DC designed Stack for courier delivery. These investments lift effective capacity without large construction projects, and we found that suppliers with local assembly in Asia-Pacific and North America win time sensitive orders.

What ESG Considerations Are Influencing Market Investment?

Energy efficiency, water use and refrigerant choices influence procurement. Delta Electronics highlights energy efficient cooling and Schneider Electric labels sealed units as efficiency optimized, while European reporting rules pressure larger sites toward transparency. Investors screen for low power usage effectiveness designs, recyclable packaging and take back programs, and compact systems that avoid new buildings carry a lower embodied carbon profile.

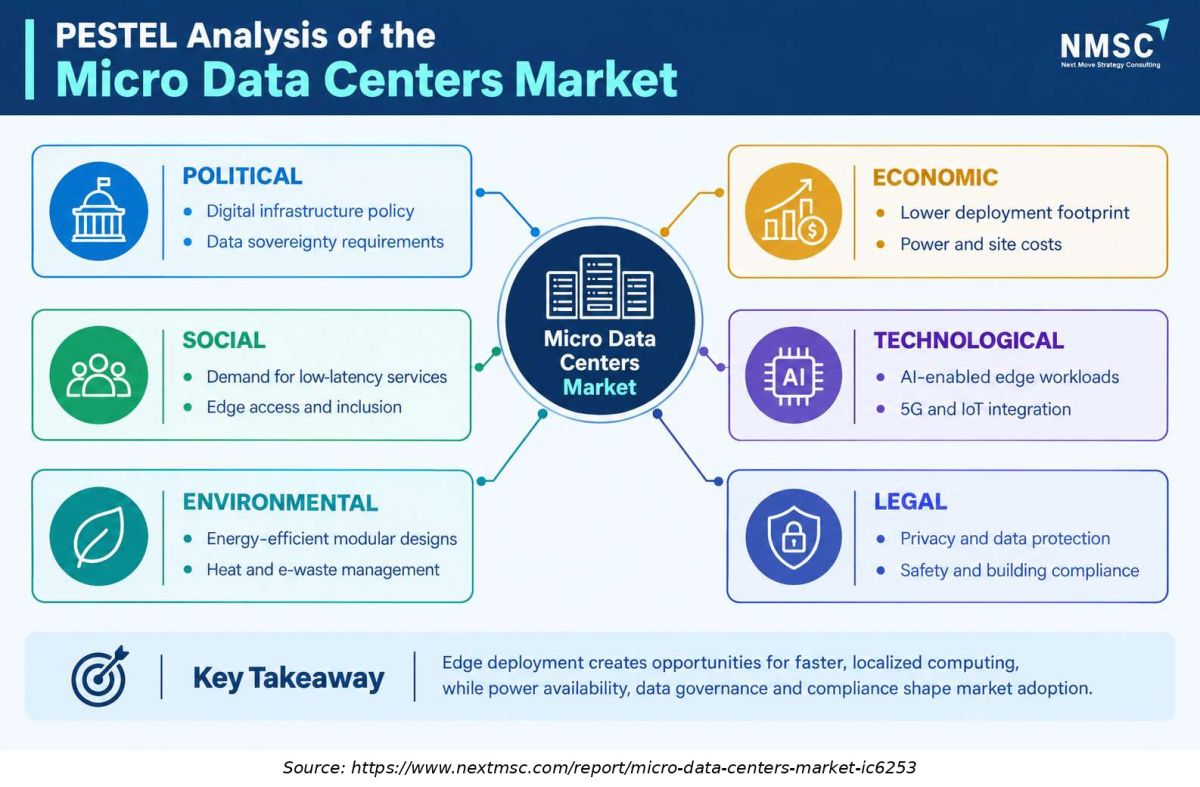
PESTEL Analysis of the Micro Data Centers Market

PESTEL Analysis of the Micro Data Centers Market

The PESTEL analysis evaluates the political, economic, social, technological, environmental, and legal factors influencing the micro data centers market. Digital infrastructure policies, deployment costs, demand for low-latency computing, AI and IoT integration, energy efficiency, and data protection requirements collectively shape market adoption. Assessing these external forces helps stakeholders understand deployment opportunities, operational constraints, and regulatory considerations influencing market development.

Key Benefits for Stakeholders

How Does This Report Benefit Enterprise Leaders and IT Infrastructure Buyers?

Enterprise IT heads, plant managers and branch network owners gain a reconciled sizing model starting at USD 9.90 Billion in 2025 and rising to USD 140.18 Billion by 2035. Segment tables by component, rack size and end user clarify which configurations to specify, and regional and country views support site planning, vendor negotiation and phased rollout decisions.

How Does This Report Benefit Investors and Financial Analysts?

Investors and financial analysts gain a view of a market growing at 22.28% CAGR with an absolute opportunity of USD 117.25 Billion between 2026 and 2035. Segment growth differentials, such as Software at 29.45% and Above 42U racks at 28.93%, help identify attractive subsectors, while the competitive section frames consolidation themes and recurring revenue potential.

How Does This Report Benefit Technology Vendors and Product Teams?

Vendors and product teams gain visibility into which rack sizes, cooling approaches and end users carry the fastest growth. The report highlights the weight of services and software, the rise of liquid cooled designs and the importance of rugged enclosures. Regional insights guide channel strategy, and competitive archetypes support positioning decisions against global groups and specialists.

Key Market Segments Evaluated

By Component

  • Hardware
  • Software
  • Services

By Rack Size

  • Up to 24U
  • 25U to 42U
  • Above 42U

By End User

  • IT and telecom
  • Industrial and manufacturing
  • BFSI
  • Healthcare
  • Commercial and public sector

By Region

  • North America 
    • U.S.
    • Canada
    • Mexico
  • Europe 
    • UK
    • Germany
    • France
    • Italy
    • Spain
    • Sweden
    • Denmark
    • Finland
    • Netherlands
    • Rest of Europe
  • Asia-Pacific 
    • China
    • India
    • Japan
    • South Korea
    • Taiwan
    • Indonesia
    • Vietnam
    • Australia
    • Philippines
    • Malaysia
    • Rest of APAC
  • Middle East & Africa 
    • Saudi Arabia
    • UAE
    • Egypt
    • Israel
    • Turkey
    • Nigeria
    • South Africa
    • Rest of MEA
  • Latin America 
    • Brazil
    • Argentina
    • Chile
    • Colombia
    • Rest of LATAM

Conclusion & Recommendations

The long term outlook is strongly positive, with revenue rising from USD 22.93 Billion in 2026 to USD 140.18 Billion by 2035. Edge AI, regulated sector data residency and grid constrained campuses sustain demand, and the market shifts gradually from standard cabinets toward higher density, liquid cooled and service rich systems that operators manage remotely across large fleets.

What Strategic Positioning Recommendations Does NMSC Offer?

Vendors should prioritize integrated monitoring software, managed services and liquid cooled rack designs above 42U, because these areas grow fastest. Partnerships with server makers and integrators shorten delivery, and regional assembly in Asia-Pacific and North America supports speed. Buyers should specify remote management, security and thermal headroom early, and plan fleet standardization to cut lifecycle costs.

What Is the Investment Attractiveness of the Micro Data Centers Market?

Investment attractiveness is high, supported by an absolute growth of USD 117.25 Billion between 2026 and 2035 and a 22.28% CAGR. Recurring service revenue, rising density and acquisitions by leading suppliers underline strategic interest. Asia-Pacific offers the fastest regional growth, while North America provides the largest base, and healthcare and industrial users offer high growth verticals.

What Are the Market Shifts and Key Risks in the Micro Data Centers Market?

Key shifts include the move from air cooled to liquid cooled enclosures, from hardware sales to subscriptions and from generic racks to rugged, application specific designs. Risks include capacity ceilings versus AI rack densities, cost per kW pressure, fragmented standards and cybersecurity exposure at unattended sites, and supply chain tightness for power and cooling components.

What Are the Primary Growth Pathways Through 2035?

Primary growth pathways include edge AI inference rollouts, industrial and healthcare digitization, remote monitoring and managed service expansion and high density liquid cooled units. Asia-Pacific and the Middle East & Africa add the fastest regional momentum, and vendors that combine hardware, software and services capture the largest share of incremental value.

Delivered Customizations

We have successfully delivered the following deep-dive customizations:

Client Request Customization Delivered Value Adds
Historical Market Shipment and Revenue Analysis
  • Historical micro data center shipment volume and revenue analysis by component, rack size, and end-user segment, 2019 to 2025.
  • Establishes the historical growth baseline and identifies which rack-size and component segments are expanding fastest.
Company-Level Product Share Analysis
  • Vendor and product-line share benchmarking across micro data center rack-size categories and regions.
  • Shows where leading vendors are concentrated and where share gaps create entry or partnership opportunities.
Country-Level Trade Assessment
  • Country-wise import and export analysis of micro data center enclosures, racks, power, and cooling components using HS-coded trade data.
  • Highlights sourcing hubs and import dependencies to support supply chain, localization, and manufacturing location decisions.
Rack-Size Deployment Mapping by End User
  • Micro data center adoption mapping by rack size across BFSI, healthcare, telecom, retail, manufacturing, and government end users.
  • Identifies which end-user verticals favor small versus larger rack footprints, guiding product portfolio and targeting priorities.
Component Value Pool Analysis by Rack Size
  • Value split of micro data center hardware, power, cooling, monitoring software, and services by rack-size category.
  • Reveals where profit pools sit within each rack-size tier to guide component investment and partnership choices.
Regional Edge Deployment Readiness Assessment
  • Regional readiness scoring for micro data center deployment based on electricity access, broadband coverage, and edge-site density.
  • Prioritizes regions where infrastructure conditions support near-term micro data center rollouts and geographic expansion.

FAQs

About the Author

Mihul Sharma

Mihul Sharma

Mihul Sharma is Research Associate at Next Move Strategy Consulting, where he has covered technology, industrial, and healthcare markets for 3 years. His work applies structured business research, market analysis, and secondary-source review to assess market trends, competitive developments, and growth opportunities. He supports report development by fully synthesizing industry data, company information, and market signals into concise findings for strategy and investment-focused research teams.

About the Reviewer

Supradip Baul

Supradip Baul

Supradip Baul is an accomplished business consultant and strategist with over a decade of rich experience in market intelligence, strategy, technology, and business transformation. His work has included rigorous qualitative and quantitative analysis across multiple industries, helping clients shape investment decisions and long-term roadmaps. Earlier in his career, he was associated with Gartner, where he contributed to industry-leading reports and market share analyses. He has worked with leading global companies and holds an MBA with a dual specialization in Marketing and Finance.

Download Free Sample

Diana Trejo

DIANA TREJO

Assistant Manager

Sumitomo Corporation de Mexico, S.A. de C.V.

Recently, we purchased a report on the Mexico Data Center Market from Next Move Strategy Consulting. The service has been excellent, with support that is always timely and thoroughly professional. The information provided is interesting, highly useful, and delivered with clarity. I would highly recommend NextMSC for anyone seeking insightful and dependable analysis.

Amos Chang

AMOS CHANG

Strategy Consultant

Kardex Group

I have bought the intralogistics market reports from NMSC two times so far. Joseph and his team are always very helpful and flexible in responding to any customization requirements on the report. Their expertise in market reports really helps us steer the day-to-day business. I will definitely recommend and come back myself whenever there is a need.

Gaurav Jaiswal

GAURAV JAISWAL

Founder & CEO

Yano Charge Private Limited

The EV Charging market research report provided by the NextMSC was exceptionally detailed and insightful. It offered a comprehensive analysis that proved to be a game-changer for our strategic planning. Truly a testament to the NextMSC’s expertise and thoroughness in EV market landscape & analysis.

Henri Knyphausen

HENRI KNYPHAUSEN

Partner at Singulier [Ex-BCG]

Singulier

I recently engaged NEXTMSC.com for a commercial due diligence project within the intralogistics sector, and I am pleased to provide a reference based on my experience. In utilizing NEXTMSC.com's services, I found their report to offer valuable insights into market dynamics and key industry players. The initial report provided a solid foundation for our analysis. However, as we were investigating a smaller target in the market, and I had specific customization requests requiring additional research. These requests included detailed information on product portfolios of various players and sub-market sizes, both inclusive and exclusive of certain product categories. NEXTMSC.com demonstrated commendable responsiveness and agility in accommodating these customization requests. Within a timeframe of 1-2 weeks, they delivered a revised report that met our specific needs. Furthermore, they were receptive to my follow-up inquiries, ensuring clarity and understanding of the data provided. The final deliverable significantly contributed to our due diligence efforts. One of NEXTMSC.com's notable strengths lies in their qualitative research capabilities. However, for future engagements, I would recommend the inclusion of a quantified market model in Excel format. Such a model would offer the ability to conduct in-depth analyses and explore various market segments, including country-specific data and subcomponent breakdowns. Based on my positive experience, I would not hesitate to work with NEXTMSC.com again. Their responsiveness, willingness to accommodate customization requests, and commitment to delivering actionable insights make them a reliable partner for commercial research projects.

Kishu Kanda

KISHU KANDA

Strategy Analyst

Accenture

We purchased the AI Consumer Market Report from this company. Not only did they customize the report to meet our specific requirements, but they also showed great flexibility in accommodating our budget. The report we received fully met our expectations. Additionally, they provided prompt and thorough responses to both our pre-purchase and follow-up questions. We look forward to working with this company again in the future.

Custom Market Research Services

We will customize the research for you if the listed report does not fully match your requirements.

Get 30% Free Customization

Select License

This website uses cookies to ensure you get the best experience on our website. Learn more

✖