Uranium Mining Market Global Industry Analysis and Forecast (2026–2035)

Uranium Mining Market size was USD 12.04 Billion in 2025, projected to reach USD 27.73 Billion by 2035, growing at a CAGR of 8.23% from 2026 to 2035. Key drivers include rising reactor fuel requirements, a widening gap between mined supply and reactor demand, and government-supported nuclear fuel security programmes, with Asia-Pacific leading the market.

Download Free Sample PDF
Base Year (2025)
$12.04 Billion
Forecast (2035)
$27.73 Billion
CAGR (2026-2035)
8.2%
Top Region
Asia-Pacific

What Is the Uranium Mining Market Size?

The global Uranium Mining Market reached USD 12.04 Billion in 2025 and is estimated at USD 13.61 Billion in 2026, forecast to reach USD 27.73 Billion by 2035 at a CAGR of 8.23% between 2026 and 2035. Asia-Pacific leads with approximately 55% revenue share in 2025, while Uranium Oxide Concentrate is the dominant product form at approximately 78% of total market revenue.

Based on our market analysis, we observed that mined uranium now covers approximately 90% of annual reactor requirements, up from roughly 78% in 2022, as secondary supply from inventories and enrichment underfeeding thins out. That shift moves pricing power to producers and explains why contract volumes, not spot trades, anchor mining revenue. Reactor requirements near 68,920 tU in 2025 sit against primary output of around 60,000 tU, a gap producers must fill through restarts, ramp-ups, and new projects.

Uranium Mining Market Global Industry Analysis and Forecast (2026–2035) Revenue Forecast

Values in USD Billion

2025 $12.04 Billion
2025
2026 $13.61 Billion
2026
2027 $14.73 Billion
2027
2028 $15.94 Billion
2028
2029 $17.25 Billion
2029
2030 $18.67 Billion
2030
2031 $20.21 Billion
2031
2032 $21.87 Billion
2032
2033 $23.68 Billion
2033
2034 $25.62 Billion
2034
2035 $27.73 Billion
2035

Key Takeaways

By Product Form: Uranium Oxide Concentrate held the largest share, expanding from USD 9.34 Billion in 2025 to USD 20.10 Billion by 2035; Other Processed Uranium Intermediate is the fastest-growing at 12.00% CAGR from 2026–2035.

By Extraction Method: In-Situ Recovery (ISR) led with USD 6.87 Billion in 2025, rising to USD 16.78 Billion by 2035, and also posts the fastest growth among named methods at 8.79% CAGR from 2026–2035.

By Production Role: Primary Uranium Production accounted for USD 10.60 Billion in 2025 and reaches USD 23.57 Billion by 2035; By-Product Uranium Recovery is the fastest-growing at 10.97% CAGR from 2026–2035.

By Deposit Type: Sandstone-Hosted Deposits dominated at USD 5.79 Billion in 2025 and climbed to USD 13.03 Billion by 2035; Surficial and Calcrete-Hosted Deposits grew fastest at 10.80% CAGR from 2026–2035.

By Buyer Type: Nuclear Power Utilities and Reactor Operators remained the largest buyers, moving from USD 7.48 Billion in 2025 to USD 15.96 Billion by 2035; Physical Uranium Investment Vehicles expand fastest at 14.99% CAGR from 2026–2035.

By Pricing Structure: Uranium Market-Linked Pricing is the largest structure at USD 5.06 Billion in 2025, growing to USD 12.76 Billion by 2035, while Hybrid Fixed and Market-Linked Pricing advances fastest at 9.84% CAGR from 2026–2035.

By End Use: Civilian Nuclear Power Generation is the main use, rising from USD 11.32 Billion in 2025 to USD 25.51 Billion by 2035; Uranium Target Material for Isotope Production is the fastest-growing at 13.99% CAGR from 2026–2035.

Dominant Region: Asia-Pacific dominated with approximately 55% revenue share in 2025, anchored by in situ recovery output from Kazakhstan and Uzbekistan.

Fastest-Growing Region: Latin America is expected to register the highest CAGR of 12.98% during 2026–2035, from a small base led by Brazil.

Dominant Country: Kazakhstan led the market with an estimated USD 4.64 Billion in 2025, supported by the largest in situ recovery fleet worldwide.

Fastest-Growing Country: The U.S. is projected to expand from USD 0.11 Billion in 2025 at a CAGR of approximately 17.69% during 2026–2035, driven by restarts and new in situ recovery wellfields.

The Uranium Mining Market presents an absolute expansion opportunity of USD 14.12 Billion between 2026 and 2035, calculated as the difference between the 2026 base estimate of USD 13.61 Billion and the 2035 forecast of USD 27.73 Billion. This favours in situ recovery operators and unconformity-related developers that can add contracted pounds before 2030.

According to NMSC analysis, the long-term contract price near USD 96.50 per pound of U3O8 at the end of September 2026 matters more to producers than spot volatility. Contracts lock in the revenue that funds new wellfields, shafts, and mills, and utilities are paying a premium for certainty of supply well beyond the current decade.

Ecosystem Analysis of the Uranium Mining Industry

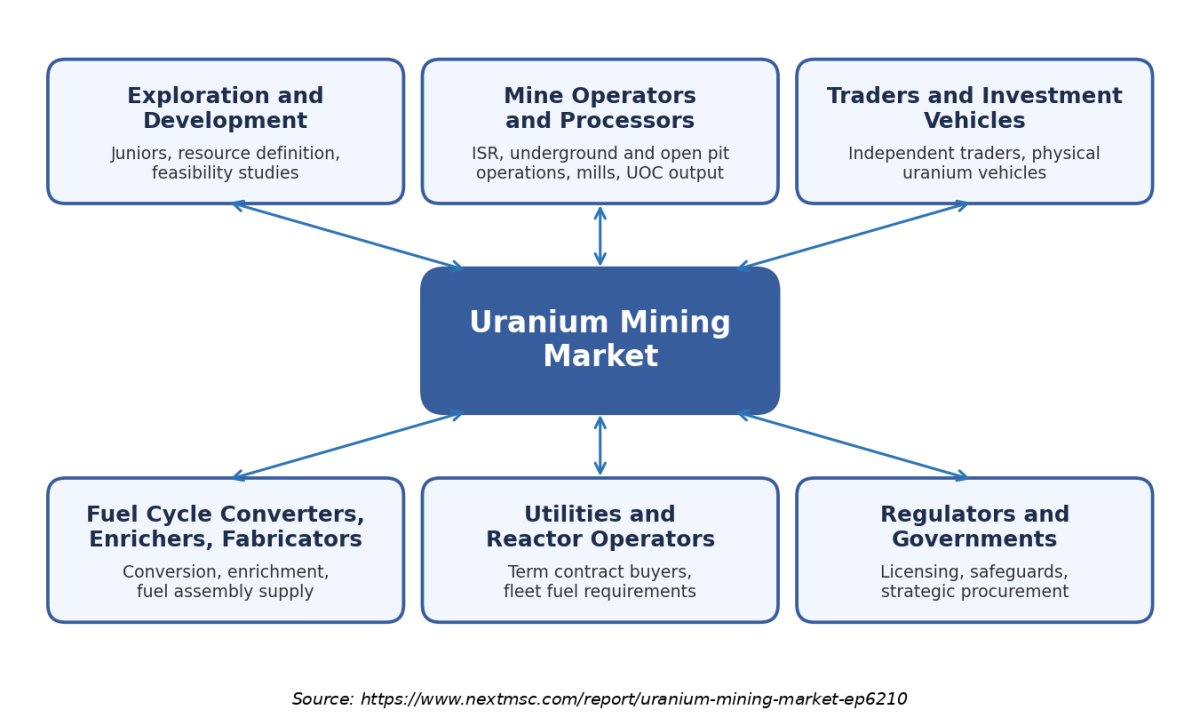
The above infographic presents the Uranium Mining Market ecosystem in a simpler format, focusing on six core stakeholder groups: exploration and development companies, mine operators and processors, traders and investment vehicles, fuel cycle converters and fabricators, utilities and reactor operators, and regulators and governments. It shows how these participants link discovery, extraction, marketing, and consumption, while shaping contract terms, safety performance, and security of nuclear fuel supply.

What does the Uranium Mining Market Encompass?

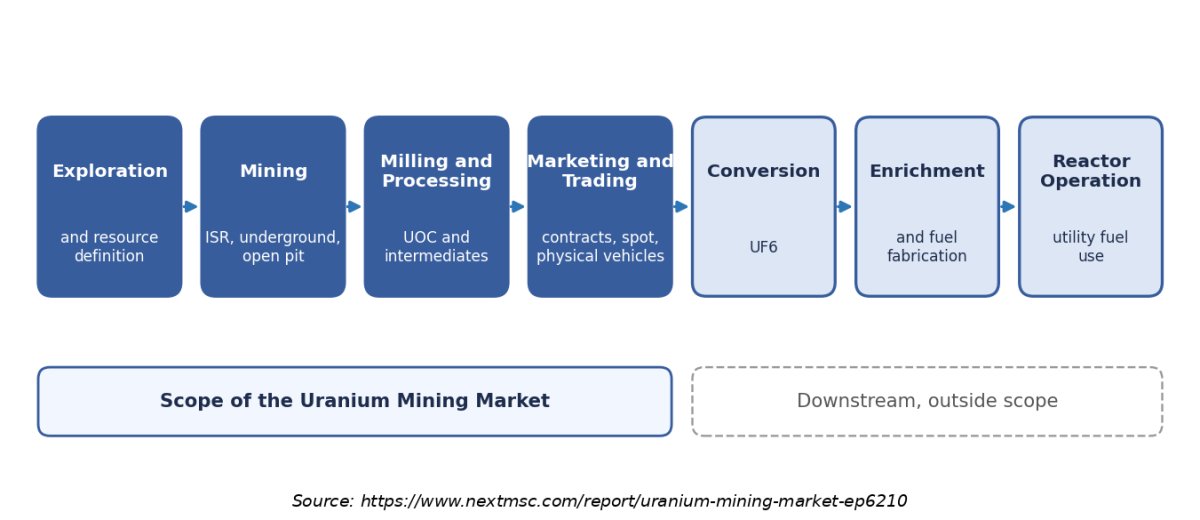
The market covers revenue earned from extracting uranium and converting it into saleable forms such as uranium oxide concentrate, other saleable concentrates, processed intermediates, and unprocessed ore. It includes in situ recovery, underground and open pit operations, and uranium recovered as a coproduct or byproduct of other minerals. Conversion, enrichment, fuel fabrication, reactor operation, and resale of purchased inventory sit outside the scope of this market report.

Regulation shapes every stage, from IAEA safeguards and national licensing to environmental approvals such as the 2026 Canadian Nuclear Safety Commission construction licence for the Rook I project in Saskatchewan. Technology adoption centres on wellfield design for in situ recovery, mechanised underground mining in the Athabasca Basin and sulphuric acid supply management in Kazakhstan. We found that approval lead times, rather than geology, now set the pace of new supply.

Market Drivers & Dynamics

Interactive Dataset
Rising reactor fuel requirements from fleet growth and life extensions driver +2.1% Global, led by Asia-Pacific 2026–2035
Long-term contract prices repricing toward new mine economics driver +1.6% North America, Kazakhstan 2026–2030
Government strategic procurement and critical mineral policy driver +1.1% U.S., Canada, Europe 2026–2032
Restart and expansion of idled mines driver +0.9% Namibia, Australia, U.S. 2026–2029
Permitting delays and long project lead times restraint −1.0% Global 2026–2035
Reagent and transport disruption at mines and mills restraint −0.8% Kazakhstan, Canada 2026–2028
Geopolitical concentration of supply and sanctions exposure restraint −0.6% Europe, Central Asia 2026–2030
Source: Next Move Strategy Consulting

Growth Drivers

What Is the Primary Growth Driver in the Uranium Mining Market?

Rising reactor fuel requirements are the primary structural driver. The World Nuclear Association estimates global requirements at about 68,920 tU in 2025, rising to just over 150,000 tU by 2040 in its Reference Scenario and above 204,000 tU in the Upper Scenario. Because primary output was only around 60,000 tU in 2025, every added gigawatt of capacity widens the gap that new mines must fill.

How Is Long-Term Contracting Driving Market Growth?

Utilities are contracting further ahead as secondary supply declines, and the long-term price reached about USD 96.50 per pound at the end of September 2026 in Cameco's published series. Higher contract prices lift revenue per pound for every producer, and they justify capital for new wellfields and shafts. Our findings suggest that term pricing, not spot, now steers investment decisions.

Growth Inhibitors

What Is Restraining the Uranium Mining Market?

Permitting time and operating disruption are the main restraints. The World Nuclear Association warns that development timelines are lengthening, and 2026 showed how fragile logistics can be: flooding collapsed a bridge serving McArthur River and Key Lake in May, suspending Key Lake output and reducing mining for about two weeks. Kazatomprom also trimmed its nominal 2026 production level by roughly 10% to 29,697 tU, which indicates that primary supply responds slowly to price increases and reinforces operational volatility risks for utilities.

Segmentation Analysis

2025 (USD Billion)
2035 (USD Billion)
Uranium Oxide Concentrate 2025: $9.34 Billion | 2035: $20.10 Billion
Uranium Oxid
Other Saleable Uranium Concentrate 2025: $0.96 Billion | 2035: $2.83 Billion
Other Saleab
Other Processed Uranium Intermediate 2025: $0.60 Billion | 2035: $2.08 Billion
Other Proces
Unprocessed Uranium-Bearing Ore 2025: $0.66 Billion | 2035: $1.47 Billion
Unprocessed
Others 2025: $0.48 Billion | 2035: $1.25 Billion
Others
Uranium Oxide Concentrate $9.34 Billion $20.10 Billion 7.58%
Other Saleable Uranium Concentrate $0.96 Billion $2.83 Billion 10.74%
Other Processed Uranium Intermediate $0.60 Billion $2.08 Billion 12.00%
Unprocessed Uranium-Bearing Ore $0.66 Billion $1.47 Billion 8.09%
Others $0.48 Billion $1.25 Billion 8.70%

Which Product Form Dominates the Uranium Mining Market?

Uranium Oxide Concentrate dominates with USD 9.34 Billion in 2025 and an approximately 78% share, because utilities and converters buy U3O8 as the standard traded form. Other Processed Uranium Intermediate is the fastest-growing at 12.00% CAGR from 2026 to 2035 as producers sell upgraded intermediates ahead of conversion. Unprocessed ore stays small at USD 0.66 Billion in 2025 since most ore is milled near the mine.

2025 (USD Billion)
2035 (USD Billion)
In-Situ Reco
Conventional
Conventional
Combined Und
Others
Segment Item 2025 (USD Billion) 2035 (USD Billion) CAGR
In-Situ Recovery (ISR) $10.0 USD Billion $40.0 USD Billion 25.0%
Conventional Underground Mining Only $17.1 USD Billion $51.1 USD Billion 11.0%
Conventional Open-Pit Mining Only $24.2 USD Billion $62.2 USD Billion 25.0%
Combined Underground and Open-Pit Mining $31.3 USD Billion $73.3 USD Billion 11.0%
Others $38.4 USD Billion $84.4 USD Billion 16.0%

Segment-wise data is locked

Unlock complete segment-wise numbers for By Extraction Method.

Unlock Full Data
2025 (USD Billion)
2035 (USD Billion)
Primary Uran
Co-Product U
By-Product U
Segment Item 2025 (USD Billion) 2035 (USD Billion) CAGR
Primary Uranium Production $10.0 USD Billion $40.0 USD Billion 27.0%
Co-Product Uranium Production $17.1 USD Billion $51.1 USD Billion 9.0%
By-Product Uranium Recovery $24.2 USD Billion $62.2 USD Billion 19.0%

Segment-wise data is locked

Unlock complete segment-wise numbers for By Production Role.

Unlock Full Data
2025 (USD Billion)
2035 (USD Billion)
Sandstone-Ho
Unconformity
Quartz-Pebbl
Vein-Type De
Breccia-Comp
Segment Item 2025 (USD Billion) 2035 (USD Billion) CAGR
Sandstone-Hosted Deposits $10.0 USD Billion $40.0 USD Billion 14.0%
Unconformity-Related Deposits $17.1 USD Billion $51.1 USD Billion 24.0%
Quartz-Pebble Conglomerate Deposits $24.2 USD Billion $62.2 USD Billion 22.0%
Vein-Type Deposits $31.3 USD Billion $73.3 USD Billion 12.0%
Breccia-Complex Deposits $38.4 USD Billion $84.4 USD Billion 27.0%

Segment-wise data is locked

Unlock complete segment-wise numbers for By Deposit Type.

Unlock Full Data
2025 (USD Billion)
2035 (USD Billion)
Nuclear Powe
Nuclear Fuel
Government S
Independent
Physical Ura
Segment Item 2025 (USD Billion) 2035 (USD Billion) CAGR
Nuclear Power Utilities and Reactor Operators $10.0 USD Billion $40.0 USD Billion 24.0%
Nuclear Fuel-Cycle Processors and Converters $17.1 USD Billion $51.1 USD Billion 22.0%
Government Strategic Procurement Entities $24.2 USD Billion $62.2 USD Billion 20.0%
Independent Uranium Traders Taking Title $31.3 USD Billion $73.3 USD Billion 22.0%
Physical Uranium Investment Vehicles $38.4 USD Billion $84.4 USD Billion 13.0%

Segment-wise data is locked

Unlock complete segment-wise numbers for By Buyer Type.

Unlock Full Data
2025 (USD Billion)
2035 (USD Billion)
Fixed Pricin
Fixed Pricin
Uranium Mark
Hybrid Fixed
Segment Item 2025 (USD Billion) 2035 (USD Billion) CAGR
Fixed Pricing Without Escalation $10.0 USD Billion $40.0 USD Billion 23.0%
Fixed Pricing with Non-Market Escalation $17.1 USD Billion $51.1 USD Billion 9.0%
Uranium Market-Linked Pricing $24.2 USD Billion $62.2 USD Billion 19.0%
Hybrid Fixed and Market-Linked Pricing $31.3 USD Billion $73.3 USD Billion 13.0%

Segment-wise data is locked

Unlock complete segment-wise numbers for By Pricing Structure.

Unlock Full Data
2025 (USD Billion)
2035 (USD Billion)
Civilian Nuc
Naval Nuclea
Other Milita
Research and
Uranium Targ
Segment Item 2025 (USD Billion) 2035 (USD Billion) CAGR
Civilian Nuclear Power Generation $10.0 USD Billion $40.0 USD Billion 21.0%
Naval Nuclear Propulsion $17.1 USD Billion $51.1 USD Billion 23.0%
Other Military and Defense Nuclear Applications $24.2 USD Billion $62.2 USD Billion 25.0%
Research and Test Reactors $31.3 USD Billion $73.3 USD Billion 15.0%
Uranium Target Material for Isotope Production $38.4 USD Billion $84.4 USD Billion 16.0%

Segment-wise data is locked

Unlock complete segment-wise numbers for By End Use.

Unlock Full Data

Supply Chain Analysis of the Uranium Mining Industry

Supply Chain Analysis of the Uranium Mining Industry
The above infographic maps the Uranium Mining Market supply chain from exploration through mining, milling, marketing, and conversion to reactor use. The first four stages fall inside the market scope, while conversion, enrichment, and fuel fabrication are shown as downstream stages that consume mined output. It highlights that value is created at the mill, where concentrate is drummed and sold, and that marketing contracts set revenue long before the pounds are produced.

Growth Opportunities

Our analysis shows that three structural whitespace opportunities are emerging for uranium producers and developers through 2035.

Can Unconformity Related Developments Unlock High Grade Supply?

High-grade Athabasca deposits can deliver large volumes at low unit cost once built. NexGen's Rook I licence runs to March 2036, and construction is planned over four years, so contracts signed now can be filled from the early 2030s. The main beneficiary is the unconformity-related segment, projected to reach USD 6.24 Billion by 2035.

Does Surficial Supply Offer Faster Restarts?

Surficial and calcrete deposits are shallow and mined with conventional equipment, which shortens restart time. Langer Heinrich shows the pattern, completing its ramp-up and guiding to 5.1 to 5.6 million pounds for the next financial year. The beneficiary is the surficial and calcrete segment, which grows to USD 2.19 Billion by 2035 and supplies utilities seeking nearer-term pounds.

Can Domestic Fuel Chains Create Premium Demand for U.S. Output?

Policy support for domestic nuclear fuel is creating a premium for U.S. pounds. Uranium Energy Corp reports roughly 12 million pounds of annual licensed capacity and has received an NRC docket number for a planned conversion facility. In situ recovery operators in Texas and Wyoming benefit most, with U.S. revenue projected to rise from USD 0.11 Billion in 2025 to USD 0.78 Billion by 2035.

Regional Outlook

2025 (USD Billion)
2035 (USD Billion)
North Americ
Europe
Asia-Pacific
Middle East
Latin Americ
Region 2025 (USD Billion) 2035 (USD Billion) CAGR (%)
North America $10.0 USD Billion $40.0 USD Billion 9.0%
Europe $17.1 USD Billion $51.1 USD Billion 27.0%
Asia-Pacific $24.2 USD Billion $62.2 USD Billion 25.0%
Middle East & Africa $31.3 USD Billion $73.3 USD Billion 23.0%
Latin America $38.4 USD Billion $84.4 USD Billion 12.0%

Regional data is locked

Unlock complete regional numbers for this market.

Unlock Full Data

Competitive Landscape

Our assessment indicates that the Uranium Mining Market industry is concentrated at the top, with state-controlled majors and Western integrated producers setting supply, while mid-tier producers compete on restarts and cost.

Dimension Description
Market Structure Concentrated: Kazatomprom, Cameco, Orano, Navoiyuran, Rosatom Nedra and Chinese state groups control most supply.
Innovation Focus Wellfield design, staged in situ approvals, mine automation and byproduct recovery circuits.
M&A Activity Selective asset purchases, joint ventures and minority stakes rather than large mergers.

How Do Companies Compete in the Uranium Mining Market?

Companies compete on contract position, cost per pound, jurisdiction risk, and delivery reliability. Kazatomprom reported an attributable cash cost of USD 24.48 per pound for the first half of 2026, which sets a low reference point, while Paladin reported USD 43.3 per pound for its financial year. Geographic expansion into Texas, Wyoming, and Namibia reflects buyers' wish for diversified origin, and pricing strategies range from unhedged sales to base escalated contracts.

Which Competitive Archetypes Dominate the Uranium Mining Market?

State-controlled producers such as Kazatomprom, Navoiyuran, Rosatom Nedra, China General Nuclear Power Corporation, China National Nuclear Corporation and Uranium Corporation of India Limited compete on scale and national supply links. Western integrated groups, led by Cameco, Orano and BHP, differentiate on jurisdiction and fuel services. Growth producers, including Paladin, Boss Energy, enCore Energy and Uranium Energy Corp, differentiate on restart speed and price exposure.

What Innovation and Differentiation Strategies Are Companies Pursuing?

We observed that producers invest in wellfield design and processing capacity rather than discovery alone. Boss Energy is moving to wide-spaced wellfields at Honeymoon, commissioning new ion exchange columns, and Uranium Energy Corp is building a hub-and-spoke network around the Hobson and Irigaray plants. Differentiation also comes from vertical integration, as Uranium Energy Corp plans a U.S. conversion facility under an NRC docket.

What M&A and Partnership Activity Is Shaping the Uranium Mining Market?

Our findings suggest that portfolio moves are targeted. Uranium Energy Corp acquired Rio Tinto's Wyoming uranium assets, including the Sweetwater plant, in December 2024, and Boss Energy holds a 30% interest in the Alta Mesa operation in Texas. Joint ventures remain central in Kazakhstan, where Inkai is shared by Kazatomprom and Cameco and is guided to 10.4 million pounds in 2026 on a 100% basis.

Key Market Players

Based on research conducted by NMSC, the following 20 companies represent the leading participants in the global market.

National Atomic Company Kazatomprom JSC Cameco Corporation State Enterprise Navoiyuran Orano SA China General Nuclear Power Corporation China National Nuclear Corporation BHP Group Limited JSC Rosatom Nedra Heathgate Resources Pty Ltd Paladin Energy Ltd Boss Energy Limited Uranium Corporation of India Limited Lotus Resources Limited Energy Fuels Inc. Uranium Energy Corp. enCore Energy Corp. Peninsula Energy Limited Ur-Energy Inc. State Enterprise Eastern Mining and Processing Plant (SkhidGZK) Western Uranium & Vanadium Corp.

Latest Developments

During our market evaluation, we noticed that 2025–2026 developments centre on supply guidance, new in situ capacity, licensing and policy.

Date Event
July 2026 Paladin reported 4.82 million pounds of U3O8 production at Langer Heinrich for the year to June 2026 and guided 5.1 to 5.6 million pounds for the next year.
April 2026 Uranium Energy Corp commenced production at Burke Hollow in Texas after Texas Commission on Environmental Quality approval.
March 2026 Rook I received its site preparation and construction licence from the nuclear regulator in Canada, with a ten-year term.
January 2026 The U.S. President issued Proclamation 11001 on processed critical minerals, including uranium, directing trade negotiations and reserving further remedies.
September 2025 World Nuclear Association published the World Nuclear Fuel Report 2025, estimating 2025 reactor requirements at about 68,920 tU and noting that primary supply covered about 90% of requirements in 2024.

Expert Insights

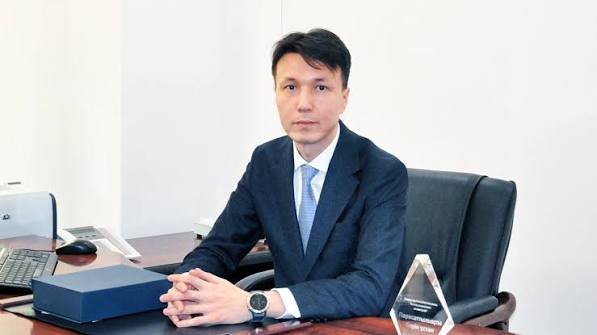
Meirzhan Yussupov

Meirzhan Yussupov

CEO and Chairman of the Management Board | Kazatomprom

"New realities are signalling that the era of 'cheap' uranium is fading away. But the fundamental urgency for secure, baseload, emission-free power is stronger than ever. Global utilities completely recognise this shift, and we are certain that long-term uranium demand is going to be consistent and powerful."

Analyst Interpretation

The statement highlights the importance of reliable uranium supply as countries advance nuclear power development and utilities seek to secure long-term nuclear fuel requirements. Sustained demand, combined with production-cost pressures and supply constraints, reinforces the strategic importance of developing viable uranium deposits and maintaining reliable mine production. These conditions create opportunities for established producers and new mining projects capable of delivering uranium at commercially viable costs. However, realizing these opportunities depends on exploration success, regulatory approvals, infrastructure availability, and the ability to expand production without compromising operational reliability.

Investment Opportunities

Where Are Capital Inflows Concentrating in the Uranium Mining Market?

Capital is concentrating in producers with licensed capacity and clean balance sheets. Uranium Energy Corp reported USD 753 million in liquid assets and no debt at its fiscal year-end, and Boss Energy ended FY2026 with no debt after a year of ramp-up. NexGen has taken a final investment decision on Rook I, signalling that lenders and shareholders will fund large Athabasca builds when licences are in hand.

How Is Infrastructure Investment Shaping Market Capacity?

Processing capacity, not ore, often limits output. Uranium Energy Corp's Hobson plant is licensed for four million pounds a year and serves several Texas satellite projects, and Boss Energy has commissioned ion exchange columns and trunklines at Honeymoon. Domestic conversion plans, such as the NRC docket received for a U.S. facility, add downstream demand for mined pounds and reduce transport and counterparty risk for producers.

What ESG Considerations Are Influencing Market Investment?

Environmental, social and governance factors now sit inside licence conditions. The Rook I licence requires an Indigenous engagement programme and a financial guarantee within 60 days, and Honeymoon holds a fully cash-backed environmental bond. Utilities increasingly ask suppliers for restoration plans and community agreements, so producers with documented water management and closure funding gain an advantage in long-term contract tenders.

Key Benefits for Stakeholders

How Does This Report Benefit Utilities and Nuclear Fuel Buyers?

Utilities and fuel buyers gain a reconciled view of mined supply, with the Uranium Mining Market sized at USD 13.61 Billion in 2026 and segmented by deposit type, extraction method and pricing structure. The regional and country analysis helps procurement teams assess origin diversification, jurisdiction risk and contract mix, while the competitive assessment shows which producers can deliver the pounds that term contracts require.

How Does This Report Benefit Mining Companies and Project Developers?

Mining companies and developers gain benchmarks for segment growth, from 8.79% CAGR in in situ recovery to 9.31% in unconformity-related deposits. The report outlines licensing milestones, cost references, and partnership patterns, which help developers time financing and contracting. Operators can compare their position with the 20 leading companies and identify gaps in processing and logistics.

How Does This Report Benefit Investors and Policymakers?

Investors and policymakers gain a transparent forecast of USD 27.73 Billion by 2035, with an absolute opportunity of USD 14.12 Billion between 2026 and 2035. The analysis separates drivers from restraints, links policy actions such as critical mineral designation to supply outcomes, and highlights where capital and permitting reform would add the most mined output over the forecast period.

Key Market Segments Evaluated

By Product Form

  • Uranium Oxide Concentrate
  • Other Saleable Uranium Concentrate
  • Other Processed Uranium Intermediate
  • Unprocessed Uranium-Bearing Ore
  • Others

By Extraction Method

  • In-Situ Recovery (ISR)
  • Conventional Underground Mining Only
  • Conventional Open-Pit Mining Only
  • Combined Underground and Open-Pit Mining
  • Others

By Production Role

  • Primary Uranium Production
  • Co-Product Uranium Production
  • By-Product Uranium Recovery

By Deposit Type

  • Sandstone-Hosted Deposits
  • Unconformity-Related Deposits
  • Quartz-Pebble Conglomerate Deposits
  • Vein-Type Deposits
  • Breccia-Complex Deposits
  • Intrusive-Hosted Deposits
  • Volcanic-Hosted Deposits
  • Surficial and Calcrete-Hosted Deposits
  • Phosphorite-Hosted Deposits
  • Others

By Buyer Type

  • Nuclear Power Utilities and Reactor Operators
  • Nuclear Fuel-Cycle Processors and Converters
  • Government Strategic Procurement Entities
  • Independent Uranium Traders Taking Title
  • Physical Uranium Investment Vehicles
  • Other Direct Buyers
  • Buyer Type Not Disclosed

By Pricing Structure

  • Fixed Pricing Without Escalation
  • Fixed Pricing with Non-Market Escalation
  • Uranium Market-Linked Pricing
  • Hybrid Fixed and Market-Linked Pricing

By End Use

  • Civilian Nuclear Power Generation
  • Naval Nuclear Propulsion
  • Other Military and Defense Nuclear Applications
  • Research and Test Reactors
  • Uranium Target Material for Isotope Production
  • Others

By Region

  • North America 
    • U.S.
    • Canada
    • Mexico
  • Europe 
    • UK
    • Germany
    • France
    • Italy
    • Spain
    • Sweden
    • Denmark
    • Finland
    • Netherlands
    • Rest of Europe
  • Asia-Pacific 
    • China
    • India
    • Japan
    • South Korea
    • Taiwan
    • Indonesia
    • Vietnam
    • Australia
    • Philippines
    • Malaysia
    • Rest of APAC
  • Middle East & Africa 
    • Saudi Arabia
    • UAE
    • Egypt
    • Israel
    • Turkey
    • Nigeria
    • South Africa
    • Rest of MEA
  • Latin America 
    • Brazil
    • Argentina
    • Chile
    • Colombia
    • Rest of LATAM

Conclusion & Recommendations

The outlook is positive, with the market rising from USD 12.04 Billion in 2025 to USD 27.73 Billion by 2035 at 8.23% CAGR. Demand growth from fleet expansion, life extensions and advanced nuclear reactors outpaces slow supply additions, so mined output must more than double by 2040 to meet the Reference Scenario. We found that contracted restarts and licensed projects underpin the forecast.

What Strategic Positioning Recommendations Does NMSC Offer?

Producers should prioritise licensed, shovel-ready capacity and protect delivery reliability, since utilities reward certainty. Operators should keep a balanced contract book, mixing market-linked and hybrid pricing to capture upside while funding growth. Developers should secure approvals and processing access early, and utilities should diversify origin across Kazakhstan, Canada, Namibia, Australia and the United States.

What Is the Investment Attractiveness of the Uranium Mining Market?

Attractiveness is high, supported by an opportunity of USD 14.12 Billion between 2026 and 2035 and long-term prices near USD 96.50 per pound. Returns favour operators with low-cost in situ recovery assets and clean balance sheets. Execution risk remains material because permitting, reagent supply, and logistics can delay output, so staged investment tied to contracts is the preferred approach.

What Are the Market Shifts and Key Risks in the Uranium Mining Market?

Key shifts include the move from spot to term pricing, the rise of policy-driven procurement, and the return of idled capacity. Key risks include permitting delays, sulphuric acid and transport disruption, sanctions exposure in Russian-linked supply chains, and price volatility in thin spot trading. Disciplined guidance from Kazatomprom and Cameco can offset oversupply, but it also exposes buyers to supply shocks.

What Are the Primary Growth Pathways Through 2035?

Primary growth pathways include in situ recovery expansion in the United States and Central Asia, Athabasca development led by Rook I, and surficial restarts in Namibia. Byproduct and coproduct recovery add a smaller path at around 10.97% CAGR. Together, these pathways support the USD 27.73 Billion forecast and spread supply risk across deposit types and jurisdictions.

FAQs

Sources & References

1.

World Nuclear News: Kazatomprom 2026 production plan

world-nuclear-news.org
2.

World Nuclear News: Mid-year updates from major uranium producers

world-nuclear-news.org
3.

World Nuclear Association: World Nuclear Fuel Report 2025

world-nuclear.org
4.

World Nuclear Association: Fuel Report press statement

world-nuclear.org
5.

World Nuclear Association: Impact on demand for nuclear fuel services

world-nuclear.org
6.

Canadian Nuclear Safety Commission: Rook I licence news release

canada.ca
7.

Canadian Nuclear Safety Commission: Rook I regulatory review status

cnsc-ccsn.gc.ca
8.

U.S. Federal Register: Proclamation 11001 of January 14, 2026

federalregister.gov
9.

U.S. SEC: Uranium Energy Corp Form 8-K, April 8, 2026

sec.gov
10.

U.S. SEC: Uranium Energy Corp Form 8-K, fiscal 2026 results

sec.gov
11.

U.S. SEC: Uranium Energy Corp Form 8-K, quarterly update

sec.gov
12.

American Nuclear Society: UEC begins production at Burke Hollow

ans.org
13.

ASX: Paladin Energy Quarterly Report, June 2026

announcements.asx.com.au
14.

ASX: Paladin Energy Quarterly Report, March 2026

announcements.asx.com.au
15.

ASX: Boss Energy FY26 production announcement

announcements.asx.com.au
16.

Cameco Corporation: Uranium price series

cameco.com

About the Author

Mayurima Roy

Mayurima Roy

Mayurima Roy is Research Analyst at Next Move Strategy Consulting, where she has spent 4 years working across the firm's full industry coverage rather than a single fixed vertical. Her work centers on structured research, ongoing trend tracking, competitive assessment, and insight-led content development, translating complex market data into clear, decision-ready narratives that support informed client decision-making across diverse global industries, market sectors, and world regions every day.

About the Reviewer

Supradip Baul

Supradip Baul

Supradip Baul is an accomplished business consultant and strategist with over a decade of rich experience in market intelligence, strategy, technology, and business transformation. His work has included rigorous qualitative and quantitative analysis across multiple industries, helping clients shape investment decisions and long-term roadmaps. Earlier in his career, he was associated with Gartner, where he contributed to industry-leading reports and market share analyses. He has worked with leading global companies and holds an MBA with a dual specialization in Marketing and Finance.

Download Free Sample

Melanie Samko

MELANIE SAMKO

Director of Marketing

TOSOH BIOSCIENCE, INC.

The information provided by NMSC is incredibly valuable, thank you so much for such a excellent work. I really appreciate it. I will make sure to reference all of it, in my summary document.

Nishant Awate

NISHANT AWATE

Business Development Global Sales

Zehnder Group Deutschland GmbH

Our experience working with Next Move Strategy Consulting was positive. The team was responsive, professional, and open to incorporating our specific requirements throughout the project. The India AHU market study was comprehensive and well structured, covering market value and volume forecasts, product and application segments, and key industry trends. The inclusion of both AHU and residential MVHR market insights made the study particularly relevant for our strategic market assessment. Overall, the report provides a solid foundation for evaluating market potential, identifying priority segments, and supporting business-development decisions in India.

Semih Kavaklioglu

SEMIH KAVAKLIOGLU

Co-Founder & Sales Manager

Decortie

I work a lot in the marketing industry and I know that research is an essential part of any campaign. I have used Market research reports for my own products and I found them to be very informative and well-researched. The team here produces insightful reports for a good price

Gaurav Jaiswal

GAURAV JAISWAL

Founder & CEO

Yano Charge Private Limited

The EV Charging market research report provided by the NextMSC was exceptionally detailed and insightful. It offered a comprehensive analysis that proved to be a game-changer for our strategic planning. Truly a testament to the NextMSC’s expertise and thoroughness in EV market landscape & analysis.

Amos Chang

AMOS CHANG

Strategy Consultant

Kardex Group

I have bought the intralogistics market reports from NMSC two times so far. Joseph and his team are always very helpful and flexible in responding to any customization requirements on the report. Their expertise in market reports really helps us steer the day-to-day business. I will definitely recommend and come back myself whenever there is a need.

Custom Market Research Services

We will customize the research for you if the listed report does not fully match your requirements.

Get 30% Free Customization

Select License

This website uses cookies to ensure you get the best experience on our website. Learn more

✖