U.S. Smart Furniture Market by Product Type (Smart Tables & Desks, Smart Stools & Benches, Smart Chairs, and Smart Beds), and By End-User (Residential, Commercial) By Distribution Channel (B2C/Retail (Big‑box/Home Centres, Specialty Furniture Stores, and E‑commerce), and Contract (B2B Projects & Fit‑Outs)– U.S Analysis & Forecast, 2025–2030
Industry: Construction & Manufacturing | Publish Date: 10-Nov-2025 | No of Pages: 152 | No. of Tables: 116 | No. of Figures: 53 | Format: PDF | Report Code : CM1135
U.S. Smart Furniture Industry Outlook
The U.S. Smart Furniture Market size was valued at USD 199.1 million in 2024, and is expected to be valued at USD 228.9 million by the end of 2025. The industry is projected to grow, hitting USD 357.1 million by 2030, with a CAGR of 9.3% between 2025 and 2030.
The U.S. smart furniture market continues to witness steady growth in 2025, fueled by the convergence of hybrid work trends, and increased consumer focus on wellness and productivity. Urban hubs like New York, San Francisco, and Seattle are becoming key demand centers for smart office and home furniture, driven by rising adoption of ergonomic, connected, and multifunctional furniture solutions. Growth is further supported by increased corporate spending on hybrid-ready workspaces and residential tech integration.
The industry is rapidly innovating with AI-enabled features, sustainable materials, and modular, customizable designs that meet the evolving needs of both commercial and residential users. Demand for eco-conscious and health-enhancing furniture, such as smart sit-stand desks, climate-responsive beds, and app-controlled lighting is on the rise.
However, the market faces challenges like high upfront costs, tech integration complexity, and consumer data privacy concerns. Continued innovation, focus on user experience, and cross-industry collaboration will be key to shaping the future of the U.S. smart furniture ecosystem.
The chart illustrates the projected market size of the U.S. Smart Furniture market from 2024 to 2030, highlighting the values (in millions). The value is expected to grow steadily from USD 199.1 million in 2024 to USD 357.1 million in 2030.
What are the Key Trends in the U.S. Smart Furniture Industry?
How is AI Integration Redefining Smart Furniture in the U.S.?
Artificial Intelligence (AI) is creating a new dimension of personalization, boosting purchase engagement by approx. 30% and cutting product development time by 25% in home furnishings. Products now anticipate users' needs via sensors and analytics, enabling adjustments in posture, lighting, or temperature without manual input.
For companies, this means embedding smart algorithms into existing designs can significantly improve customer satisfaction and return rates. The real opportunity lies in developing AI-driven features that learn and adapt over time, transforming furniture from functional to intuitively responsive companions.
Why Is Sustainability becoming Non-Negotiable for Smart Furniture Makers?
Growing consumer demand is pushing brands to embrace eco-friendly design, recycled materials, energy-saving components, and circular economy models are becoming a baseline expectation. Integrating sustainability not only enhances appeal but potentially attracts premium pricing and brand loyalty. For furniture firms, leveraging eco-certified smart products can deliver a unique value proposition, especially when paired with modular functionality in space-conscious markets.
Is Modular and Multifunctional Design the Smart Furniture Sweet Spot?
With urban living on the rise and homes functioning as multipurpose spaces, modular smart furniture is surging in popularity. Flexible sofas, adjustable smart desks, and built-in tech components have become lifestyle essentials. Tailoring modular systems to respond to changing layouts and usage patterns helps manufacturers appeal to modern buyers. Brands that make customization accessible, online or through AR-enabled visualization will stay ahead in a market that values adaptability as much as innovation.
What are the Key Market Drivers, Breakthroughs, and Investment Opportunities that will Shape the U.S. Smart Furniture Industry in the Next Decade?
The U.S. building sector is being propelled by shifting demographics and targeted public spending. As metropolitan populations swell, demand for mixed-use towers and residential complexes has surged. At the same time, federal and provincial stimulus packages are underwriting major transit, healthcare and renewable-energy projects. This confluence of private-sector momentum and government-backed infrastructure programs has catalysed innovations, ranging from off-site modular assembly to cloud-based project management, that are streamlining schedules and curbing costs.
Nonetheless, the sector faces headwinds from labour shortages, supply-chain disruptions and volatile material prices, which threaten project timelines and budgets. At the same time, rising demand for sustainable and resilient buildings has opened doors for specialized retrofit services and innovative materials like mass timber. This dynamic landscape presents a blend of challenges and opportunities for industry players willing to invest in technology, workforce development and green solutions.
Growth Drivers:
What’s Driving Growth through IoT-Enabled Convenience?
The growing integration of IoT devices into everyday living spaces is significantly accelerating the adoption of smart furniture in the U.S. market. Consumers are increasingly drawn to products that not only serve functional purposes but also offer seamless digital experiences.
Smart furniture embedded with sensors, actuators, and app-based controls allows users to personalize and automate their environment, whether it’s a bed adjusting its temperature for better sleep, or a desk that remembers ergonomic settings. This real-time responsiveness transforms ordinary furniture into intelligent companions that enhance comfort, health, and productivity.

The above chart illustrates the growth of U.S. smart homes (in millions) from 2021 to 2025. The bars show the steady increase in smart home numbers, from 54.1 million in 2021 to a projected 58.4 million in 2025, indicating that the total count of smart homes is climbing in the U.S.
How Is Demand for Space-Saving Design Fueling Smart Furniture?
Urbanization and the shrinking size of residential units, especially in densely populated U.S. cities are reshaping consumer preferences toward space-efficient, multi-functional furniture. This shift has fueled demand for smart furniture solutions that combine compact form factors with versatile utility.
Products like foldable smart desks, wall-mounted charging stations, and transformable smart beds that double as sofas or storage units are increasingly popular among urban dwellers. These innovations not only save space but also deliver integrated technological benefits such as USB ports, app-controlled adjustments, and built-in lighting or temperature control.
Growth Inhibitors:
Is Elevated Costs Creating a Barrier in Widespread Adoption?
One of the most persistent challenges slowing the widespread adoption of the U.S. smart furniture market growth is its high price point. Integrating advanced technologies such as embedded sensors, wireless connectivity, motorized components, and app-based controls significantly increases production costs compared to conventional furniture.
As a result, smart furniture often sits in a premium price tier, which can deter cost-sensitive consumers, especially in mass-market segments. While early adopters and tech-savvy buyers may justify the expense, mainstream customers remain hesitant due to unclear return on investment.
To bridge this gap, manufacturers could explore modular pricing models offering base units with optional smart upgrades or partner with retailers to provide financing and instalment plans. Streamlining technology costs through economies of scale and focusing on essential features rather than luxury add-ons may also help companies bring down prices and expand their reach to a broader audience.
Where is the Emerging Investment Opportunity in Sustainability-Driven Innovation?
Sustainability is rapidly becoming a defining investment opportunity in the U.S. smart furniture market trends. With growing awareness of climate change and resource conservation, consumers are actively seeking products that align with their environmental values, including smart furniture designed with sustainability in mind. This includes the use of recycled or responsibly sourced materials, low-energy consumption features, and durable, modular designs that extend product lifecycles and reduce waste.
Green-certified smart furniture, offers companies a competitive edge, allowing them to appeal to eco-conscious buyers while meeting evolving regulatory and ESG expectations. Beyond consumer appeal, sustainable practices can also reduce long-term production costs and attract impact-focused investors. Companies that proactively embed environmental responsibility into their smart furniture portfolios stand to gain not only market share but also brand equity and pricing power in an increasingly conscious marketplace.
How the U.S. Smart Furniture Market is Segmented in this Report, and What are the Key Insights from the Segmentation Analysis?
By Product Type Insights
Which Smart Furniture Piece Is Really Powering the Connected Living Revolution—Beds, Desks, Chairs, or Benches?
On the basis of product type, the market is segmented into smart tables & desks, smart stools & benches, smart chairs and smart bed. Smart tables and desks currently lead the U.S. smart furniture market, propelled by the surge in remote and hybrid work models that demand ergonomic, tech-integrated solutions. Smart beds are also gaining popularity, driven by consumer interest in sleep quality monitoring and wellness tech. Meanwhile, smart chairs are becoming more relevant with the integration of posture-correcting sensors, although adoption remains moderate. Similarly, Smart stools and benches remain the least penetrated segment due to limited application. This segmentation reflects a market shaped by functionality, frequency of use, and comfort.

By Distribution Channel Insights
Which Distribution Channel—B2C Retail or Contract (B2B Projects & Fit‑Outs)—is Powering Smart Furniture in the U.S.?
Based on distribution channel, the market is segmented into B2C/Retail, and Contract (B2B Projects & Fit‑Outs). The U.S. smart furniture market is shaped by two distinct distribution channels, B2C retail and contract (B2B projects & fit-outs). While retail channels cater to individual consumers seeking smart solutions for homes and personal workspaces, the contract segment drives large-scale adoption across offices, hotels, and institutions. Contract channels often prioritize customization and long-term functionality, making them essential for bulk deployments. This segmentation reflects a dual-market dynamic where consumer convenience fuels retail, while project-based integration sustains the contract segment’s strategic importance.
By End-User Insights
Is Residential or Commercial Driving the U.S. Smart Furniture Market?
Based on end-user, the market is bifurcated into residential and commercial. The U.S. smart furniture market is distinctly segmented into residential and commercial end-users, each influencing the market in unique ways. The residential segment is witnessing strong momentum, fueled by the rise of smart homes, remote work culture, and consumer demand for convenience, wellness, and tech integration in personal living spaces. On the other hand, the commercial segment, including offices, hotels, and healthcare environments, is driving demand for scalable, ergonomic, and productivity-focused solutions. While residential buyers prioritize ease of use and lifestyle enhancement, commercial users focus on durability, system integration, and user efficiency. This segmentation highlights how smart furniture adoption is being shaped by both personalized living needs and institutional performance goals.
Competitive Landscape
Which Companies Dominate the U.S. Smart Furniture Industry and How Do They Compete?
The U.S. smart furniture market share is led by prominent companies such as Teknion Corporation, HON (Brand of HNI Corporation), Sobro, MillerKnoll Inc, Sleep Number Corporation, Steelcase Inc, Haworth Inc, Versa Desk, Krueger International, Ori Living, Evodesk, Uplift Desk, Humanscale International Holdings Ltd, Eight Sleeps, iMovR and others. These firms are fueling market growth through sustained investment in design innovation, ergonomic intelligence, and tech integration. Their strategies revolve around embedding IoT sensors, mobile app connectivity, wireless charging, and adaptive environmental controls into both residential and commercial furniture.
In response to hybrid work trends, companies are developing modular smart desks, beds, and seating solutions that balance aesthetics with productivity-enhancing features. These innovations are driving a shift in consumer preferences toward multifunctional and connected living and working spaces.
The competitive landscape is being shaped by ongoing digital transformation, with leading brands regularly upgrading their offerings with AI-enhanced personalization, energy-efficient features, and real-time data analytics. U.S. smart furniture companies are expanding their market presence by leveraging direct-to-consumer (D2C) channels, strategic collaborations with technology providers, and adaptive production methods to cater to evolving lifestyles.
Several players are also investing in smart office ecosystems, combining ergonomic design with cloud-based control systems to meet the needs of dynamic workplaces. As the industry grows, firms are increasingly aligning with sustainability standards and smart city initiatives, positioning themselves at the forefront of a rapidly modernizing furniture landscape.

Market Dominated by the U.S. Smart Furniture Giants and Specialist Firms
The U.S. smart furniture market is characterized by a blend of established giants like MillerKnoll (Herman Miller), Sleep Number, Teknion, Steelcase, and HNI (HON), alongside innovators like Sobro and Versa Desk. The competitive landscape spans from high-end residential smart beds and ergonomic chairs to tech-infused commercial desks, with each player carving out niches in both lifestyle and workplace segments. This fragmentation boosts diversity, letting both legacy brands and modern disruptors drive market evolution.
Innovation and Adaptability Drive Market Success
Leading players in the U.S. smart furniture industry are setting themselves apart through innovation tailored to modern lifestyles and hybrid work needs. Sobro has turned everyday coffee tables into multifunctional tech hubs, blending sleek design with features like wireless charging, built-in fridges, and Bluetooth speakers to elevate home living.
Meanwhile, Sleep Number continues to lead in health-driven innovation, with smart beds that adapt to users’ sleep patterns in real time and even regulate temperature for personalized comfort. On the workspace front, MillerKnoll channels its legacy of design excellence into ergonomic office and healthcare furniture that responds to real human needs.
Companies like Teknion and Versa Desk are also adapting swiftly to hybrid work trends, offering height-adjustable desks, modular systems, and mobile-powered workstations that make flexibility and wellness central to the modern office experience.
Market Players to Opt for Merger & Acquisition Strategies to Expand Their Presence
M&A strategy is accelerating consolidation. Most notably, HNI Corporation is acquiring Steelcase in a USD 2.2 billion deal, aiming to combine their dealer networks, geographic reach, and innovation engines to bolster smart furniture offerings and capture synergies in hybrid work demand. Teknion has recently entered into a strategic partnership with UK-based Modus, expanding its collaborative product portfolio while supporting Modus’s international growth strategy.
Additionally, to streamline its operations and respond to evolving customization demands, Teknion has adopted Cyncly’s Insight ERP software, greatly improving manufacturing efficiency and accelerating custom furniture delivery. These operational partnerships and acquisitions geared more toward capability expansion and product innovation.
List of Key U.S. Smart Furniture Companies
-
Teknion Corporation
-
HON (Brand of HNI Corporation)
-
Sobro
-
MillerKnoll Inc.
-
Sleep Number Corporation
-
Steelcase Inc.
-
Haworth Inc.
-
Versa Desk
-
Krueger International
-
Ori Living
-
Evodesk
-
Uplift Desk
-
Humanscale International Holdings Ltd.
-
Eight Sleeps
-
iMovR
-
Autonomous
-
Inter IKEA Systems B.V
What are the Latest Key Industry Developments?
-
In August 2025, HNI Corporation announced its plan to acquire Steelcase Inc. in a USD 2.2 billion deal, aiming to strengthen its position in the office furniture market. The acquisition is expected to close by the end of 2025, with HNI shareholders owning about 64% of the combined company.
-
In July, 2025, Eight Sleep introduced the Pod 4, a high-tech mattress cover offering dual-zone climate control, advanced sleep tracking, and a silent wake-up feature positioning itself as a compelling, tech-rich alternative in sleep comfort.
-
In December, 2024, MillerKnoll declared that beginning May 2025, all its North American products will be free from added PFAS chemicals, becoming the first major furniture maker to make this move, underlining its leadership in health-conscious sustainability.
-
In October, 2024, Sleep Number unveiled the ClimateCool smart bed, featuring dual side active cooling enhanced by SmartTemp programs developed with Northwestern University’s Feinberg School of Medicine, providing personalized temperature regulation for deeper, more comfortable sleep.
What are the Key Factors Influencing Investment Analysis & Opportunities In The U.S. Smart Furniture Market?
Investment interest in the U.S. smart furniture market is accelerating, driven by rising consumer demand for ergonomic, tech-integrated solutions that cater to hybrid work models and wellness-conscious lifestyles. Funding trends reveal a growing appetite among venture capitalists and private equity firms for companies focused on smart workstations, sleep tech, and modular connected furniture. Startups offering data-driven personalization and IoT-enabled solutions, such as climate-controlled beds or app-synced desks, have seen upward momentum in valuations.
Valuations are also benefiting from the convergence of health, productivity, and home automation trends, positioning smart furniture as a cross-sector innovation play. Major investment hotspots include urban tech hubs like San Francisco, Austin, and Boston, where smart home adoption, tech-savvy consumers, and proximity to hardware and AI innovation ecosystems amplify market potential. With workplace transformation and wellness design continuing to shape the built environment, the sector is poised for sustained investor confidence and scalable growth opportunities.
Key Benefits for Stakeholders:
Next Move Strategy Consulting (NMSC) presents a comprehensive analysis of the u.s. smart furniture market, covering historical trends from 2020 through 2024 and offering detailed forecasts through 2030. Our study examines the market at global, regional, and country levels, providing quantitative projections and insights into key growth drivers, challenges, and investment opportunities across all major U.S. Smart Furniture segments.
Report Scope:
|
Parameters |
Details |
|
Market Size in 2025 |
USD 228.9 Million |
|
Revenue Forecast in 2030 |
USD 357.1 Million |
|
Growth Rate |
CAGR of 9.3% from 2025 to 2030 |
|
Analysis Period |
2024–2030 |
|
Base Year Considered |
2024 |
|
Forecast Period |
2025–2030 |
|
Market Size Estimation |
Million (USD) |
|
Growth Factors |
|
|
Companies Profiled |
15 |
|
Market Share |
Available for 10 companies |
|
Customization Scope |
Free customization (equivalent to up to 80 analyst-working hours) after purchase. Addition or alteration to country, regional & segment scope. |
|
Pricing and Purchase Options |
Avail customized purchase options to meet your exact research needs. |
|
Approach |
In-depth primary and secondary research; proprietary databases; rigorous quality control and validation measures. |
|
Analytical Tools |
Porter's Five Forces, SWOT, value chain, and Harvey ball analysis to assess competitive intensity, stakeholder roles, and relative impact of key factors. |
Key Market Segments
By Product Type
-
Smart Tables & Desks
-
Smart Stools & Benches
-
Smart Chairs
-
Smart Bed
By End-User
-
Residential
-
Commercial
By Distribution Channel
-
B2C/Retail
-
Big‑box/Home Centres
-
Specialty Furniture Stores
-
E‑commerce
-
-
Contract (B2B Projects & Fit‑Outs)
Conclusion & Recommendations
Our report equips stakeholders, industry participants, investors, policy-makers, and consultants with actionable intelligence to capitalize on U.S. Smart Furniture’s transformative potential. By combining robust data-driven analysis with strategic frameworks, NMSC’s U.S. Smart Furniture Market Report serves as an indispensable resource for navigating the evolving landscape.
")


About the Author
 Sikha Haritwal is a researcher with more than 5 years of experience. She has been keeping a close eye on several industry verticals, including construction & manufacturing, personal care products, and consumer electronics. She has avid interest in writing news articles and hopes to use blog as a platform to share her knowledge with others.
About the Reviewer
 Supradip Baul is an accomplished business consultant and strategist with over a decade of rich experience in market intelligence, strategy, technology and business transformation. His work has included rigorous qualitative and quantitative analysis across multiple industries, helping clients shape investment decisions and long-term roadmaps. Earlier in his career, he was associated with Gartner, where he contributed to industry-leading reports and market share analyses. He has worked with leading global companies and holds an MBA with a dual specialization in Marketing and Finance.
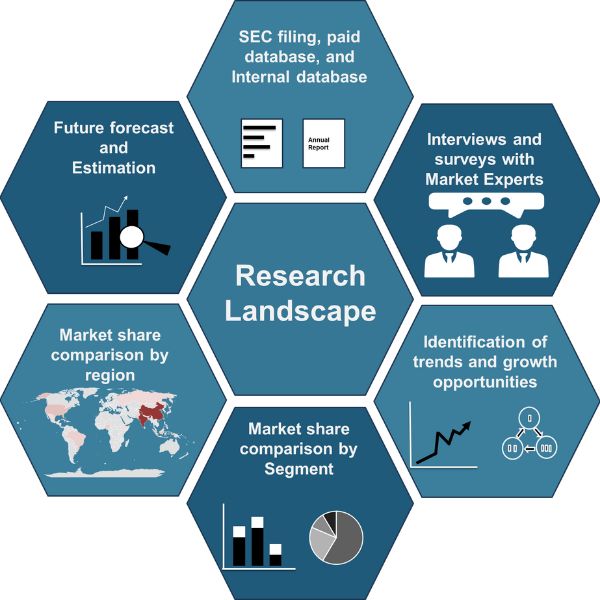
At Next Move Strategy Consulting, we understand that insightful market research is the cornerstone of successful business decisions. That's why we employ a robust and multifaceted approach, combining various methodologies to deliver the most accurate and actionable data for our clients.
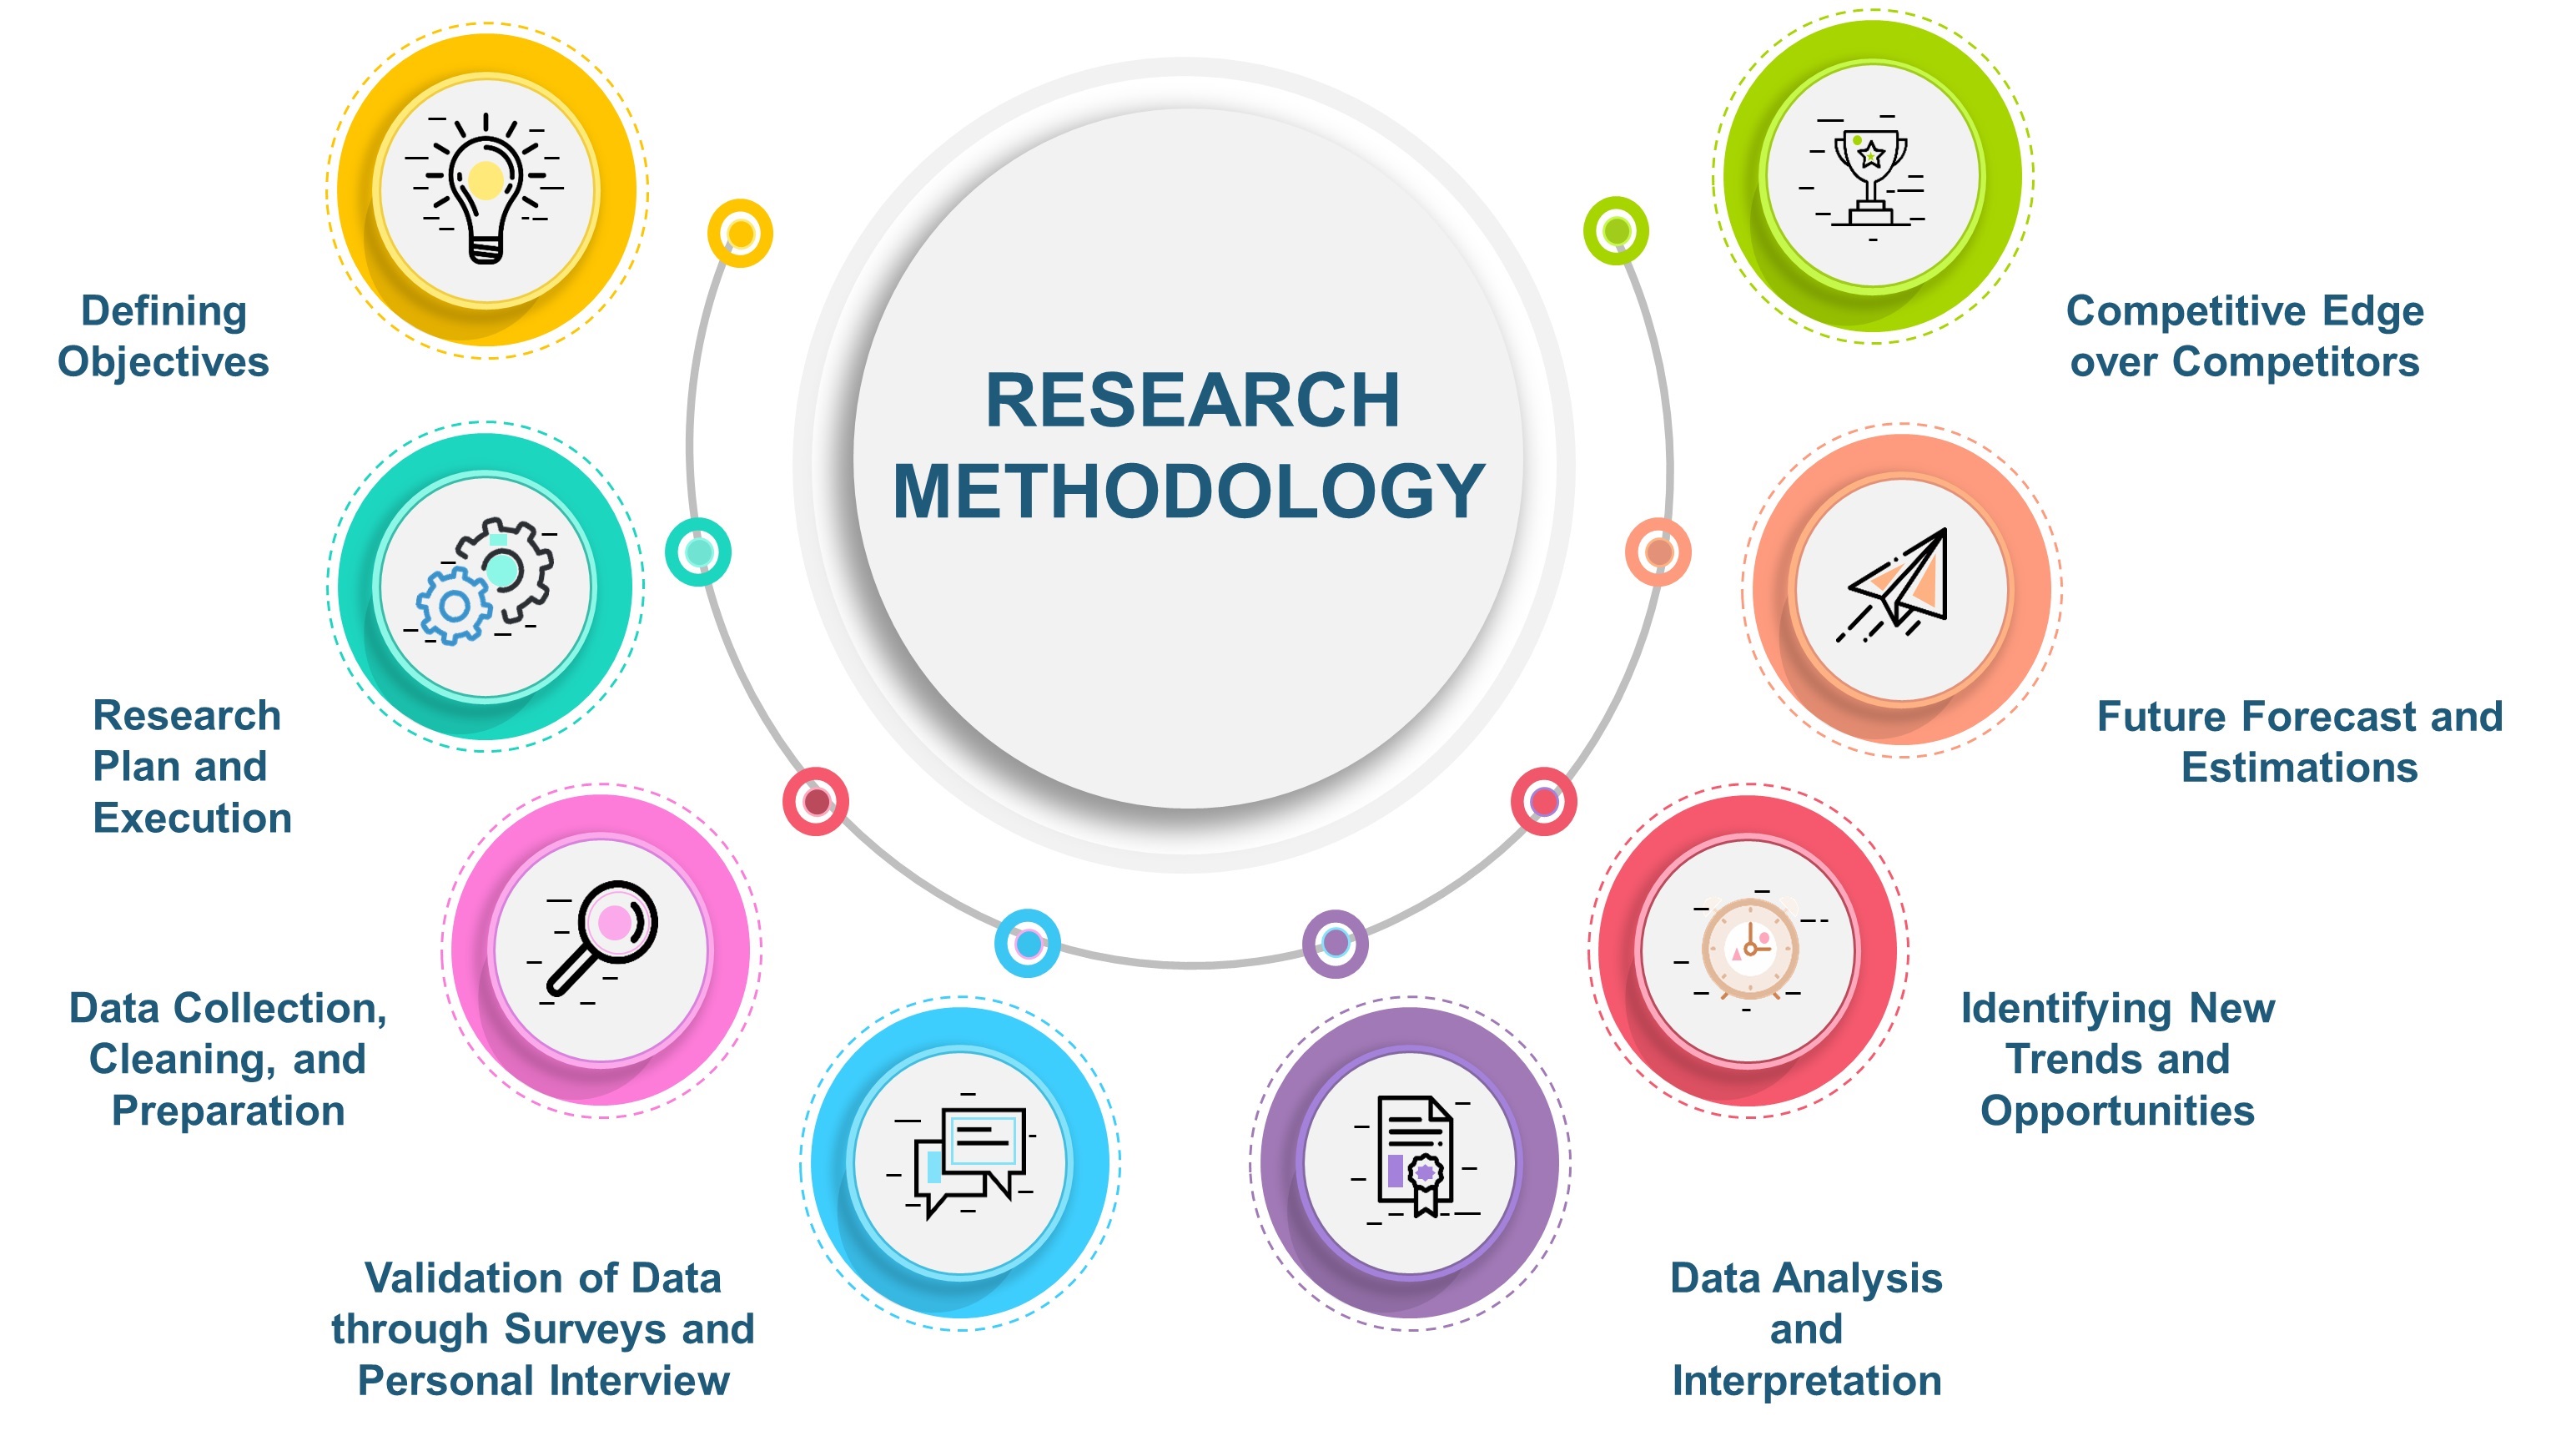
Research Landscape
We navigate the world of research with two primary approaches:
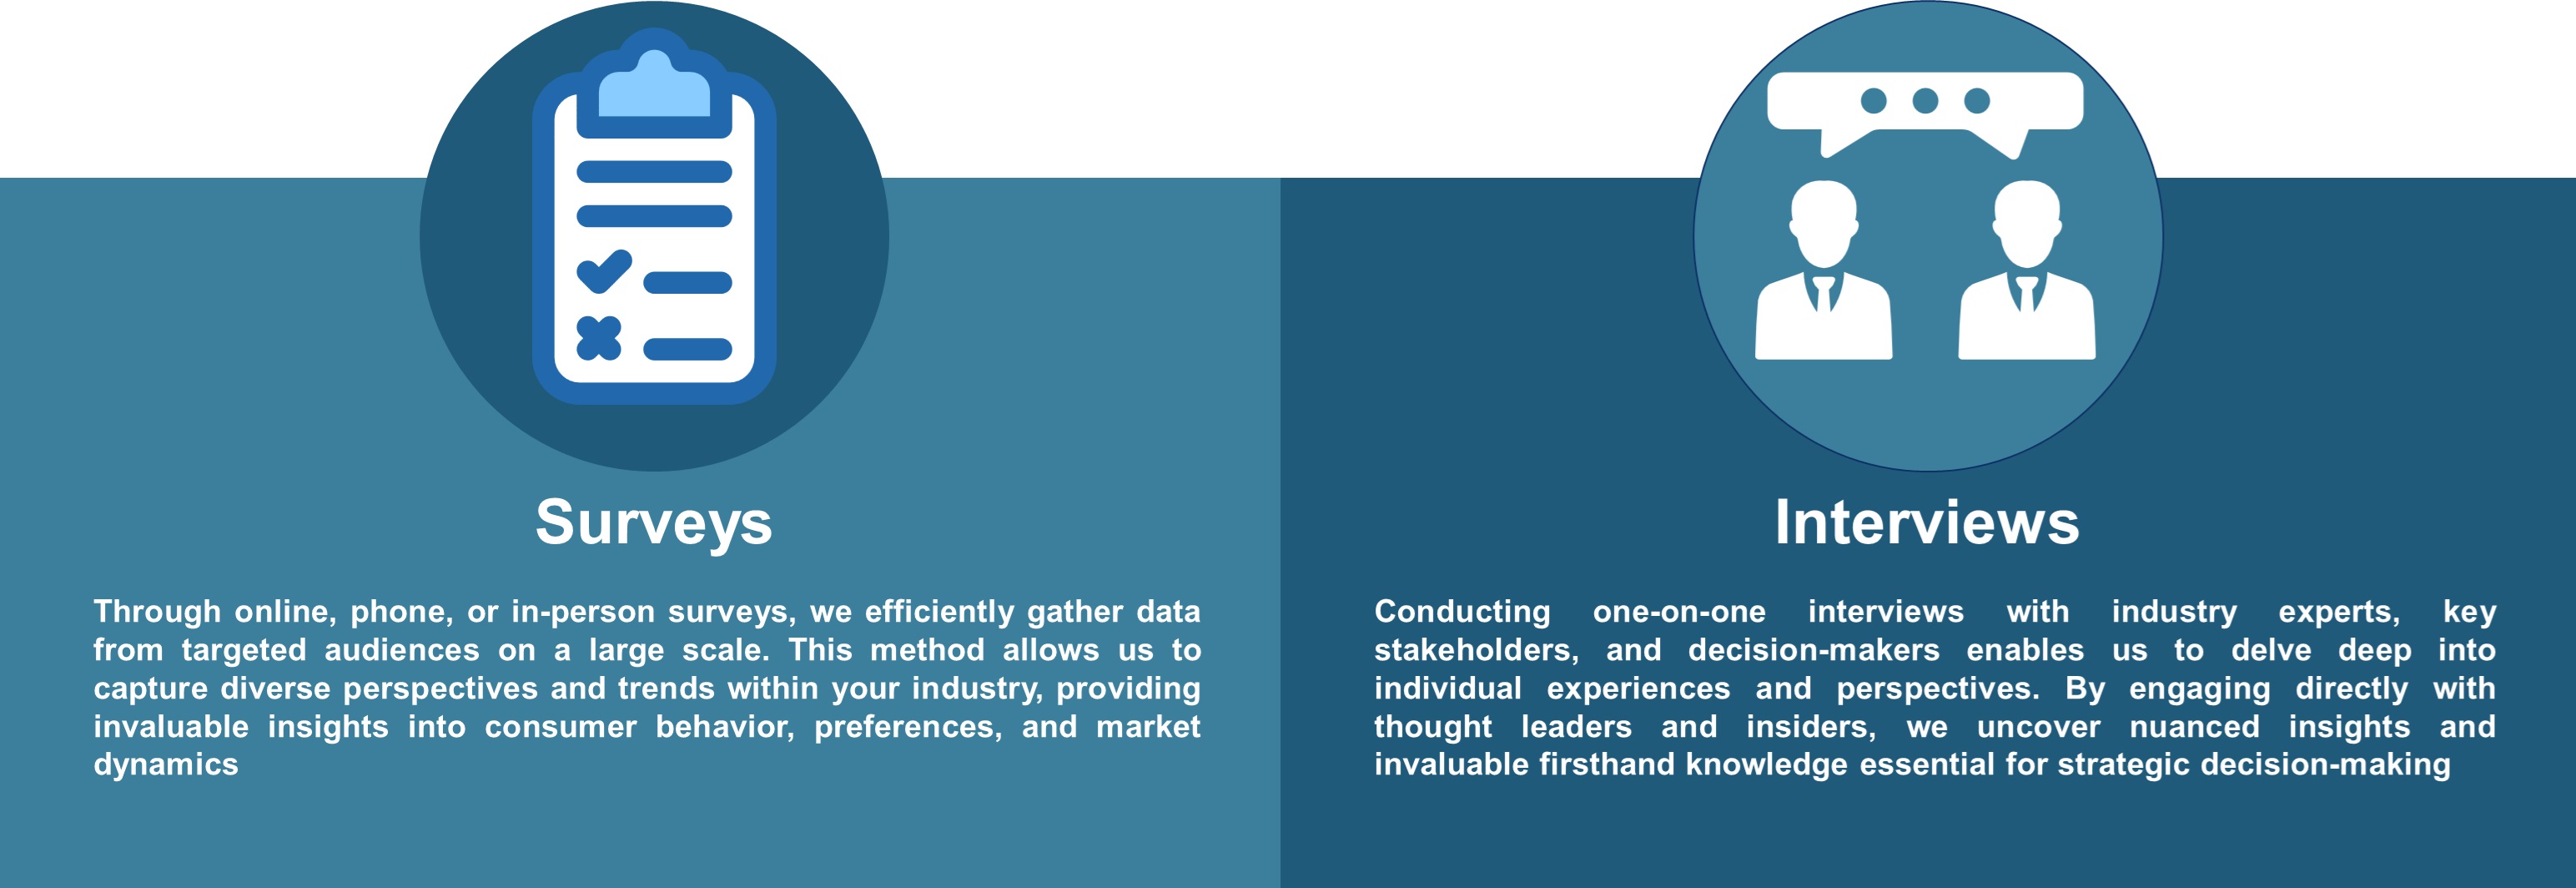
Qualitative Approach
Our qualitative research methodologies involve immersive techniques such as in-depth interviews, focus groups, and observational studies. By engaging directly with individuals and stakeholders, we uncover valuable insights that quantitative data alone may overlook.
Quantitative Research
In tandem with qualitative methodologies, NMSC leverages the power of Quantitative Research to provide a robust foundation of numerical insights. Through systematic data collection and analysis, we quantify patterns, preferences, and market trends, offering a comprehensive view of the business landscape.
Our quantitative research approach employs diverse tools, including surveys, experiments, and statistical modelling. These methodologies enable us to gather data from a large and representative sample, ensuring the statistical significance of our findings. By employing structured questionnaires and standardized data collection methods, we guarantee the reliability and validity of the information we present to our clients.
Quantitative research is particularly effective in measuring the prevalence of trends, assessing market size, and gauging the impact of various factors on consumer behavior. The numerical precision attained through this approach equips our clients with actionable insights, facilitating data-driven decision-making and strategy formulation.
Our Specialized Toolbox for Industry-Specific Market Research
We deploy a specialized arsenal of techniques tailored to meet your unique requirements. Here's a glimpse into our comprehensive toolbox:
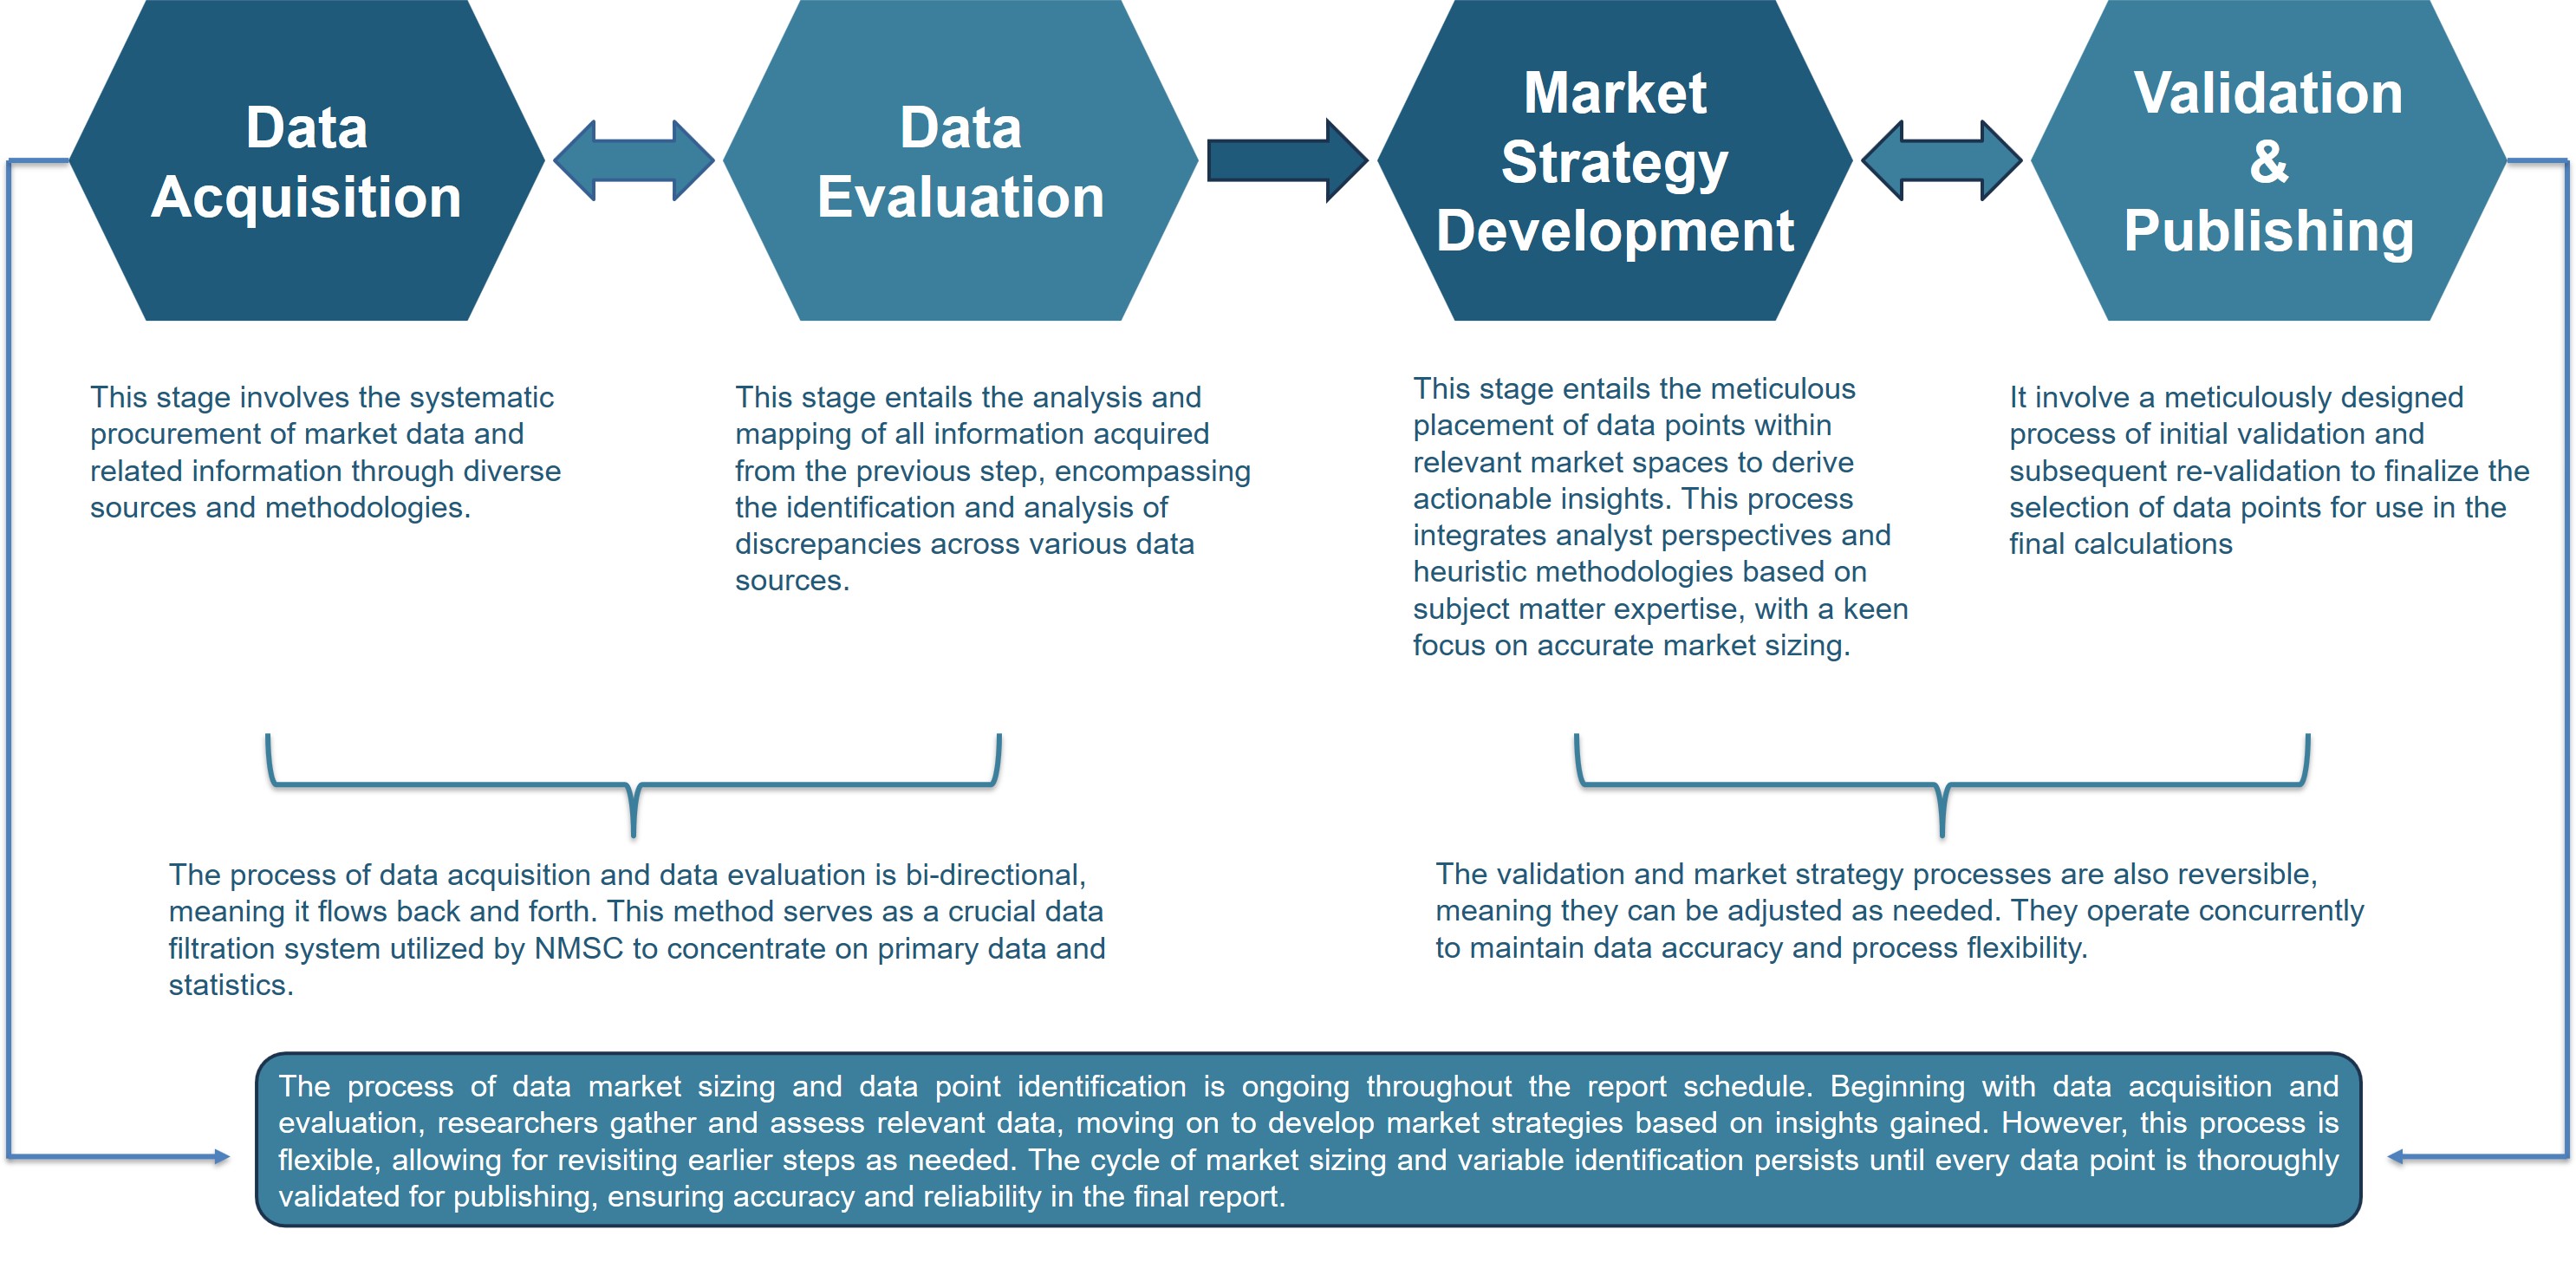
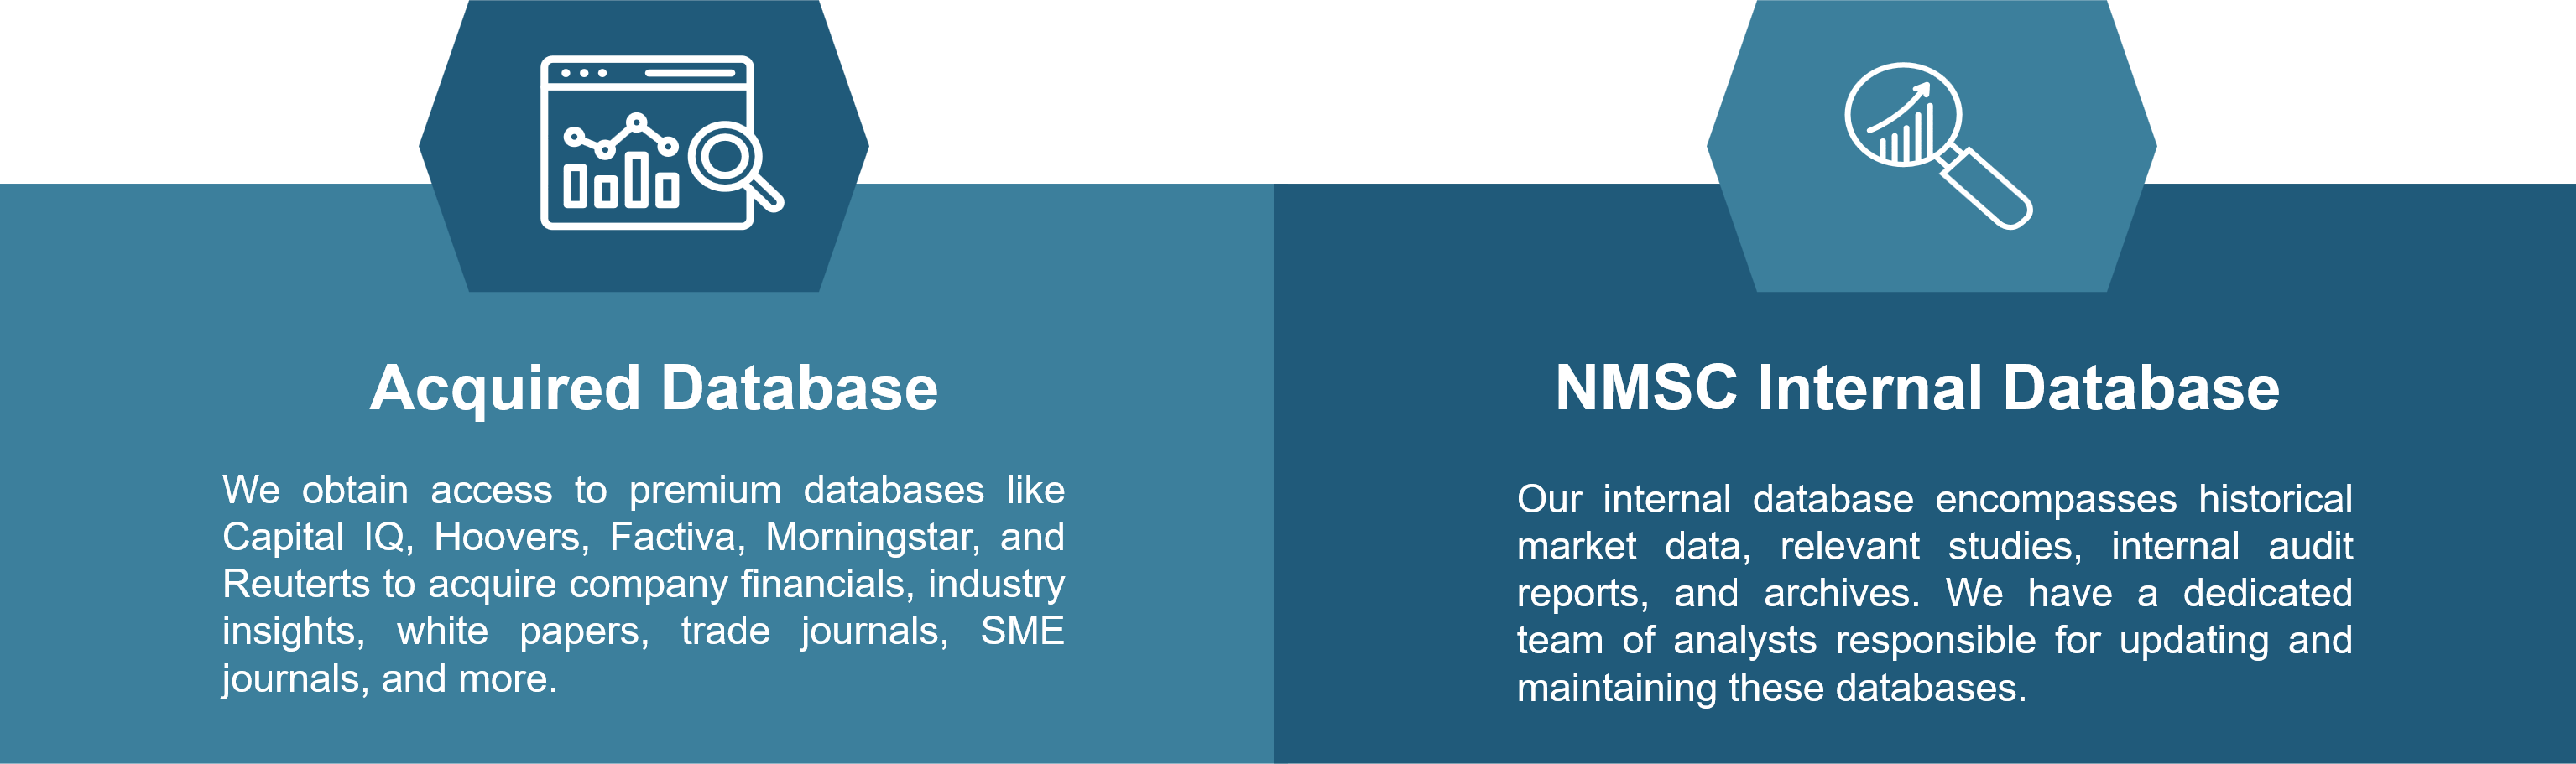
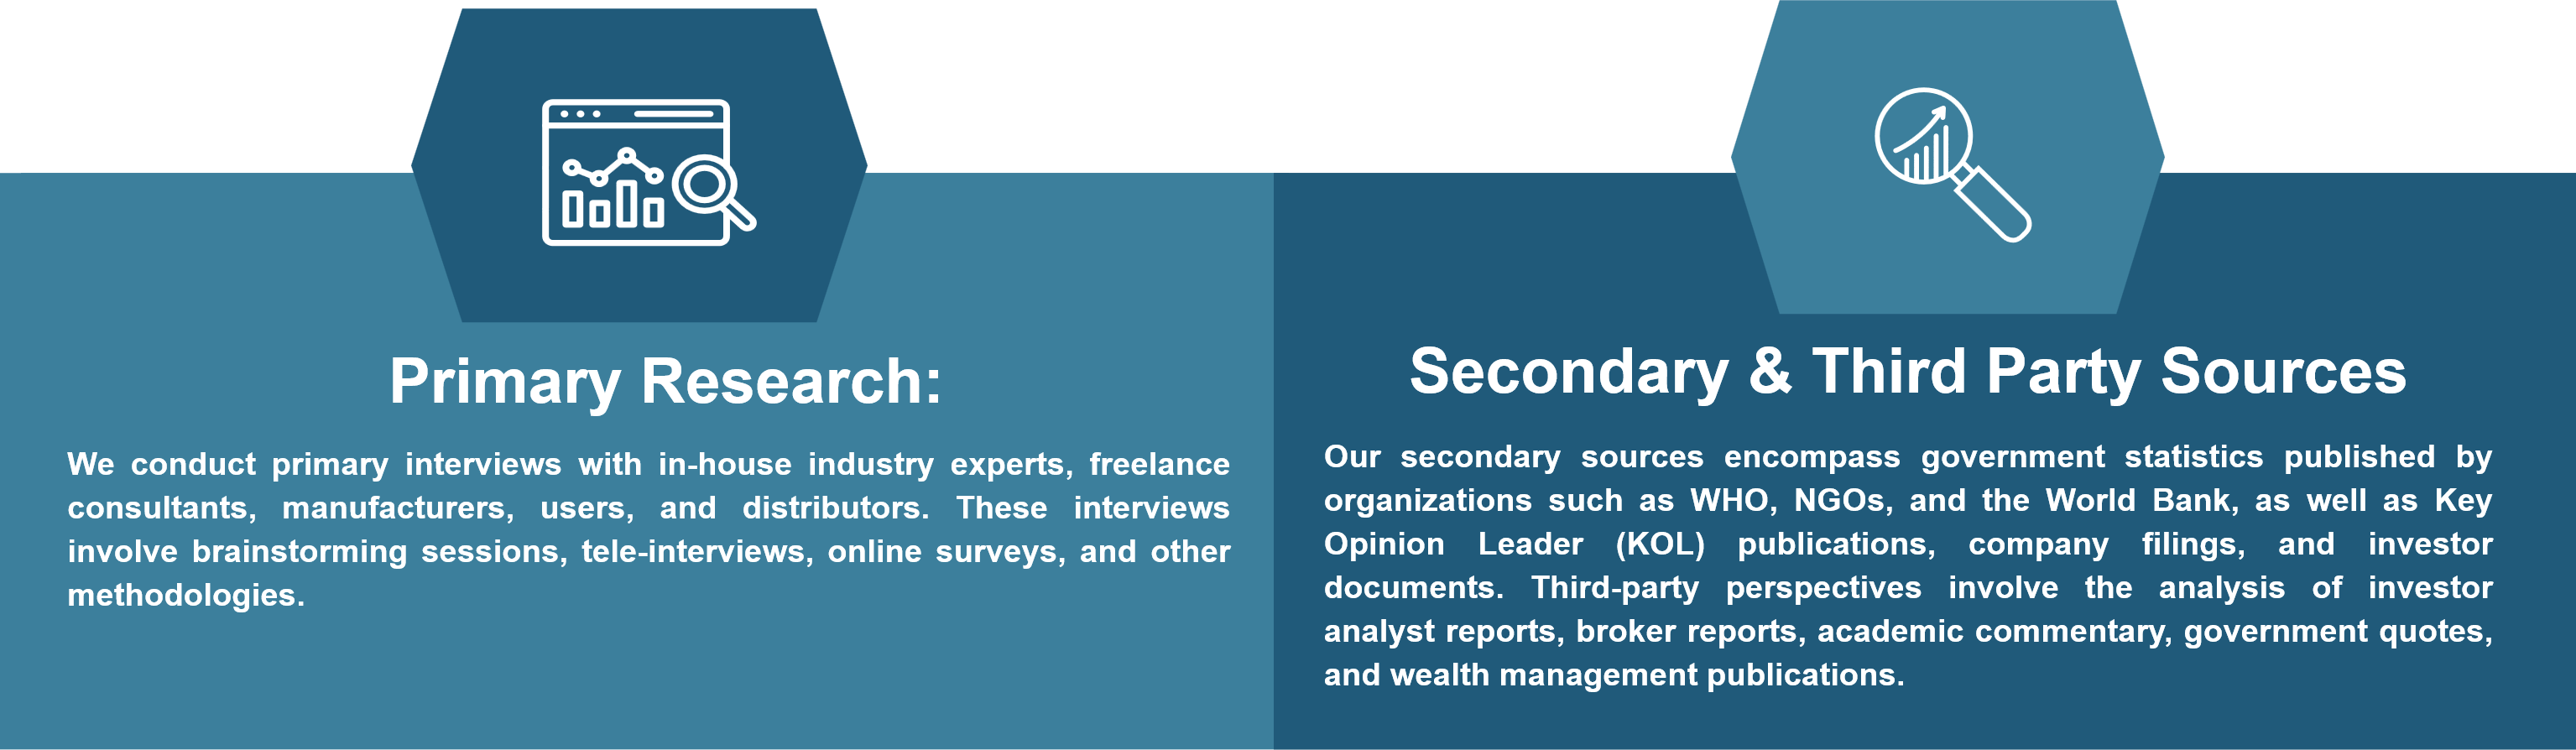
Information Procurement
The stage entails acquiring market data or relevant information through various sources and methodologies.
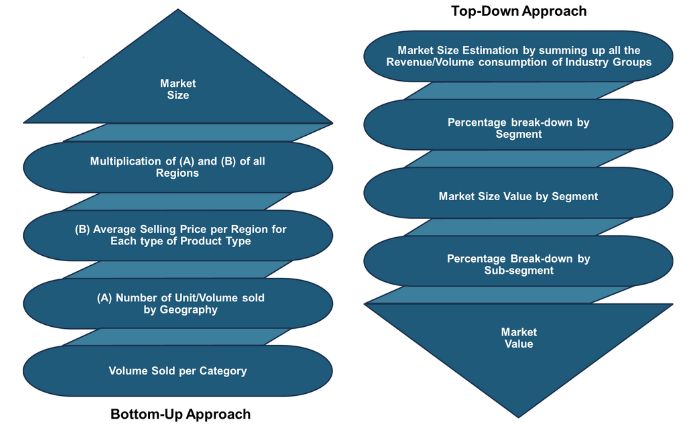
Market Research Approach
We utilize both top-down and bottom-up approaches in market research analysis to achieve a comprehensive understanding of the market dynamics, leveraging the broad perspective of industry trends and macroeconomic factors alongside detailed insights from specific segments and individual companies.
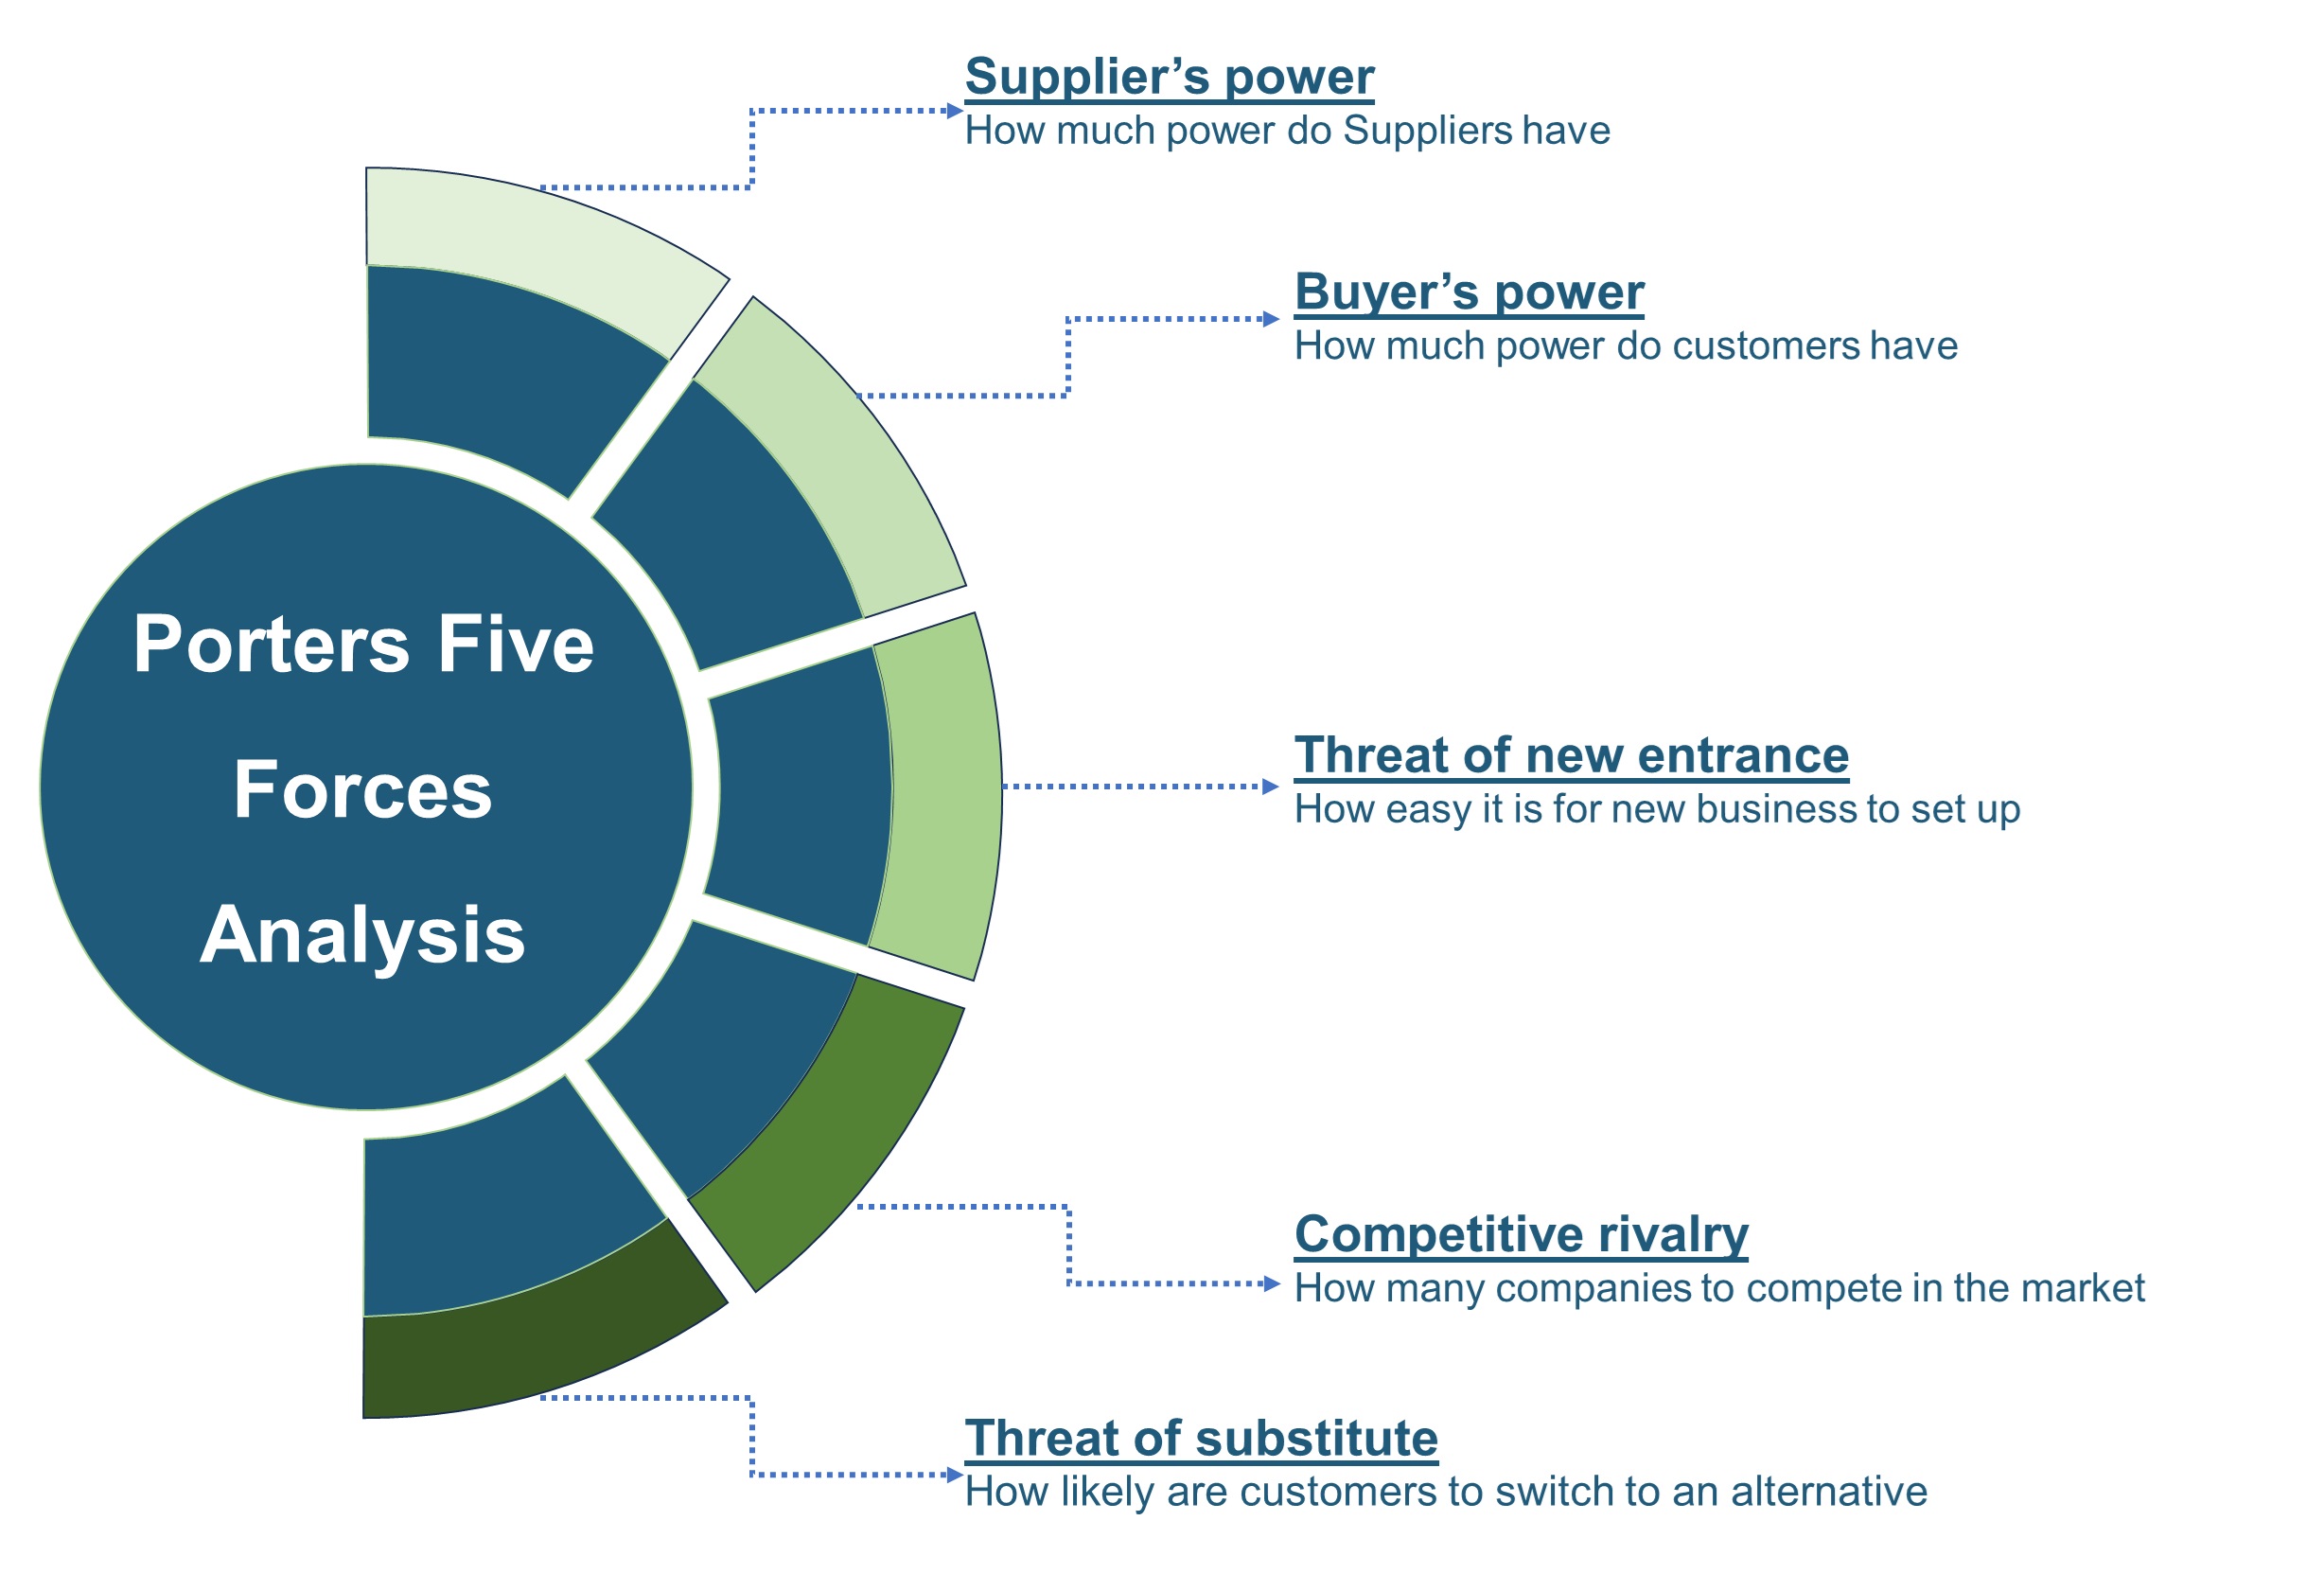
Porters Five Forces Analysis
We conduct Porter's Five Forces analysis to evaluate the competitive landscape of an industry, providing us with insights into factors that affect profitability and strategic positioning.
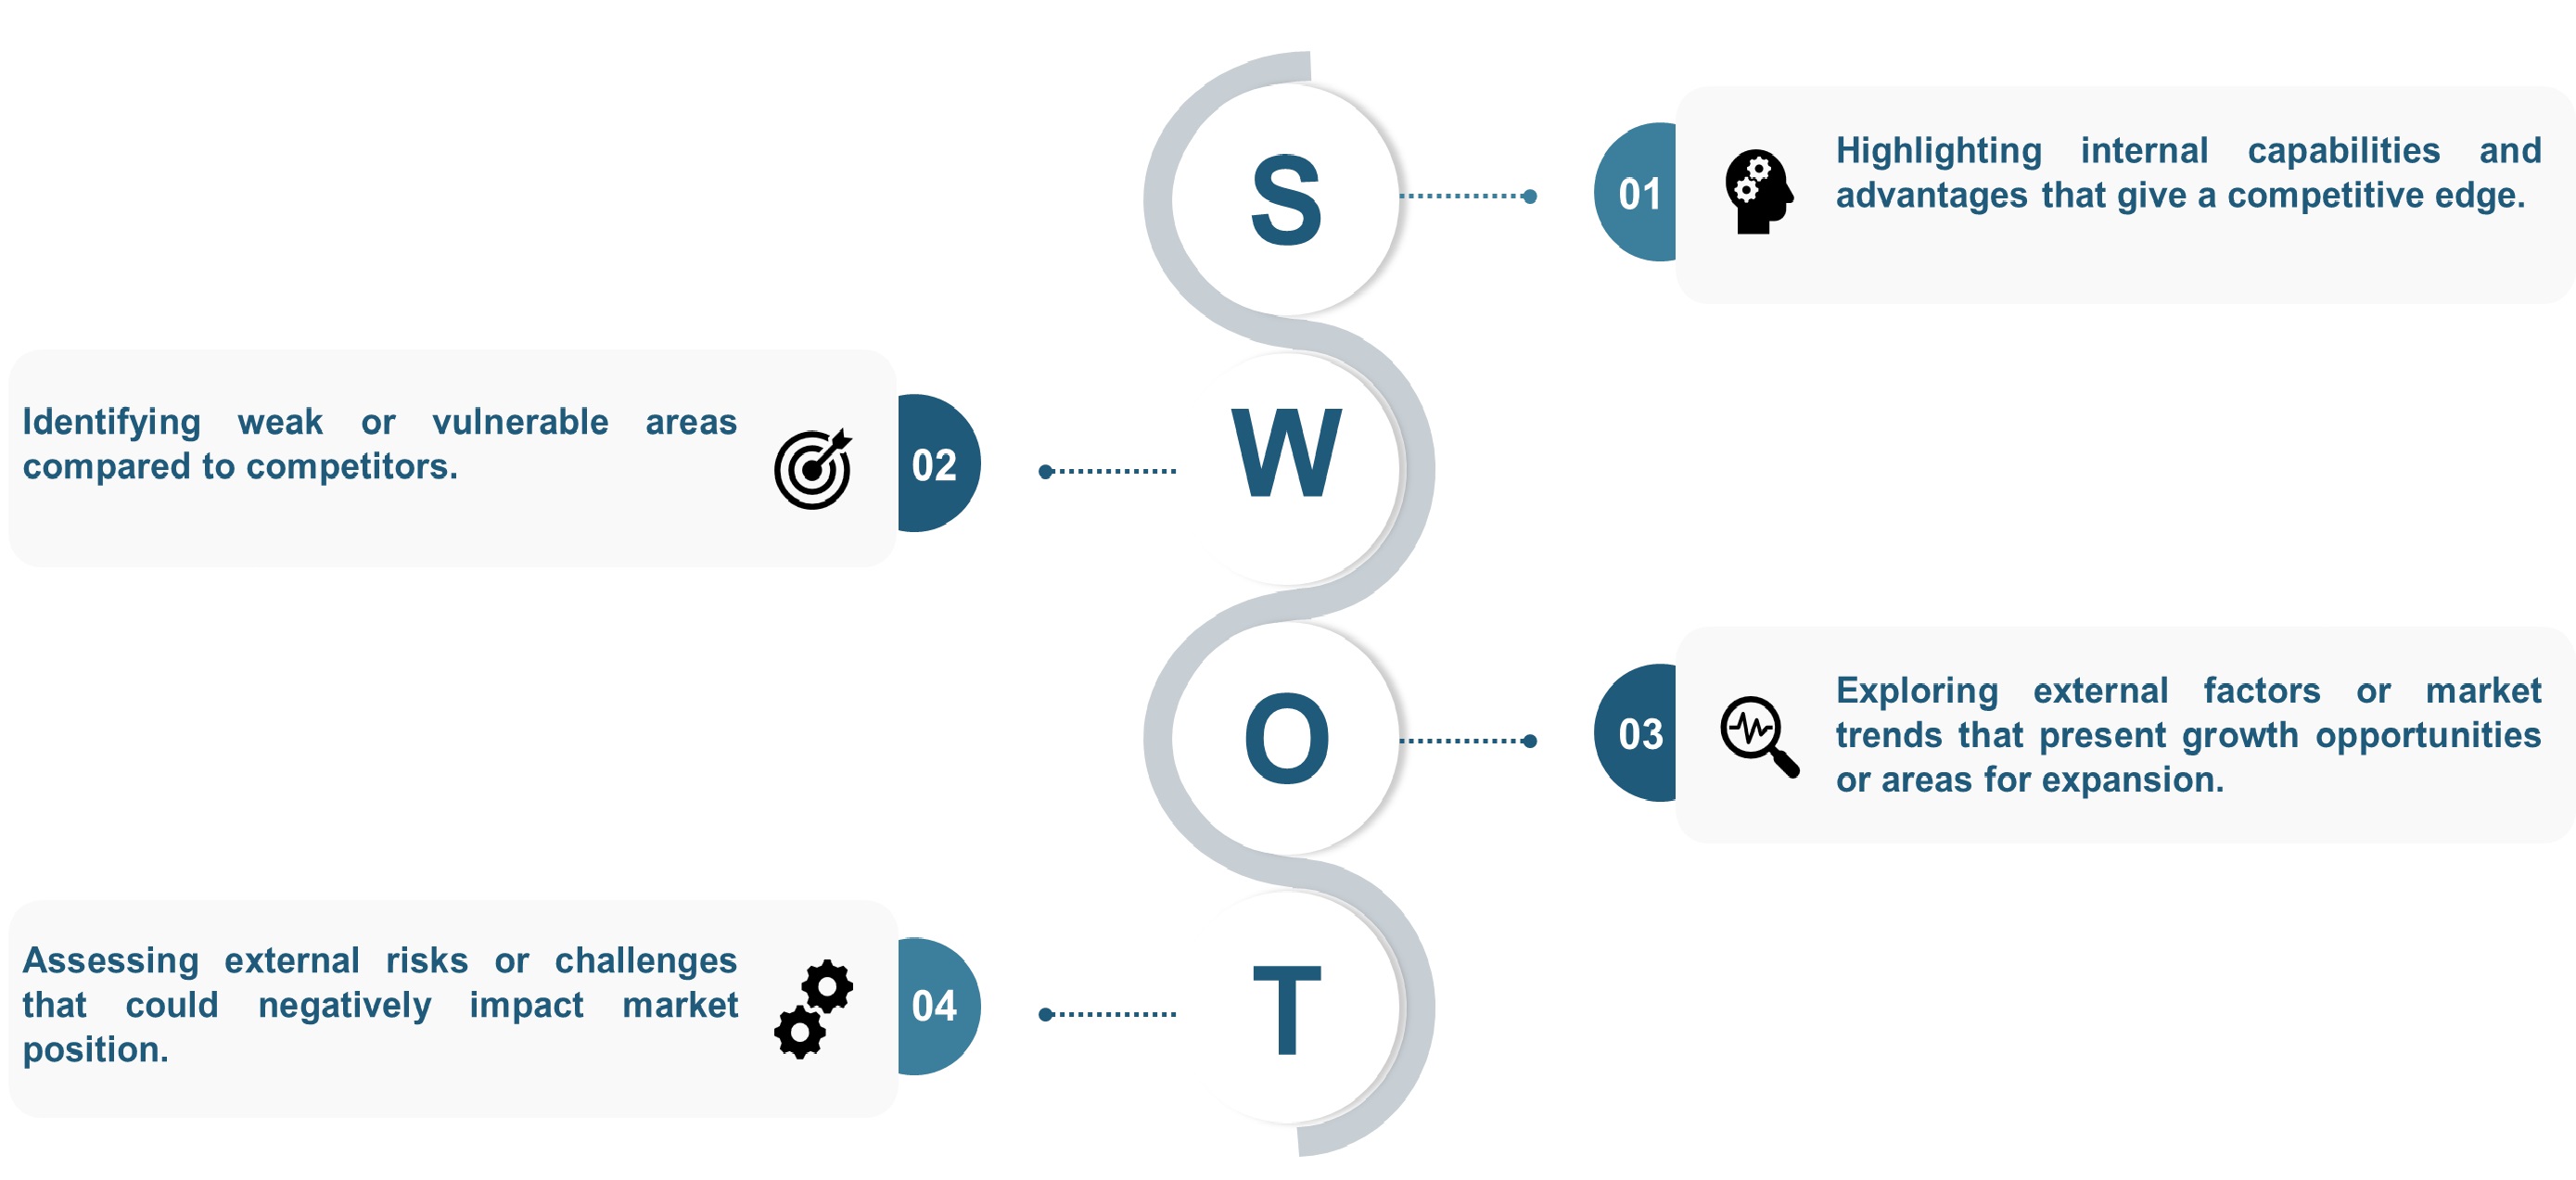
SWOT Analysis
We conduct SWOT analysis to understand market trends, identify potential threats, capitalize on opportunities, and assess our strengths and weaknesses.
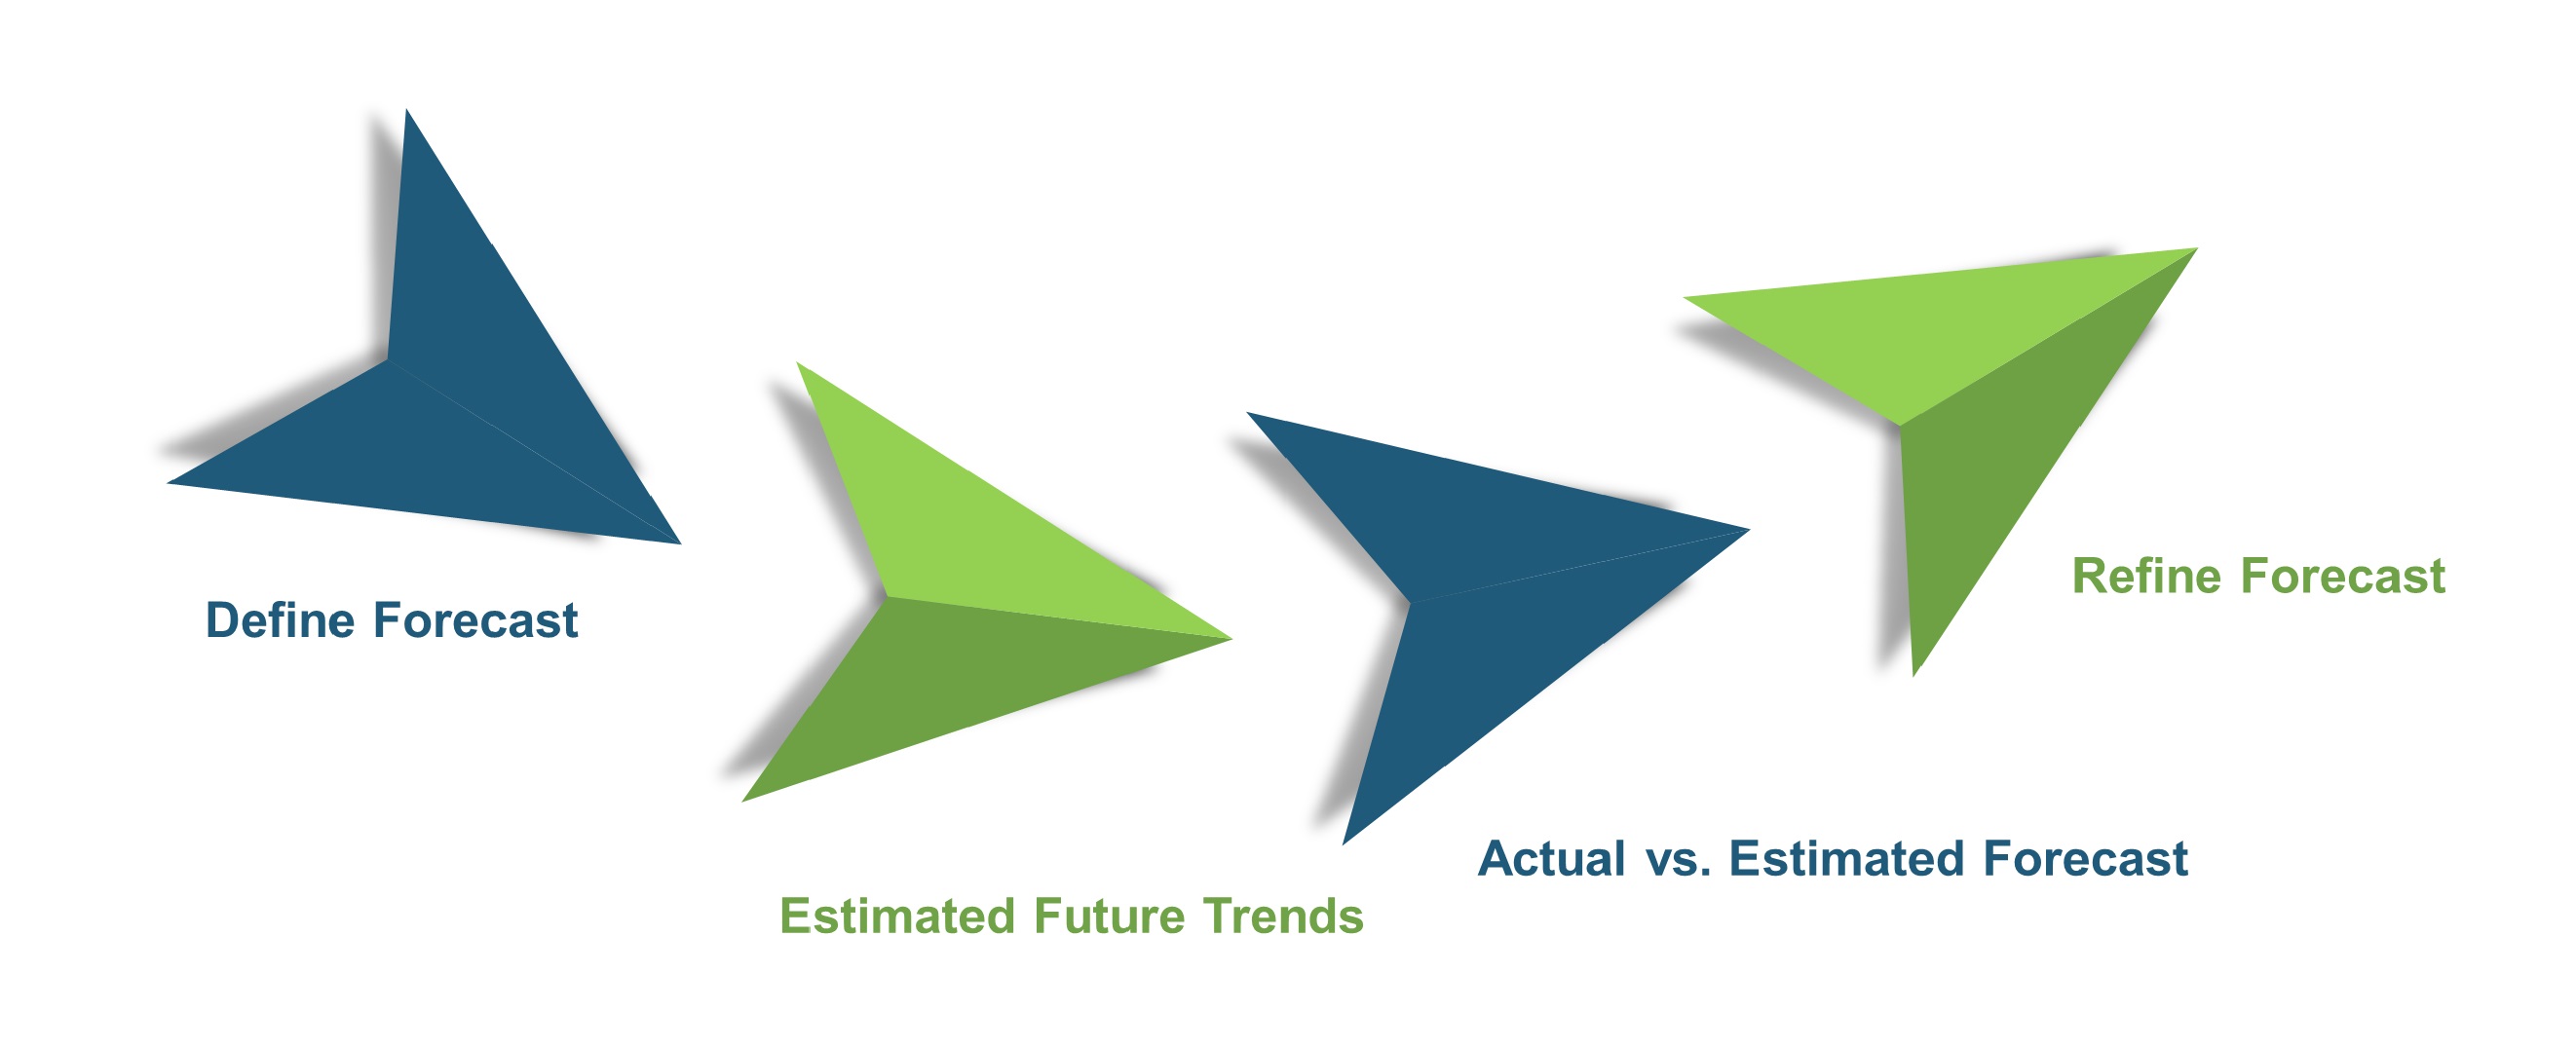
Forecasting
We utilize a forecasting model to predict future consumption by considering parameters like population, economics, regulations, market competition, drivers, constraints, technology, and pricing. We also employ statistical techniques such as multilinear regression, exponential smoothing, moving average, ARIMA, and Monte Carlo simulations for accurate predictions. In econometric forecasting, we analyzed short-term and long-term event impacts, attributing values based on regulatory frameworks, economic factors, and market events.


 Speak to Our Analyst


 Equipment Market")