Virtual Private Server Market Global Industry Analysis and Forecast (2026–2035)

Virtual Private Server Market size was USD 6.69 Billion in 2025, projected to reach USD 34.00 Billion by 2035, growing at a CAGR of 15.3% from 2026 to 2035. Key drivers include small business digitization, GPU workload demand, and cost-focused cloud migration, with North America leading the market.

Download Free Sample PDF
Base Year (2025)
$6.69 Billion
Forecast (2035)
$34.00 Billion
CAGR (2026-2035)
15.3%
Top Region
North America

What Is the Virtual Private Server Market Size?

The global Virtual Private Server Market reached USD 6.69 Billion in 2025 and is estimated at USD 9.42 Billion in 2026, forecast to reach USD 34.00 Billion by 2035 at a CAGR of 15.3% from 2026–2035. North America leads with roughly a 35% share, while Unmanaged VPS accounts for approximately 50% of 2025 revenue.

Based on our analysis, we identified that market growth concentrates primarily in GPU instances, cloud marketplace distribution, and metered billing models.

Virtual Private Server Market Global Industry Analysis and Forecast (2026–2035) Revenue Forecast

Values in USD Billion

2025 $6.69 Billion
2025
2026 $9.42 Billion
2026
2027 $10.86 Billion
2027
2028 $12.52 Billion
2028
2029 $14.44 Billion
2029
2030 $16.65 Billion
2030
2031 $19.20 Billion
2031
2032 $22.13 Billion
2032
2033 $25.52 Billion
2033
2034 $29.42 Billion
2034
2035 $34.00 Billion
2035

Key Takeaways

By Service Type: Unmanaged VPS held the largest share, expanding from USD 3.35 Billion in 2025 to USD 14.62 Billion by 2035; Fully Managed VPS is the fastest-growing at 17.7% CAGR from 2026–2035.

By Operating System: Linux Operating System held the largest share, expanding from USD 4.95 Billion in 2025 to USD 24.48 Billion by 2035; Windows Server is the fastest-growing at 16.6% CAGR from 2026–2035.

By Resource Workload Configuration: General Purpose VPS held the largest share, expanding from USD 4.15 Billion in 2025 to USD 15.64 Billion by 2035; GPU-Accelerated VPS is the fastest-growing at 31.3% CAGR from 2026–2035.

By Customer Size: Employer Organizations held the largest share, expanding from USD 4.68 Billion in 2025 to USD 26.52 Billion by 2035; Large Organizations is the fastest-growing at 19.2% CAGR from 2026–2035.

By Sales Channel: Direct Online Self-Service held the largest share, expanding from USD 3.08 Billion in 2025 to USD 12.92 Billion by 2035; Third-Party Cloud Marketplace is the fastest-growing at 23.2% CAGR from 2026–2035.

By Billing Model: Fixed Subscription held the largest share, expanding from USD 3.01 Billion in 2025 to USD 13.26 Billion by 2035; Per-Second Instance Usage is the fastest-growing at 25.2% CAGR from 2026–2035.

By End-User Industry: Information and Communication held the largest share, expanding from USD 2.21 Billion in 2025 to USD 9.86 Billion by 2035; Manufacturing is the fastest-growing at 17.7% CAGR from 2026–2035.

Dominant Region: North America held the largest share, expanding from USD 2.34 Billion in 2025 to USD 9.86 Billion by 2035.

Fastest-Growing Region: Asia-Pacific grows at 18.6% CAGR from 2026–2035, reaching USD 12.24 Billion by 2035.

Dominant Country: The U.S. led with USD 1.92 Billion in 2025, rising to USD 7.89 Billion by 2035.

Fastest-Growing Country: India grows at 25.0% CAGR from 2026–2035, from USD 0.18 Billion in 2025 to USD 2.08 Billion by 2035.

The Virtual Private Server Market presents an absolute opportunity of approximately USD 24.58 Billion between 2026 and 2035, which supports sustained investment in server capacity, managed layers, and regional hosting footprints.

According to NMSC analysis, GPU-Accelerated VPS grows at 31.3% CAGR from 2026–2035 while General Purpose VPS expands at 11.9%, which shows that AI-capable instances rather than standard compute are the main source of incremental revenue.

Ecosystem Analysis of the Virtual Private Server Industry

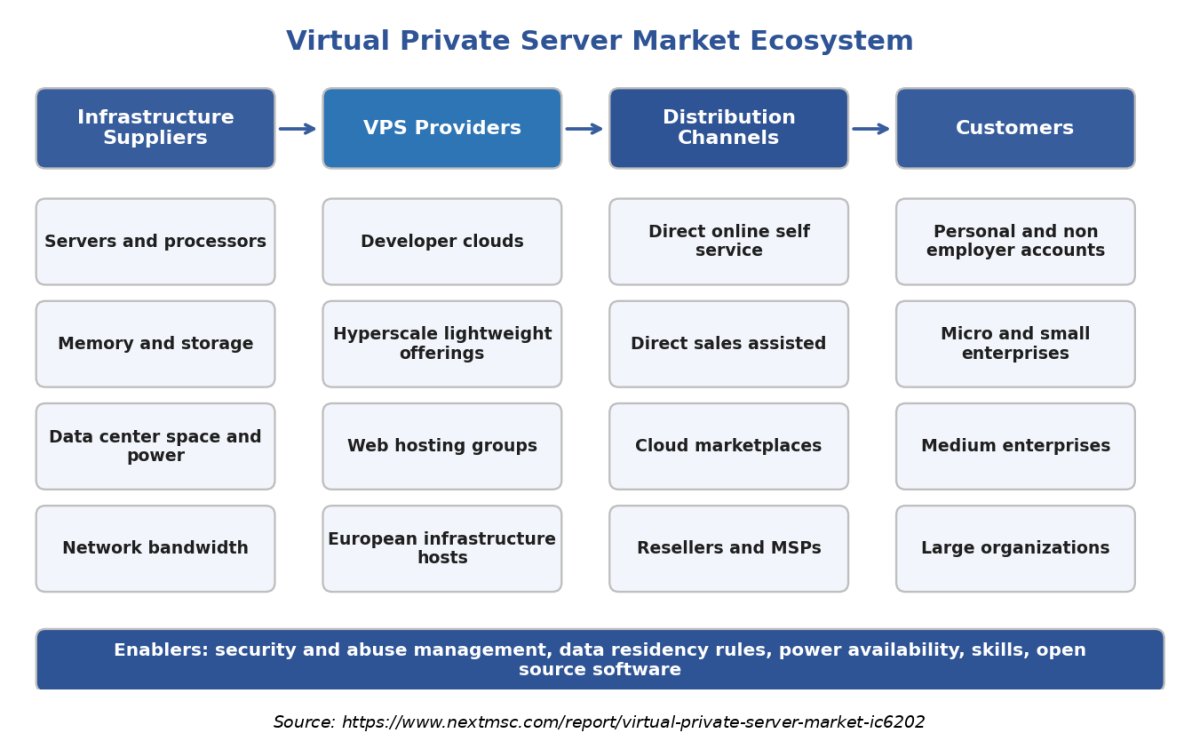
The above infographic presents the ecosystem in a simplified form, tracing how infrastructure suppliers, hosting providers, distribution channels, and customers connect. Data center operators and hardware vendors supply servers, memory, storage, and bandwidth, while providers virtualize that capacity into instances with managed or unmanaged support. Direct self-service, marketplaces, and resellers move those instances to developers, small businesses, and enterprises. Security practices, data residency rules, power availability and skills act as enablers at every step.

What does the Virtual Private Server Market Encompass?

The Virtual Private Server Market covers the sale of isolated virtual server instances that give customers dedicated allocations of processor, memory, storage and network capacity on shared physical hardware. It spans fully managed, semi-managed and unmanaged services, Linux, Windows and BSD environments, and general purpose, compute, memory, storage and GPU configurations. Dedicated physical servers, shared web hosting plans and serverless functions sit outside the scope of this study.

Adoption keeps rising, since the share of EU enterprises buying paid cloud computing services grew by 7.42 percentage points between 2023 and 2025, and large enterprises reached 84.67%. Small enterprises stood at 49.3%, which shows the headroom that low-cost virtual servers can address. Across the European Union, 26 countries also recorded higher enterprise use of artificial intelligence in 2025 than in 2024, which supports demand for flexible compute.

Market Drivers & Dynamics

Interactive Dataset
Digitization of small businesses and developers moving to cloud hosting driver +3.4% Global 2026–2035
AI and GPU workloads moving onto virtual servers driver +2.8% North America, Asia-Pacific 2026–2033
Cost optimization as buyers shift from larger cloud bundles driver +2.2% North America, Europe 2026–2031
Cloud marketplace and reseller distribution lowering buying friction driver +1.4% Global 2026–2032
Demand for managed layers as in house skills stay scarce driver +1.2% Europe, Asia-Pacific 2026–2034
Regional hosting and data residency requirements driver +1.0% Europe, Middle East & Africa 2026–2032
Price competition and commoditization of entry-level instances restraint −2.4% Global 2026–2031
Hardware supply, memory cost and power constraints restraint −1.9% Global 2026–2029
Security, abuse and compliance operating costs restraint −1.2% Global 2026–2033
Source: Next Move Strategy Consulting

Growth Drivers

What Is the Primary Growth Driver in the Virtual Private Server Industry?

Digitization of small businesses and developers is the primary driver because virtual servers offer dedicated resources at a low monthly cost. Across the European Union, only 49.3% of small enterprises bought paid cloud computing services in 2025, compared with 84.67% of large enterprises, which leaves a wide adoption gap. According to our analytical model and Eurostat enterprise cloud adoption data, this migration accounts for an estimated 3.4 percentage points of the forecast CAGR.

How Is AI Demand Driving the Market Growth?

AI workloads add compute-hungry customers to a historically low-price category. DigitalOcean reported AI customer annual run rate revenue growth of 212% in its second quarter of 2026, and our model shows GPU-Accelerated VPS rising from USD 0.27 Billion in 2025 to USD 5.78 Billion by 2035. We estimate that AI and GPU demand contributes 2.8 percentage points of the forecast CAGR across the industry.

Growth Inhibitors

What Is Restraining the Virtual Private Server Market?

Price competition and hardware costs restrain margins and the pace of expansion. Hyperscale platforms and large web hosting groups price entry-level instances aggressively, while memory, accelerator, and power constraints raise the cost of adding capacity. Security, abuse handling, and compliance also add operating costs for providers that sell unmanaged servers at low prices. We estimate that these constraints reduce the forecast CAGR by 5.5 percentage points in aggregate.

What Are the Growth Opportunities?

Can GPU Virtual Servers Become a Mainstream Developer Product?

GPU-Accelerated VPS grows at a 31.3% CAGR from 2026–2035, rising from about 4% to 17% of revenue by our estimate. Startups, research teams, and small software firms need accelerators for inference and testing without long contracts. Developer clouds and infrastructure providers with GPU supply gain the most, particularly when they pair instances with simple pricing and ready software images.

Will Cloud Marketplaces Expand Reach for Smaller Providers?

Third-Party Cloud Marketplace is the fastest-growing sales channel at 23.2% CAGR from 2026–2035, rising from 8% to 16% of revenue by our estimate. Marketplace listings let providers reach buyers who use committed cloud budgets and procurement tools. Independent software vendors, regional providers, and managed service partners gain because listings lower acquisition costs and give smaller brands enterprise visibility.

Can Large Organizations Unlock a Higher Value Tier?

Large Organizations grow fastest among customer sizes at 19.2% CAGR from 2026–2035, as enterprises use virtual servers for development, edge sites and burst capacity. Providers that add service level commitments, private networking, compliance reports and dedicated support can raise average contract values. Resellers and managed service providers benefit by packaging servers with monitoring and security for corporate accounts.

Segmentation Analysis

2025 (USD Billion)
2035 (USD Billion)
Fully Managed VPS 2025: $1.47 Billion | 2035: $9.18 Billion
Fully Manage
Semi-Managed VPS 2025: $1.87 Billion | 2035: $10.20 Billion
Semi-Managed
Unmanaged VPS 2025: $3.35 Billion | 2035: $14.62 Billion
Unmanaged VP
Fully Managed VPS $1.47 Billion $9.18 Billion 17.7%
Semi-Managed VPS $1.87 Billion $10.20 Billion 16.1%
Unmanaged VPS $3.35 Billion $14.62 Billion 13.6%

Which Service Type Leads the Virtual Private Server Market?

Unmanaged VPS leads with USD 3.35 Billion in 2025, because developers and technical teams value low prices and full control. Fully Managed VPS is the fastest-growing service type at 17.7% CAGR from 2026–2035, followed by Semi-Managed VPS at 16.1%. Customers with limited operations staff are paying for patching, backups, and security monitoring, so provider support quality increasingly decides renewals and upgrades.

2025 (USD Billion)
2035 (USD Billion)
Linux Operat
Windows Serv
BSD Operatin
Other Operat
Segment Item 2025 (USD Billion) 2035 (USD Billion) CAGR
Linux Operating System $10.0 USD Billion $40.0 USD Billion 22.0%
Windows Server $17.1 USD Billion $51.1 USD Billion 16.0%
BSD Operating Systems $24.2 USD Billion $62.2 USD Billion 26.0%
Other Operating Systems $31.3 USD Billion $73.3 USD Billion 12.0%

Segment-wise data is locked

Unlock complete segment-wise numbers for By Operating System.

Unlock Full Data
2025 (USD Billion)
2035 (USD Billion)
GPU-Accelera
Compute-Opti
Memory-Optim
Storage-Opti
General Purp
Segment Item 2025 (USD Billion) 2035 (USD Billion) CAGR
GPU-Accelerated VPS $10.0 USD Billion $40.0 USD Billion 8.0%
Compute-Optimized VPS $17.1 USD Billion $51.1 USD Billion 10.0%
Memory-Optimized VPS $24.2 USD Billion $62.2 USD Billion 12.0%
Storage-Optimized VPS $31.3 USD Billion $73.3 USD Billion 14.0%
General Purpose VPS $38.4 USD Billion $84.4 USD Billion 21.0%

Segment-wise data is locked

Unlock complete segment-wise numbers for By Resource Workload Configuration.

Unlock Full Data
2025 (USD Billion)
2035 (USD Billion)
Personal Non
Non-Employer
Employer Org
Micro Enterp
Small Enterp
Segment Item 2025 (USD Billion) 2035 (USD Billion) CAGR
Personal Non-Business Accounts $10.0 USD Billion $40.0 USD Billion 21.0%
Non-Employer Business Accounts $17.1 USD Billion $51.1 USD Billion 15.0%
Employer Organizations $24.2 USD Billion $62.2 USD Billion 25.0%
Micro Enterprises $31.3 USD Billion $73.3 USD Billion 15.0%
Small Enterprises $38.4 USD Billion $84.4 USD Billion 16.0%

Segment-wise data is locked

Unlock complete segment-wise numbers for By Customer Size.

Unlock Full Data
2025 (USD Billion)
2035 (USD Billion)
Direct Onlin
Direct Sales
Third-Party
Reseller and
Other Author
Segment Item 2025 (USD Billion) 2035 (USD Billion) CAGR
Direct Online Self-Service $10.0 USD Billion $40.0 USD Billion 24.0%
Direct Sales-Assisted $17.1 USD Billion $51.1 USD Billion 10.0%
Third-Party Cloud Marketplace $24.2 USD Billion $62.2 USD Billion 8.0%
Reseller and Managed Service Provider $31.3 USD Billion $73.3 USD Billion 14.0%
Other Authorized Channel Partners $38.4 USD Billion $84.4 USD Billion 13.0%

Segment-wise data is locked

Unlock complete segment-wise numbers for By Sales Channel.

Unlock Full Data
2025 (USD Billion)
2035 (USD Billion)
Fixed Subscr
Monthly Comm
Annual Commi
Multi-Year C
Time-Based U
Segment Item 2025 (USD Billion) 2035 (USD Billion) CAGR
Fixed Subscription $10.0 USD Billion $40.0 USD Billion 22.0%
Monthly Commitment $17.1 USD Billion $51.1 USD Billion 24.0%
Annual Commitment $24.2 USD Billion $62.2 USD Billion 18.0%
Multi-Year Commitment $31.3 USD Billion $73.3 USD Billion 24.0%
Time-Based Usage Billing $38.4 USD Billion $84.4 USD Billion 27.0%

Segment-wise data is locked

Unlock complete segment-wise numbers for By Billing Model.

Unlock Full Data
2025 (USD Billion)
2035 (USD Billion)
Agriculture
Forestry and
Mining and Q
Manufacturin
Electricity
Segment Item 2025 (USD Billion) 2035 (USD Billion) CAGR
Agriculture $10.0 USD Billion $40.0 USD Billion 20.0%
Forestry and Fishing $17.1 USD Billion $51.1 USD Billion 26.0%
Mining and Quarrying $24.2 USD Billion $62.2 USD Billion 24.0%
Manufacturing $31.3 USD Billion $73.3 USD Billion 26.0%
Electricity $38.4 USD Billion $84.4 USD Billion 9.0%

Segment-wise data is locked

Unlock complete segment-wise numbers for By End-User Industry.

Unlock Full Data

Supply Chain Analysis of the Virtual Private Server Industry

Supply Chain Analysis of the Virtual Private Server Industry
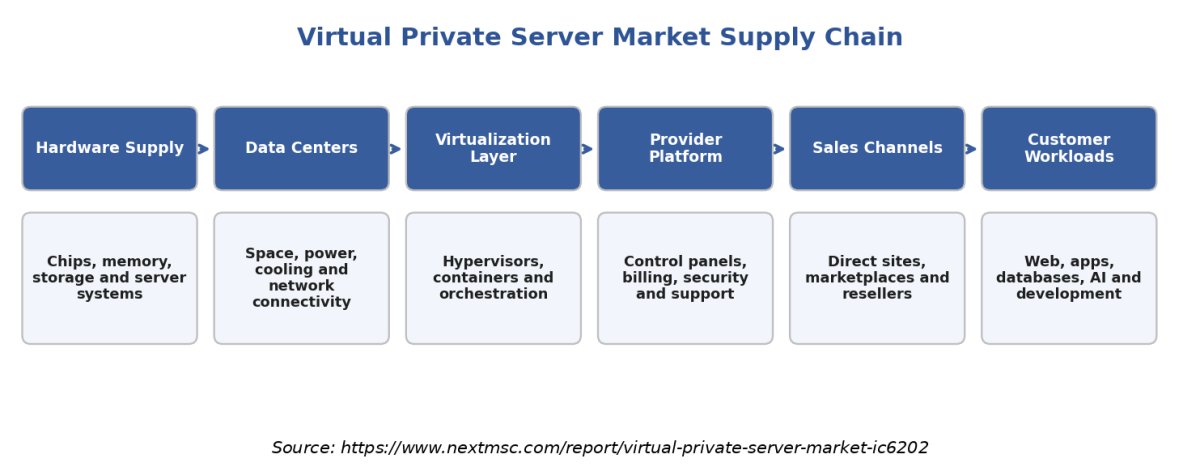
The above infographic maps the supply chain across hardware, datacenters, virtualization, provider platforms, channels, and customers. Chip, memory, and server makers supply components, and data center operators supply space, power, and network connectivity. Providers add virtualization software, control panels, security and support, then sell through direct websites, marketplaces and resellers. Value concentrates in capacity planning and automation, because providers that fill servers efficiently protect margins at low price points.

Growth Opportunities

Our analysis shows that three whitespace opportunities are positioned to generate disproportionate revenue through 2035.

Can GPU Virtual Servers Become a Mainstream Developer Product?

GPU-Accelerated VPS grows at a 31.3% CAGR from 2026–2035, rising from about 4% to 17% of revenue by our estimate. Startups, research teams, and small software firms need accelerators for inference and testing without long contracts. Developer clouds and infrastructure providers with GPU supply gain the most, particularly when they pair instances with simple pricing and ready software images.

Will Cloud Marketplaces Expand Reach for Smaller Providers?

Third-Party Cloud Marketplace is the fastest-growing sales channel at 23.2% CAGR from 2026–2035, rising from 8% to 16% of revenue by our estimate. Marketplace listings let providers reach buyers who use committed cloud budgets and procurement tools. Independent software vendors, regional providers, and managed service partners gain because listings lower acquisition costs and give smaller brands enterprise visibility.

Can Large Organizations Unlock a Higher Value Tier?

Large Organizations grow fastest among customer sizes at 19.2% CAGR from 2026–2035, as enterprises use virtual servers for development, edge sites and burst capacity. Providers that add service level commitments, private networking, compliance reports and dedicated support can raise average contract values. Resellers and managed service providers benefit by packaging servers with monitoring and security for corporate accounts.

Regional Outlook

2025 (USD Billion)
2035 (USD Billion)
North Americ
Europe
Asia-Pacific
Middle East
Latin Americ
Region 2025 (USD Billion) 2035 (USD Billion) CAGR (%)
North America $10.0 USD Billion $40.0 USD Billion 9.0%
Europe $17.1 USD Billion $51.1 USD Billion 27.0%
Asia-Pacific $24.2 USD Billion $62.2 USD Billion 25.0%
Middle East & Africa $31.3 USD Billion $73.3 USD Billion 23.0%
Latin America $38.4 USD Billion $84.4 USD Billion 12.0%

Regional data is locked

Unlock complete regional numbers for this market.

Unlock Full Data

Competitive Landscape

Our assessment indicates that the Virtual Private Server Market industry spans developer clouds, hyperscale lightweight offerings, web hosting groups, and European infrastructure providers.

Dimension Description
Market Structure Fragmented, with developer clouds, hyperscale lightweight offerings, web hosting majors and European infrastructure providers competing across price tiers.
Innovation Focus GPU instances, managed layers, committed contracts with metered billing and regional hosting options.
M&A Activity Selective, with providers adding security, encryption and AI capability to broaden entry level hosting portfolios.

How Do Companies Compete in the Virtual Private Server Market?

Companies compete on price per resource unit, network quality, data center locations, support responsiveness and ease of use. Developer clouds emphasize simple interfaces and predictable pricing, while hosting groups bundle domains, email and security. Hyperscale offerings compete through ecosystem breadth and credits, and European providers stress regional control. Providers also compete on managed services, backups and GPU availability to move customers up the value ladder.

Which Competitive Archetypes Dominate the Virtual Private Server Market?

Four archetypes dominate. Amazon Web Services brings lightweight servers into a vast cloud ecosystem. DigitalOcean, Akamai and The Constant Company serve developers and growing firms. Web hosting groups such as GoDaddy, IONOS, Hostinger, Namecheap and InMotion Hosting serve small businesses, while OVHcloud, Hetzner, Contabo, Leaseweb and Kamatera compete on infrastructure value and regional reach.

What Innovation and Differentiation Strategies Are Companies Pursuing?

We observed that leading providers are investing in GPU capacity, managed layers and committed spend programs. DigitalOcean reported AI customer annual run rate revenue growth of 212% in its second quarter of 2026, and Akamai signed multi-year cloud infrastructure contracts worth over USD 2.80 Billion year to date. Pricing strategies mix fixed plans with metered billing, and geographic expansion focuses on new locations that meet local data rules.

What M&A and Partnership Activity Is Shaping the Market?

Our findings suggest that activity is selective and capability driven. OVHcloud acquired encryption specialist Seald in January 2026 to add zero knowledge capability, and providers continue to add security and backup tools through partnerships. Marketplace partnerships and reseller programs extend reach, and customers increasingly expect providers to integrate with developer tools, monitoring platforms and infrastructure automation software.

Key Market Players

Based on research conducted by NMSC, the following 20 companies represent the validated leading participants in the Virtual Private Server Market.

Amazon Web Services, Inc. DigitalOcean Holdings, Inc. Akamai Technologies, Inc. The Constant Company, LLC OVH Groupe SA GoDaddy Inc. IONOS SE Hetzner Online GmbH Hostinger International Ltd. Contabo GmbH Leaseweb Global B.V. Liquid Web, LLC New Dream Network, LLC InMotion Hosting, Inc. Kamatera Inc. Namecheap, Inc. Hostwinds, LLC InterServer, Inc. Vaghasia Group, Inc. (AccuWebHosting) KnownHost, LLC

Latest Developments

During our market evaluation, we noticed that 2026 activity concentrated on AI-driven growth at developer clouds, large committed contracts, and steady customer growth at hosting groups.

Date Event
August 2026 According to DigitalOcean’s Q2 2026 SEC Form 8-K filing, the company achieved 29% YoY revenue growth, reaching an annual run rate of USD 1.13 Billion and a 212% increase in AI customer ARR.
August 2026 Akamai disclosed a U.S. technology customer commitment of more than USD 0.60 Billion over four years for Cloud Infrastructure Services supporting robotics development.

Expert Insights

Ryan MacDonald

Ryan MacDonald

Chief Technology Officer | Liquid Web

"“For IT leaders, the shift to VPS isn’t just about cost savings. It’s about ensuring scalable, resilient infrastructure that supports innovation at speed.”"

Analyst Interpretation

The statement highlights the strategic role of VPS hosting in providing businesses with greater control, scalability, and infrastructure resilience without the full cost of dedicated server environments. As websites, applications, and digital workloads expand, organizations increasingly need flexible computing resources that can accommodate changing performance requirements. VPS solutions address this need by combining configurable resources with administrative control. The trend also creates opportunities for providers to differentiate through reliable infrastructure, rapid resource upgrades, and responsive technical support.

Investment Opportunities

Where Are Capital Inflows Concentrating in the Virtual Private Server Market?

Capital is flowing toward GPU capacity, regional data centers, and managed tooling that raises revenue per customer. Akamai disclosed a customer commitment of more than USD 0.60 Billion over four years for cloud infrastructure, and OVHcloud targets adjusted capital expenditure of 33% to 35% of revenue in fiscal 2026. Investors should expect continued spending on accelerators, network capacity and automation that lowers the cost to serve small accounts.

How Is Infrastructure Investment Shaping Market Capacity?

Infrastructure spending sets the pace of growth, since servers, memory, and power determine how many instances can be sold. Providers are front-loading hardware purchases and expanding edge datacenter footprints to serve latency sensitive customers. We expect continued investment in regional locations, which supports faster growth in Asia-Pacific and Middle East & Africa, and favors providers with strong supplier relationships and efficient capacity planning.

What ESG Considerations Are Influencing Market Investment?

Environmental and governance factors increasingly influence provider selection. Energy use of dense GPU servers, water use in cooling and renewable power sourcing appear in more enterprise tenders, and data protection practices influence regional choices. Providers that publish energy metrics, use efficient cooling and offer transparent data handling gain preference, which links cloud sustainability credentials directly to winning larger accounts.

Key Benefits for Stakeholders

How Does This Report Benefit Technology Buyers and Enterprise Leaders?

Chief information officers, engineering heads, and small business owners gain a view of where pricing models and service types are moving. The report shows Fully Managed VPS growing at 17.7% and Per-Second Instance Usage at 25.2%. Buyers can use these benchmarks to compare providers, decide between managed and unmanaged support, and plan commitment levels against peers.

How Does This Report Benefit Investors and Financial Analysts?

Investors and financial analysts gain a reconciled sizing model that moves from USD 6.69 Billion in 2025 to USD 9.42 Billion in 2026 and USD 34.00 Billion by 2035. Segment, region and country tables share one unit and one CAGR basis, which allows direct comparison of growth pockets such as GPU-Accelerated VPS and Asia-Pacific. The competitive and development sections help screen acquirers, targets and capacity leaders against a consistent evidence base.

How Does This Report Benefit Hosting Providers and Channel Partners?

Product teams, channel leaders and resellers gain visibility into which configurations, channels and pricing models are gaining share. The analysis highlights Third-Party Cloud Marketplace growth at 23.2% and Large Organizations at 19.2%. Providers can align roadmaps, capacity, and partner programs to these pockets, and use regional growth rates to decide where to place new data center capacity.

Key Market Segments Evaluated

By Service Type

  • Fully Managed VPS
  • Semi-Managed VPS
  • Unmanaged VPS

By Operating System

  • Linux Operating System
  • Windows Server
  • BSD Operating Systems
  • Other Operating Systems

By Resource Workload Configuration

  • GPU-Accelerated VPS
  • Compute-Optimized VPS
  • Memory-Optimized VPS
  • Storage-Optimized VPS
  • General Purpose VPS
  • Other Specialized VPS Configurations

By Customer Size

  • Personal Non-Business Accounts
  • Non-Employer Business Accounts
  • Employer Organizations 
    • Micro Enterprises
    • Small Enterprises
    • Medium Enterprises
    • Large Organizations

By Sales Channel

  • Direct Online Self-Service
  • Direct Sales-Assisted
  • Third-Party Cloud Marketplace
  • Reseller and Managed Service Provider
  • Other Authorized Channel Partners

By Billing Model

  • Fixed Subscription 
    • Monthly Commitment
    • Annual Commitment
    • Multi-Year Commitment
  • Time-Based Usage Billing 
    • Hourly Instance Usage
    • Per-Second Instance Usage
    • Other Time-Based Instance Usage
  • Resource-Metered Billing 
    • Separately Billed Compute or Memory
    • Storage Consumption
    • Network and Bandwidth Consumption
    • Other Metered Resources

By End-User Industry

  • Agriculture, Forestry and Fishing
  • Mining and Quarrying
  • Manufacturing
  • Electricity, Gas and Utilities
  • Water Supply and Waste Management
  • Construction
  • Wholesale and Retail Trade
  • Transportation and Storage
  • Accommodation and Food Services
  • Information and Communication
  • Financial and Insurance Activities
  • Real Estate Activities
  • Other Services

By Region

  • North America 
    • U.S.
    • Canada
    • Mexico
  • Europe 
    • UK
    • Germany
    • France
    • Italy
    • Spain
    • Netherlands
    • Sweden
    • Rest of Europe
  • Asia-Pacific 
    • China
    • India
    • Japan
    • South Korea
    • Australia
    • Singapore
    • Indonesia
    • Rest of APAC
  • Middle East & Africa 
    • UAE
    • Saudi Arabia
    • South Africa
    • Turkey
    • Rest of MEA
  • Latin America 
    • Brazil
    • Mexico
    • Argentina
    • Rest of LATAM

Conclusion & Recommendations

The long-term outlook is strongly positive, with growth from USD 9.42 Billion in 2026 to USD 34.00 Billion by 2035 at a CAGR of 15.3%. Small business digitization, AI workloads, and cost-focused migration sustain demand, while Asia-Pacific and larger customers broaden the base. Growth should remain broad across configurations, though mix shifts toward managed services, GPU instances and committed contracts.

What Strategic Positioning Recommendations Does NMSC Offer?

Providers should prioritize GPU supply, managed layers, and transparent billing that suits both planners and bursty users. Smaller hosts should differentiate through regional presence, support quality, and niche software images. Buyers should compare total cost including bandwidth and backups, and match commitment levels to workload stability. Investors should favor operators with efficient capacity planning and diversified customer bases.

How Strong Is the Investment Attractiveness of the Virtual Private Server Market?

Investment attractiveness is solid, supported by the USD 24.58 Billion absolute opportunity between 2026 and 2035 and by double-digit growth across every region. GPU-Accelerated VPS at 31.3% and Third-Party Cloud Marketplace at 23.2% offer the strongest segment growth. Margin pressure from price competition means returns favor scaled, efficient operators.

What Are the Market Shifts and Key Risks in the Virtual Private Server Market?

Key shifts include the move toward managed services, per-second billing, marketplace distribution, and AI capable instances. Risks include price competition from larger clouds, hardware and power constraints, abuse and security costs, and uneven regional regulation. Customers may also shift workloads to serverless or container platforms, so providers need clear value in control, price, and support.

What Are the Primary Growth Pathways Through 2035?

Primary pathways include expansion of GPU instances, scaling of marketplace and reseller channels, growth of managed services and deeper penetration of large organizations. Regional pathways center on Asia-Pacific, India, and the Gulf, where digitization continues. Container and distributed cloud tooling that lets customers run workloads across providers offers a further route to share gains for flexible hosts.

FAQs

Sources & References

1.

DigitalOcean Holdings, Inc., Form 8-K, Q2 2026 Results

sec.gov
2.

Akamai Technologies, Inc., Form 8-K, Q2 2026 Results

sec.gov
3.

Akamai Investor Relations, Second Quarter 2026 Financial Results

ir.akamai.com/node/33716
4.

IONOS Group SE, First Half of 2026 Announcement

ionos-group.com
5.

IONOS Group SE, Q2 2026 Results Release

ionos-group.com
6.

OVHcloud, Financial Results Q3 FY26

corporate.ovhcloud.com
7.

OVHcloud, Q3 FY26 Press Release (PDF)

corporate.ovhcloud.com
8.

Eurostat, Cloud Computing: Statistics on the Use by Enterprises

ec.europa.eu
9.

Eurostat, Use of Artificial Intelligence in Enterprises

ec.europa.eu

About the Author

Mayurima Roy

Mayurima Roy

Mayurima Roy is Research Analyst at Next Move Strategy Consulting, where she has spent 4 years working across the firm's full industry coverage rather than a single fixed vertical. Her work centers on structured research, ongoing trend tracking, competitive assessment, and insight-led content development, translating complex market data into clear, decision-ready narratives that support informed client decision-making across diverse global industries, market sectors, and world regions every day.

About the Reviewer

Supradip Baul

Supradip Baul

Supradip Baul is an accomplished business consultant and strategist with over a decade of rich experience in market intelligence, strategy, technology, and business transformation. His work has included rigorous qualitative and quantitative analysis across multiple industries, helping clients shape investment decisions and long-term roadmaps. Earlier in his career, he was associated with Gartner, where he contributed to industry-leading reports and market share analyses. He has worked with leading global companies and holds an MBA with a dual specialization in Marketing and Finance.

Download Free Sample

Amos Chang

AMOS CHANG

Strategy Consultant

Kardex Group

I have bought the intralogistics market reports from NMSC two times so far. Joseph and his team are always very helpful and flexible in responding to any customization requirements on the report. Their expertise in market reports really helps us steer the day-to-day business. I will definitely recommend and come back myself whenever there is a need.

Pratyush Kumar Das

PRATYUSH KUMAR DAS

Assistant Manager

Polycab India Limited

We would like to express our appreciation for the data and insights provided by nextmsc. We are very pleased with the quality and depth of the information, which has proven to be highly valuable and beneficial for our business decision-making.

Rishabh Jogani

RISHABH JOGANI

Strategy Analyst

Accenture Japan

We are incredibly impressed with the market report on the real estate market in India provided by Next Move Strategy Consulting. The report was thorough, insightful, and well-structured, offering deep analysis and actionable recommendations. It not only captured the current trends and dynamics but also provided a forward-looking perspective that has been invaluable for our strategic planning. Their team demonstrated exceptional professionalism, attention to detail, and a profound understanding of the industry. The data-driven insights and clarity of presentation exceeded our expectations, making complex market trends easy to understand. We highly recommend Next Move Strategy Consulting to anyone looking for reliable and comprehensive market research services. Their expertise has given us the confidence to navigate the complexities of the Indian real estate market with clarity and foresight.

Kevin Coker

KEVIN COKER

Founder, CEO and Board Diector

Proxima Clinical Research

I have been using Next MSC reports for product positioning in a new geography for a long time. They have by far the best reports I have found and the price is reasonable too!

Robert Sean Trevino

ROBERT SEAN TREVINO

Sr. Director, Head of Strategic Insights & Analytics

Foundation Medicine

I realized that it was a reliable source of information. These days, there are many people who are looking for authentic data, and this is one of the only sources that can offer them with what they need;

Custom Market Research Services

We will customize the research for you if the listed report does not fully match your requirements.

Get 30% Free Customization

Select License

This website uses cookies to ensure you get the best experience on our website. Learn more

✖