Market")
Autonomous Mobile Robot (AMR) Market By Component (Hardware and Software), By Type (Mouse, Fork, and Custom), By Payload Capacity (Up to 100 KG, 101–200 KG, 201–500 KG, 501–1000 KG, 1001–2000 KG, and 2001–5000 KG), By Application (Towing, Lifting, Tugging, and Other Applications), and By End User Industry [Electronics, Semiconductor (Design Services, Manufacturing Services, Packaging & Testing), Food & Beverage, and Others] – Global Analysis & Industry Forecast, 2024–2030.
Industry: Semiconductor & Electronics | Lastest Edition: June 16, 2026 | No of Pages: 407 | No. of Tables: 662 | No. of Figures: 607 | Format: PDF | Report Code : SE450
Market Overview
The Autonomous Mobile Robot (AMR) Market size was valued at USD 1.24 billion in 2023, and is predicted to reach USD 3.13 billion by 2030, with a CAGR of 13.4% from 2024 to 2030. In terms of volume, the market size was 51135 units in 2023, and is projected to reach 179952 units by 2030, with a CAGR of 18.7% from 2024 to 2030.
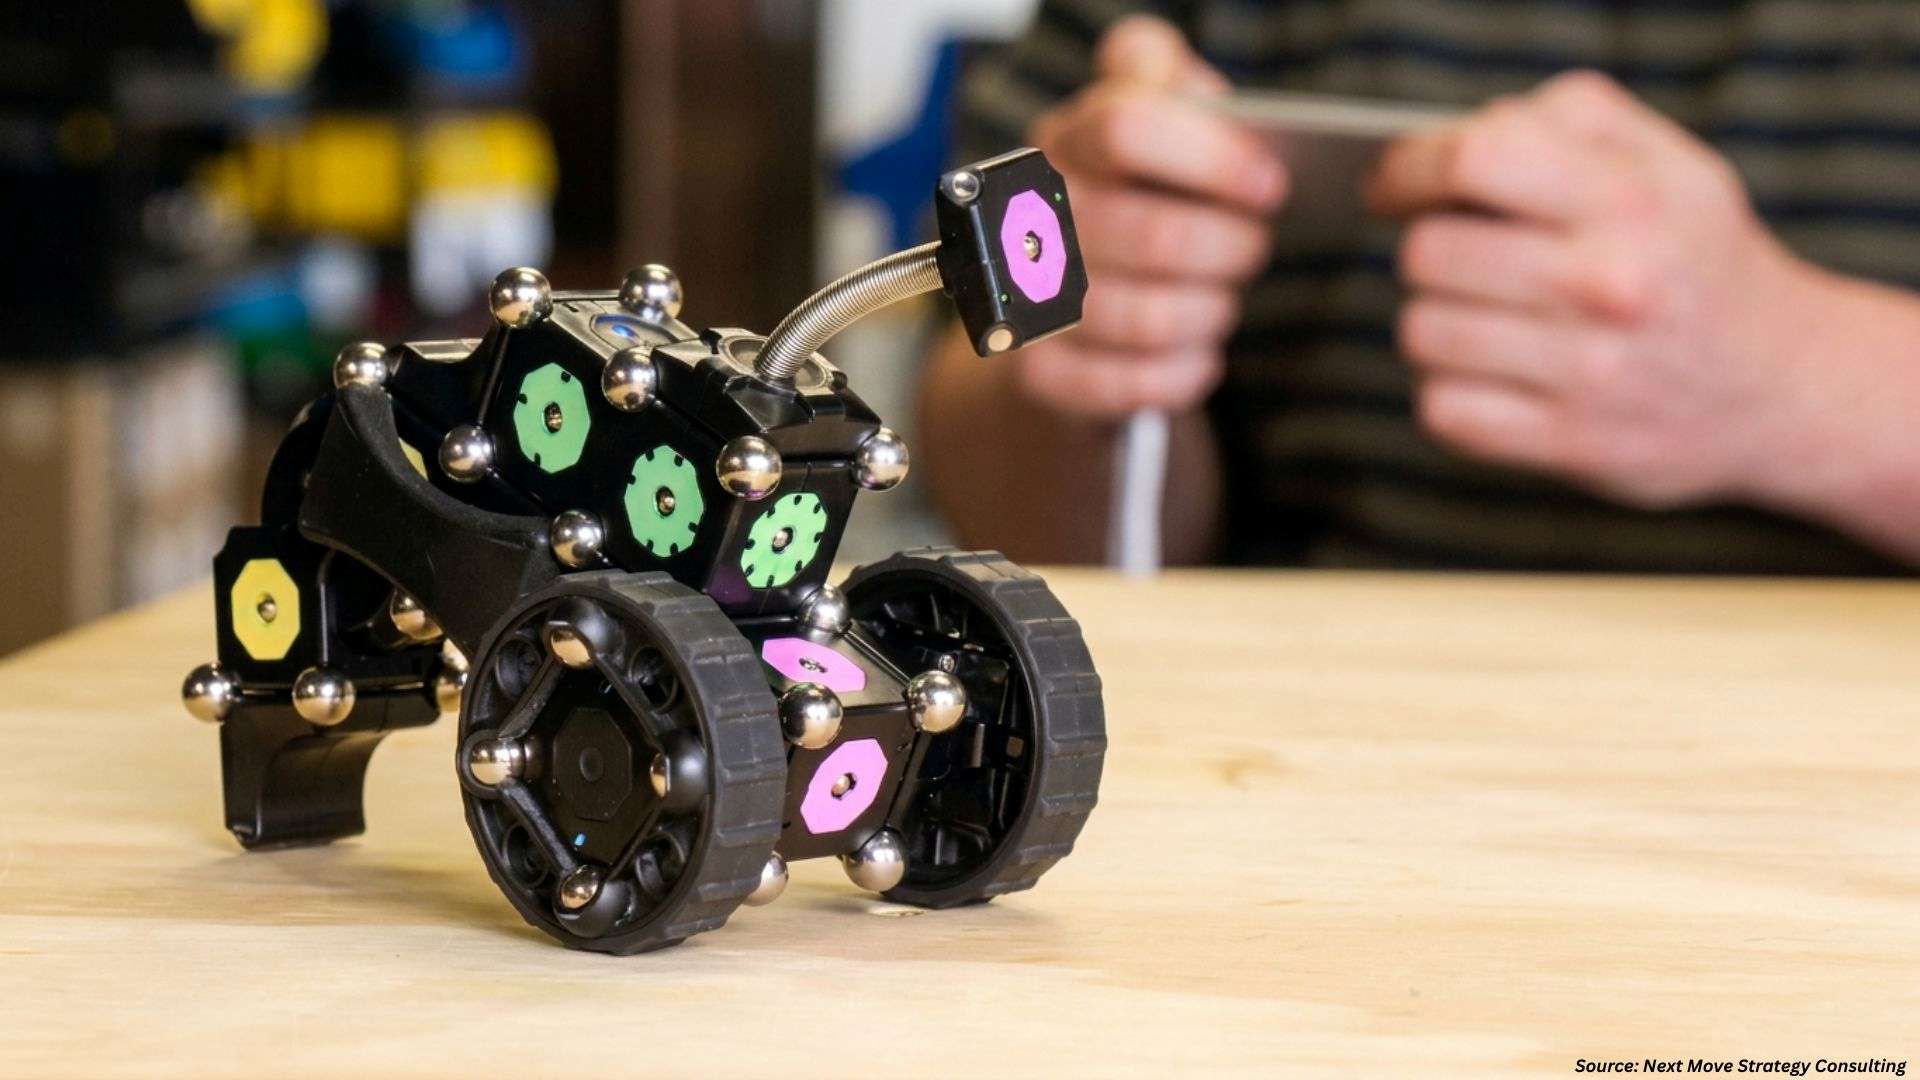
AMRs are complex robots that moves and operate in different environments by themselves and without any human help. AMRs utilizes variety of sensors, artificial intelligence (AI) algorithms to determine their own location and surroundings to act on it.
The robots use cameras, Light Detection and Ranging (LIDaR), Radio Detection and Ranging (RADaR), and ultrasonic sensors to observe their surroundings. As these sensors helps to allow the robot to generate a precise map of its environment, detect barriers or humans in its route, and adapt to new situations as they arise.
The acquired data is subsequently processed by an on-board artificial intelligence system, which makes decisions based on it. The AMR's AI algorithms develop ideal pathways for navigation and control instructions based on the analyzed information, ensuring that activities are done in the least amount of time feasible. In addition, these robots are capable in terms of mobility in complicated environment, avoiding objects which block their way or responding quickly enough when something around changes unexpectedly. They can also perform numerous functions such as handling materials, managing inventory systems, manipulating objects mechanically plus cooperating closely with individuals during joint working activities.
AMRs also enhance productivity and efficiency in terms of repetitive or time-intensive tasks autonomously. These robots can function continuously, without getting exhausted that results in increased output and shorter cycle times.
Increase in Adoption Of Robotics
Adoption of robotics in various industries such as automotive, electronics, and foods & beverages has increased, which has led to development & adoption of AMRs. According to the 2021 World Robot Report, the global average robot density in manufacturing industries has doubled in the past five years, with 126 robots per 10,000 employees. This increasing trend indicates the growing importance of automation and need for more advanced robotics technologies, such as AMRs, to optimize manufacturing processes, improve efficiency, and reduce costs. In addition, the ability of these robots to navigate their surroundings is crucial for their effectiveness and efficiency in various industries, such as logistics, pharmaceuticals, and automotive. Hence, with rise in use of robots continues, demand for advanced AMRs is expected to increase.
This trend has driven development of more sophisticated algorithms & sensors and integration of AMRs into a growing number of robotic systems. For instance, in March 2022, Geek+ and Bosch Rexroth have extended their partnership agreement to develop and deploy new technologies. As part of the partnership, the companies have collaborated to create a unique version of Geek+'s MP1000R moving robot that integrates Bosch Rexroth's laser localization software ROKIT Locator. Thus, development and implementation of advanced robotics continues to grow in the future, which is expected to propel the market growth.
Integration of Advanced Technologies in AMR
Integration of advanced technologies such as artificial intelligence (AI) and machine learning (ML) in AMRs is also a significant driver of the market growth. These technologies allow AMRs to make intelligent decisions and adapt to changing environments, enhancing their efficiency and reliability. AI and ML algorithms enable autonomous mobile robots to learn from their experiences and optimize their performance, improving their accuracy and reducing the need for human intervention. In addition, integration of AI and ML enables AMRs to work collaboratively with other robots and humans, making them more versatile and effective in various applications.
Increase in Adoption of Industry 4.0.
Industry 4.0, also known as the fourth industrial revolution, is a term used to describe the integration of digital and physical systems in manufacturing and other industries. The integration of digital systems involves use of technologies such as the Internet of Things (IoT), artificial intelligence (AI), and machine learning (ML) to connect machine, systems, and people. The goal of Industry 4.0 is to create a smart factory where digital technologies are used to optimize production processes, improve efficiency, and reduce costs.
AMR is a crucial component of Industry 4.0 as they can operate independently, adapt to changing environments, and communicate with other machines and systems. These robots are used to transport materials & products and to navigate complex environments and avoid obstacles. Hence, as more companies embrace Industry 4.0 and seek to create more efficient and flexible production processes, demand for AMRs is expected to grow.
High Implementation Costs
High cost of implementing AMRs limits growth of the market. Incorporation of advanced sensors, LiDAR scanners, and other hardware components contribute toward high implementation costs. High costs make it challenging for small and medium-sized enterprises to adopt the technology, thereby hampering the market growth.
Advancements in Sensor Technology
Advancements in sensor technology plays a crucial role in enabling more accurate and reliable for AMRs. LiDAR sensors, depth cameras, and inertial measurement units (IMUs) provide detailed information about surroundings of robots, such as distance to obstacles, angular rate, location of objects, and orientation of robots. This information is then used by AMRs to create a map of the environment and enable the robot to navigate autonomously. Development of more advanced sensors with higher accuracy and resolution has led to increased adoption of these systems in various industries, from logistics to pharmaceuticals. Hence, the evolving sensor technology is anticipated to enhance precision and efficiency of AMRs, which is expected to provide ample growth prospects for the market in the future.
North America Predominates the AMR Industry
The rise of industrial automation and robotics in North America has become prominent in recent years, propelled by factors including rising labor expenses, the demand for enhanced efficiency, and shortages in labor within e-commerce, logistics, and manufacturing sectors. Consequently, there has been a growing uptake of Autonomous Mobile Robots (AMRs) in the region. As per the U.S. Bureau of Labor Statistics, wages and salaries in the U.S. rose by 4.3% for the 12-month period ending in December 2023, following a 5.1% increase for the 12-month period ending in December 2022.
Furthermore, the presence of prominent regional players in the AMR industry, such as OTTO Motors, and Clearpath Robotics, has contributed to the market growth in North America. These key players have adopted strategies such as new product introductions to maintain their dominance in the market. During 2023, OTTO Motors introduced the OTTO 600, an Autonomous Mobile Robot (AMR) with the ability to manage payloads of up to 600 kilograms, establishing it as the most durable and agile AMR within its category.
In addition, the growing demand for mobile robots for improving efficiency in the manufacturing sector fuels the autonomous mobile robot industry growth in this region. As an example, WEG introduced a new AMR designed to improve efficiency in manufacturing. This robot helps in handling repetitive tasks that involve transporting materials within a facility. WEG's AMR equipped with SLAM to move around on its own to improve efficiency in industrial settings.
Asia-Pacific is Expected to Show Steady Growth in the AMR Sector
The Asia-Pacific region is experiencing rapid growth in the Autonomous Mobile Robot (AMR) market, driven by factors including the increasing adoption of AMRs in the established semiconductor industry throughout the region. As per the World Semiconductor Trade Statistics (WSTS) organization, the Asia-Pacific region saw a notable year-on-year growth rate of 11.3% in semiconductor sales from 2022 to 2023, indicating significant potential for the integration of AMRs within the semiconductor sector in the future.
In addition, the demand for AMRs to optimize productivity at warehouses is being driven by the rapid growth of e-commerce across Asia-Pacific region. This region is the largest market for business to consumer shopping and online retail, according to an Asian Development Bank report which forecasts that by 2025, it will have a share of 61% globally. This dominant position in the e-commerce landscape indicates that the adoption of AMRs is poised to accelerate in the near future within the region.
Competitive Landscape
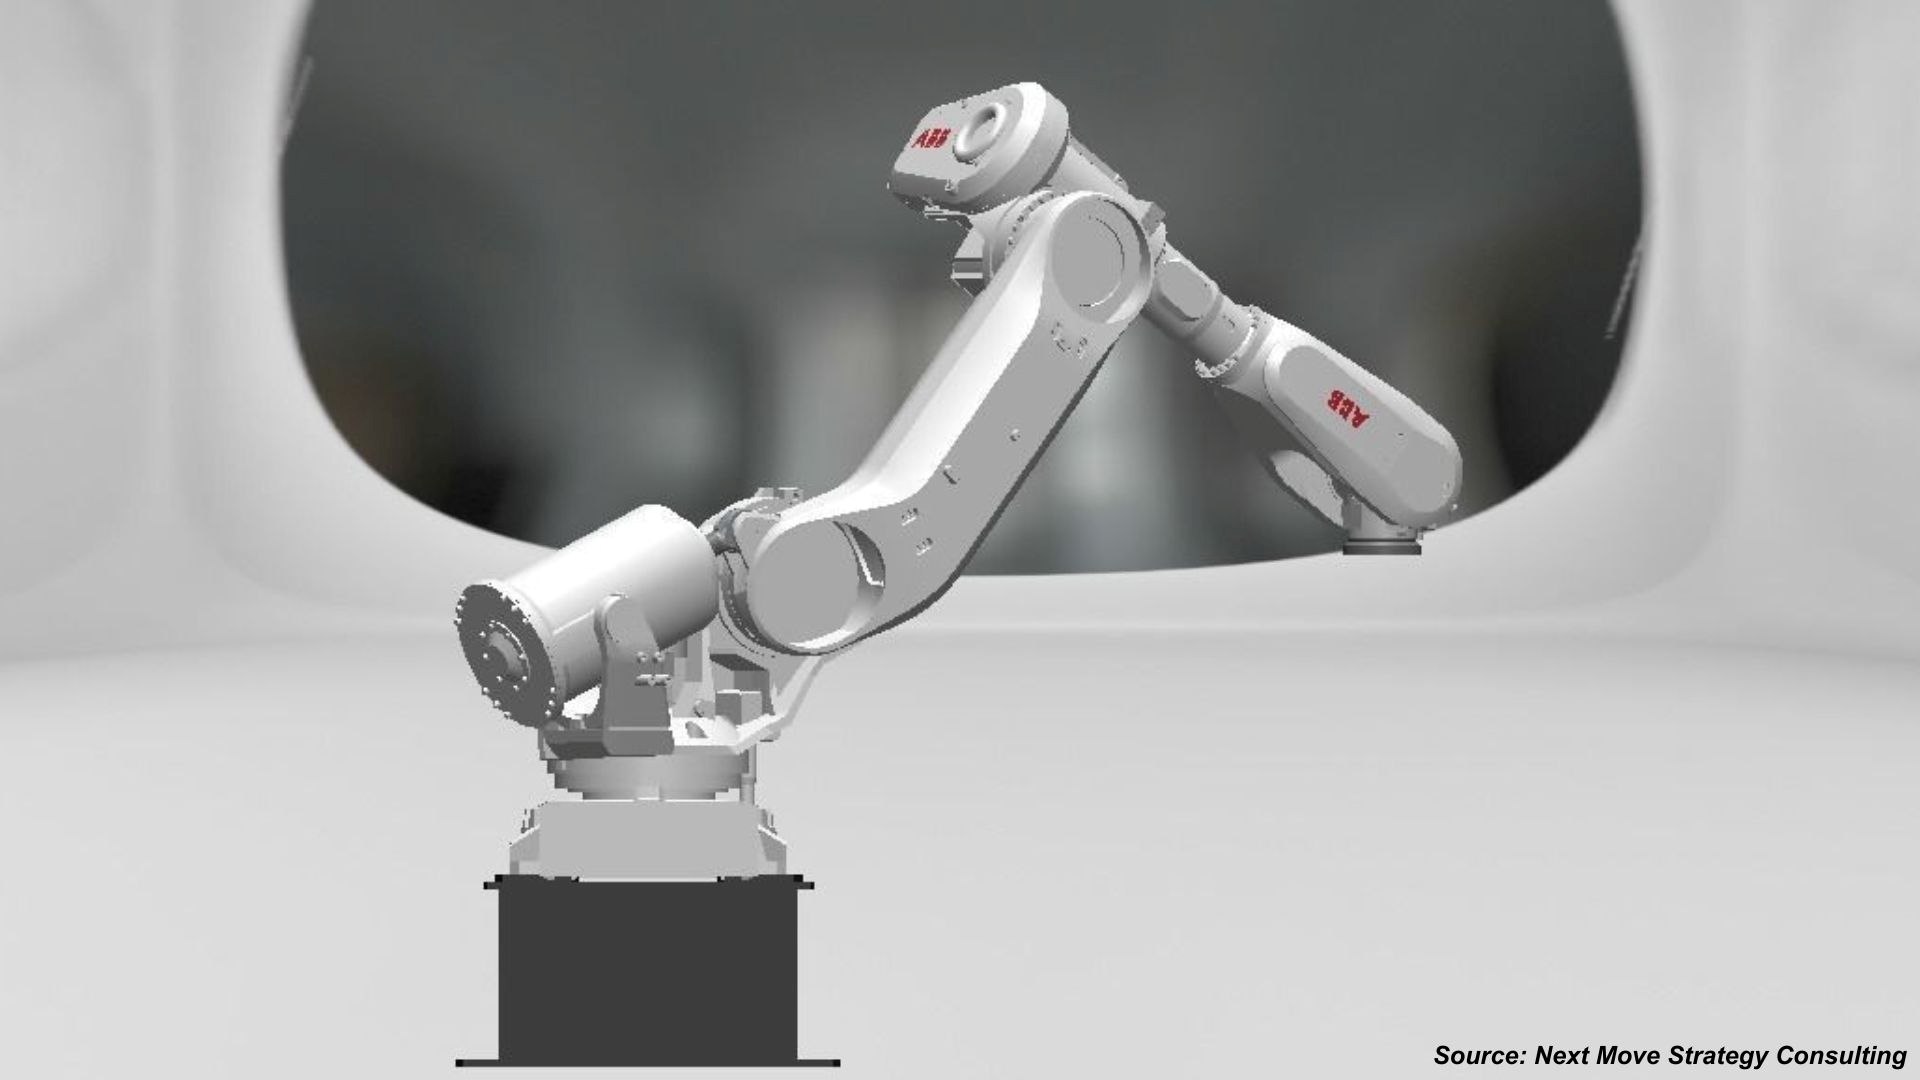
Several market players operating in the autonomous mobile robot market include Mobile Industrial Robots A/S, Greyorange Pte. Ltd, Addverb Technologies Limited, Otto Motors, Seegrid Corporation, Fetch Robotics, Locus Robotics, Abb Ltd, Gideon Brothers, Omron Corporation, Multiway Robotics (Shenzhen) Company, Iplusmobot Technology Co. Ltd, 6 River Systems, Shanghai Seer Intelligent Technology Corporation, Geekplus Technology Co. Ltd, and others. These market players are adopting product launch and partnership strategies across various regions to maintain their dominance in the AMR market.
For instance, in April 2023, Shanghai Seer Intelligent Technology Corporation announced its plan to unveil the SEER SRC Controller for the AMR building kit. This launch aims to provide developers with an innovative solution for building and controlling autonomous robots, thereby accelerating the development of cutting-edge robotic technologies and applications.
Moreover, in March 2023, OTTO Motors introduced its latest AMR, the OTTO 600. This robust AMR is designed to handle heavy loads of up to 600 kilograms. It can operate efficiently in industrial environments, such as manufacturing plants and warehouses. The launch of the OTTO 600 along with advancements in software development are expected to expand the capabilities of autonomous material handling in the industrial sector.
Furthermore, in November 2022, GreyOrange partnered with SEKO Logistics to enhance the efficiency of SEKO's logistics operations. This collaboration integrates GreyOrange's AI-powered Fulfilment Operating System and Ranger Mobile Sort robots. These robots are designed to sort packages and optimize order fulfillment processes, reducing human error and improving speed and accuracy. The partnership aims to strengthen SEKO's ability to offer automated solutions to clients, resulting in a more streamlined and cost-effective supply chain.
Autonomous Mobile Robot (AMR) Market Key Segments
By Component
-
Hardware
-
Software
By Type
-
Mouse
-
Fork
-
Custom
By Payload Capacity
-
Up to 100 KG
-
101-200 KG
-
201-500 KG
-
501-1000 KG
-
1001-2000 KG
-
2001-5000KG
By Application
-
Towing
-
Lifting
-
Tugging
-
Other Application
By End User Industry
-
Electronics
-
Semiconductor
-
Design Services
-
Manufacturing Services
-
Water manufacturing
-
SMT/PCBA Manufacturing
-
IGBT Manufacturing
-
FPD Manufacturing
-
Other Manufacturing Services
-
-
Packaging and Testing
-
-
FMCGs
-
Automotive
-
Pharmaceutical
-
Healthcare
-
Logistics
-
Food & Beverage
-
New Energy
By Region
-
North America
-
U.S.
-
Canada
-
Mexico
-
-
Europe
-
UK
-
Germany
-
France
-
Italy
-
Spain
-
Denmark
-
Netherlands
-
Finland
-
Sweden
-
Norway
-
Russia
-
Rest of Europe
-
-
Asia-Pacific
-
China
-
Japan
-
India
-
South Korea
-
Australia
-
Indonesia
-
Singapore
-
Taiwan
-
Thailand
-
Rest of Asia-Pacific
-
-
Rest of World
-
Latin America
-
Middle East
- Africa
-
Key Players
-
Geekplus Technology Co., Ltd
-
Iplusmobot
-
Shanghai Seer Intelligent Technology Corporation
-
Omron Corporation
-
Zebra Technologies Corporation
-
Locus Robotics
-
ABB Ltd.
-
Otto Motors
-
GreyOrange
-
Seegrid
-
Gideon Brothers Inc
-
Multiway Robotics (Shenzhen) Co., Ltd.
-
Addverb Technologies Limited
-
Mobile Industrial Robots A/S
-
Ocado Group plc
Report Scope and Segmentation
|
Parameters |
Details |
|
Market Size in 2023 |
USD 1.24 Billion |
|
Revenue Forecast in 2030 |
USD 3.13 Billion |
|
Value Growth Rate |
CAGR of 13.4% from 2024 to 2030 |
|
Market Volume in 2023 |
51135 Units |
|
Unit Forecast in 2030 |
179952 Units |
|
Volume Growth Rate |
CAGR of 18.7% from 2024 to 2030 |
|
Analysis Period |
2023–2030 |
|
Base Year Considered |
2023 |
|
Forecast Period |
2024–2030 |
|
Market Size Estimation |
Billion (USD) |
|
Growth Factors |
|
|
Countries Covered |
28 |
|
Companies Profiled |
15 |
|
Market Share |
Available for 10 companies |
|
Customization Scope |
Free customization (equivalent up to 80 working hours of analysts) after purchase. Addition or alteration to country, regional, and segment scope. |
|
Pricing and Purchase Options |
Avail customized purchase options to meet your exact research needs. |
 Market Revenue by 2030 (Billion USD)")
 Market Segmentation")
 Market Major Regions")
About the Author
 Jayanta Das is a senior research analyst delivering high-impact market intelligence across global markets. He leads comprehensive studies covering market assessment, forecasting, competitive evaluation, regulatory review, and trend analysis. Known for his structured and methodical approach, Jayanta excels at converting complex datasets into clear, decision-ready insights for leadership teams. His work supports strategic planning through credible sourcing, analytical precision, strong validation frameworks, and well-structured, business-focused reporting that enables confident decision-making.
About the Reviewer
 Supradip Baul is an accomplished business consultant and strategist with over a decade of rich experience in market intelligence, strategy, technology, and business transformation. His work has included rigorous qualitative and quantitative analysis across multiple industries, helping clients shape investment decisions and long-term roadmaps. Earlier in his career, he was associated with Gartner, where he contributed to industry-leading reports and market share analyses. He has worked with leading global companies and holds an MBA with a dual specialization in Marketing and Finance.
At Next Move Strategy Consulting, we understand that insightful market research is the cornerstone of successful business decisions. That's why we employ a robust and multifaceted approach, combining various methodologies to deliver the most accurate and actionable data for our clients.

Research Landscape
We navigate the world of research with two primary approaches:
Qualitative Approach
Our qualitative research methodologies involve immersive techniques such as in-depth interviews, focus groups, and observational studies. By engaging directly with individuals and stakeholders, we uncover valuable insights that quantitative data alone may overlook.

Quantitative Research
In tandem with qualitative methodologies, NMSC leverages the power of Quantitative Research to provide a robust foundation of numerical insights. Through systematic data collection and analysis, we quantify patterns, preferences, and market trends, offering a comprehensive view of the business landscape.
Our quantitative research approach employs diverse tools, including surveys, experiments, and statistical modelling. These methodologies enable us to gather data from a large and representative sample, ensuring the statistical significance of our findings. By employing structured questionnaires and standardized data collection methods, we guarantee the reliability and validity of the information we present to our clients.
Quantitative research is particularly effective in measuring the prevalence of trends, assessing market size, and gauging the impact of various factors on consumer behavior. The numerical precision attained through this approach equips our clients with actionable insights, facilitating data-driven decision-making and strategy formulation.


Our Specialized Toolbox for Industry-Specific Market Research
We deploy a specialized arsenal of techniques tailored to meet your unique requirements. Here's a glimpse into our comprehensive toolbox:

Information Procurement
The stage entails acquiring market data or relevant information through various sources and methodologies.


Market Research Approach
We utilize both top-down and bottom-up approaches in market research analysis to achieve a comprehensive understanding of the market dynamics, leveraging the broad perspective of industry trends and macroeconomic factors alongside detailed insights from specific segments and individual companies.

Porters Five Forces Analysis
We conduct Porter's Five Forces analysis to evaluate the competitive landscape of an industry, providing us with insights into factors that affect profitability and strategic positioning.

SWOT Analysis

Forecasting
We utilize a forecasting model to predict future consumption by considering parameters like population, economics, regulations, market competition, drivers, constraints, technology, and pricing. We also employ statistical techniques such as multilinear regression, exponential smoothing, moving average, ARIMA, and Monte Carlo simulations for accurate predictions. In econometric forecasting, we analyzed short-term and long-term event impacts, attributing values based on regulatory frameworks, economic factors, and market events.


 Speak to Our Analyst