Claims Management Market Analysis and Forecast (2026–2035)

Claims management market size was USD 43.66 Bn in 2025, projected to reach USD 84.21 Bn by 2035, growing at a CAGR of 6.80% from 2026 to 2035. Key drivers include AI-enabled claims automation, cloud migration of claims systems and rising catastrophe-related claim volumes, with North America leading the market

Download Free Sample PDF
Base Year (2025)
$43.66 Billion
Forecast (2035)
$84.21 Billion
CAGR (2026-2035)
6.8%
Top Region
North America

What Is the Claims Management Market Size?
The claims management market was valued at USD 43.66 Bn in 2025 and USD 46.58 Bn in 2026. It is forecast to reach USD 84.21 Bn by 2035, growing at a 6.80% CAGR from 2026 to 2035. North America leads with about 38% share, while Services is the largest component at about 62%.

Our analysis shows that growth is shifting from labor heavy claims handling toward platform led, data rich workflows that insurers, administrators and self-insured buyers can scale across lines of business.

Claims Management Market Analysis and Forecast (2026–2035) Revenue Forecast

Values in USD Billion

2025 $43.66 Billion
2025
2026 $46.63 Billion
2026
2027 $49.80 Billion
2027
2028 $53.19 Billion
2028
2029 $56.80 Billion
2029
2030 $60.67 Billion
2030
2031 $64.79 Billion
2031
2032 $69.20 Billion
2032
2033 $73.90 Billion
2033
2034 $78.93 Billion
2034
2035 $84.21 Billion
2035

Key Takeaways

By Component: Services held the largest share, expanding from USD 27.07 Bn in 2025 to USD 45.48 Bn by 2035; Software is the fastest-growing at 8.84% CAGR from 2026–2035.

By Deployment Mode: Cloud held the largest share, expanding from USD 20.09 Bn in 2025 to USD 57.26 Bn by 2035, and is also the fastest-growing at 10.96% CAGR from 2026–2035.

By Insurance Type: Motor held the largest share, expanding from USD 14.85 Bn in 2025 to USD 25.26 Bn by 2035; Health is the fastest-growing at 8.29% CAGR from 2026–2035.

By Function: Investigation and Adjudication held the largest share, expanding from USD 15.28 Bn in 2025 to USD 26.10 Bn by 2035; Claims Reporting and Compliance is the fastest-growing at 8.74% CAGR from 2026–2035.

By End User: Insurance Carriers held the largest share, expanding from USD 27.08 Bn in 2025 to USD 50.52 Bn by 2035; Self-Insured Enterprises and Government is the fastest-growing at 7.53% CAGR from 2026–2035.

Dominant Region: North America held the largest share, expanding from USD 16.59 Bn in 2025 to USD 28.64 Bn by 2035.

Fastest-Growing Region: Asia-Pacific is the fastest-growing at 8.82% CAGR from 2026–2035, rising from USD 10.48 Bn in 2025 to USD 24.42 Bn by 2035.

Dominant Country: The U.S. held the largest share, expanding from USD 14.27 Bn in 2025 to USD 24.06 Bn by 2035.

Fastest-Growing Country: India is the fastest-growing at 12.26% CAGR from 2026–2035, rising from USD 0.84 Bn in 2025 to USD 2.69 Bn by 2035.

The absolute opportunity between 2026 and 2035 is USD 37.63 Bn, which signals sustained room for platform vendors, administrators and analytics specialists to add revenue.

According to NMSC analysis, buyers are reallocating spend from custom internal builds to configurable cloud platforms, which favors vendors that combine workflow, data and services under one commercial relationship.

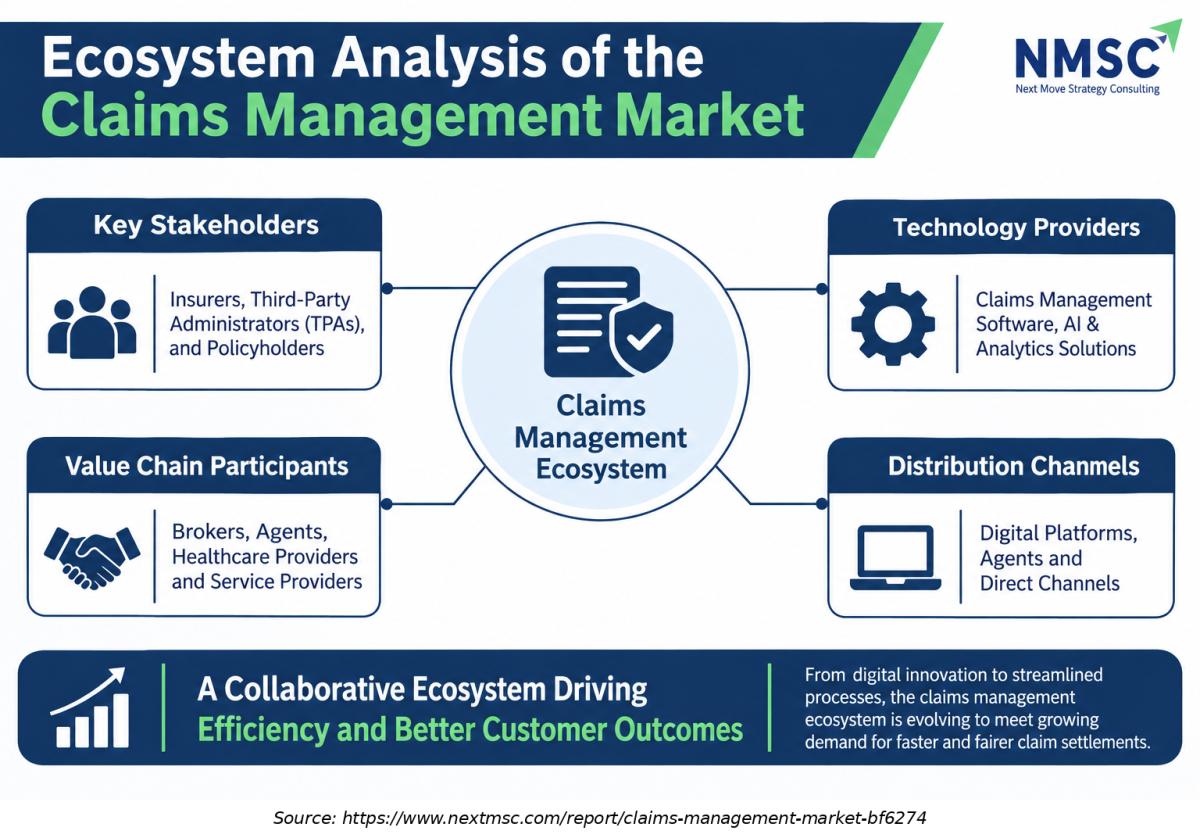
Ecosystem Analysis of the Claims Management Market
The above infographic shows that value in claims management sits where insurers, administrators and technology vendors exchange data with claimants, repair networks and regulators. Platform vendors win when they connect those parties through open integrations. Administrators win when field expertise is paired with digital workflow. Regulators set the guardrails that determine how far automation can go. Participants should map their offering to the node where they hold the strongest data advantage.

What Does the Claims Management Market Encompass?

The market covers software platforms and services used to receive, investigate, adjudicate, pay and report insurance claims. It spans claims administration platforms, analytics and AI tools, fraud and subrogation solutions, third-party administration, loss adjusting and outsourced claims services. We classify it as a growth stage market because cloud migration, AI adoption and consolidation among providers are all active at the same time. Regulators are also tightening expectations on automated decisions, which shapes buying criteria.

Market Drivers & Dynamics

Interactive Dataset
Generative and agentic AI in claims workflows driver +1.1 Global; strongest in North America and Europe 2026–2030
Cloud migration of core claims systems driver +0.9 Global 2026–2032
Catastrophe related claim volume volatility driver +0.6 North America and Asia-Pacific 2026–2035
Fair claims handling and AI governance rules driver +0.4 U.S. and Europe 2026–2030
Legacy system integration cost and migration risk restraint −0.7 Global 2026–2029
Data privacy, residency and model risk concerns restraint −0.5 Europe and Middle East & Africa 2026–2032
Shortage of experienced adjusters and claims engineers restraint −0.4 North America and Europe 2026–2030
Source: Next Move Strategy Consulting

Growth Drivers

How Is AI Automation Lifting Claims Technology Demand?

Weather-related claim surges are increasing the need for scalable claims management capabilities and advanced technology. In October 2026, Guidewire introduced AI agents integrated into claims workflows, supporting processes from first notice of loss through adjudication. Insurers are adopting these solutions to accelerate claim processing, reduce cycle times, and enable adjusters to focus on complex cases. This shift is strengthening demand for AI-enabled claims platforms and increasing software adoption across claims operations.

How Do Catastrophe Events Change Claims Volumes and Provider Revenue?

Severe weather events drive temporary increases in insurance claims, creating additional demand for claims adjusting services and technology. Crawford reported that Hurricanes Helene and Milton contributed more than USD 30 million in revenue during the fourth quarter of 2024. However, its Platform Solutions revenue declined by 30.5% in 2025 to USD 120.8 million as weather-related activity moderated. These fluctuations highlight the importance of flexible workforce capacity and scalable technology platforms that allow claims service providers to respond efficiently to changing catastrophe-related demand.

Growth Inhibitors

How Do AI Governance Rules Constrain Claims Automation?

The NAIC adopted its model bulletin on insurers' use of AI systems in December 2023, and individual states adopt it through their own bulletins. This creates a patchwork of documentation, testing and vendor oversight duties. Vendors must provide audit trails and explainability, which raises build cost. Insurers with strong governance can still automate faster, so the effect is a slower but safer adoption curve.

What Are the Growth Opportunities?

Can AI Guided Workers' Compensation and Disability Claims Open a New Revenue Pool?

Disability and workers' compensation files are long, document heavy and costly to manage. CCC bought EvolutionIQ to bring AI guidance to this area. Administrators and carriers that adopt AI-guidance tools can shorten claims processing times and improve return-to-work planning. Success depends on clinical data access and adjuster trust in recommendations.

Will Asia-Pacific Insurers Leapfrog Legacy Claims Systems?

Asia-Pacific is the fastest growing region at 8.82% in our model, reaching USD 24.42 Bn by 2035. Insurers expanding quickly can deploy cloud claims platforms without large legacy estates. Cloud vendors and local integrators gain most, and vendors with regional hosting gain an edge. Realization depends on local data residency rules and language capable automation.

Is Fraud and Subrogation Analytics the Highest Return Add On?

Fraud Detection and Subrogation grows at 8.53% in our function view, ahead of the market. Recovery and leakage control show direct financial returns, which eases budget approval. Analytics vendors and platform marketplaces benefit. Value depends on clean claims data and integration into adjuster workflows. Early movers can lock in carrier data partnerships.

Segmentation Analysis

2025 (USD Billion)
2035 (USD Billion)
Software 2025: $16.59 Billion | 2035: $38.73 Billion
Software
Claims Administration Platforms 2025: $9.17 Billion | 2035: $19.36 Billion
Claims Admin
Claims Analytics and AI 2025: $3.93 Billion | 2035: $10.95 Billion
Claims Analy
Fraud Detection and Prevention 2025: $3.49 Billion | 2035: $8.42 Billion
Fraud Detect
Services 2025: $27.07 Billion | 2035: $45.48 Billion
Services
Third-Party Administration 2025: $13.10 Billion | 2035: $21.91 Billion
Third-Party
Loss Adjusting 2025: $8.73 Billion | 2035: $13.47 Billion
Loss Adjusti
Claims Outsourcing and Consulting 2025: $5.24 Billion | 2035: $10.10 Billion
Claims Outso
Software $16.59 Billion $38.73 Billion 8.84%
Claims Administration Platforms $9.17 Billion $19.36 Billion 7.77%
Claims Analytics and AI $3.93 Billion $10.95 Billion 10.72%
Fraud Detection and Prevention $3.49 Billion $8.42 Billion 9.18%
Services $27.07 Billion $45.48 Billion 5.33%
Third-Party Administration $13.10 Billion $21.91 Billion 5.28%
Loss Adjusting $8.73 Billion $13.47 Billion 4.42%
Claims Outsourcing and Consulting $5.24 Billion $10.10 Billion 6.79%

Which Component Segment Leads and Which Is Growing Fastest?

Services is the largest component at USD 27.07 Bn in 2025, led by Third-Party Administration at USD 13.10 Bn. Software grows faster at 8.84%, and Claims Analytics and AI are the fastest sub segment at 10.72%. Our assessment indicates that insurers keep human expertise for complex files while buying software for intake, triage and analytics.

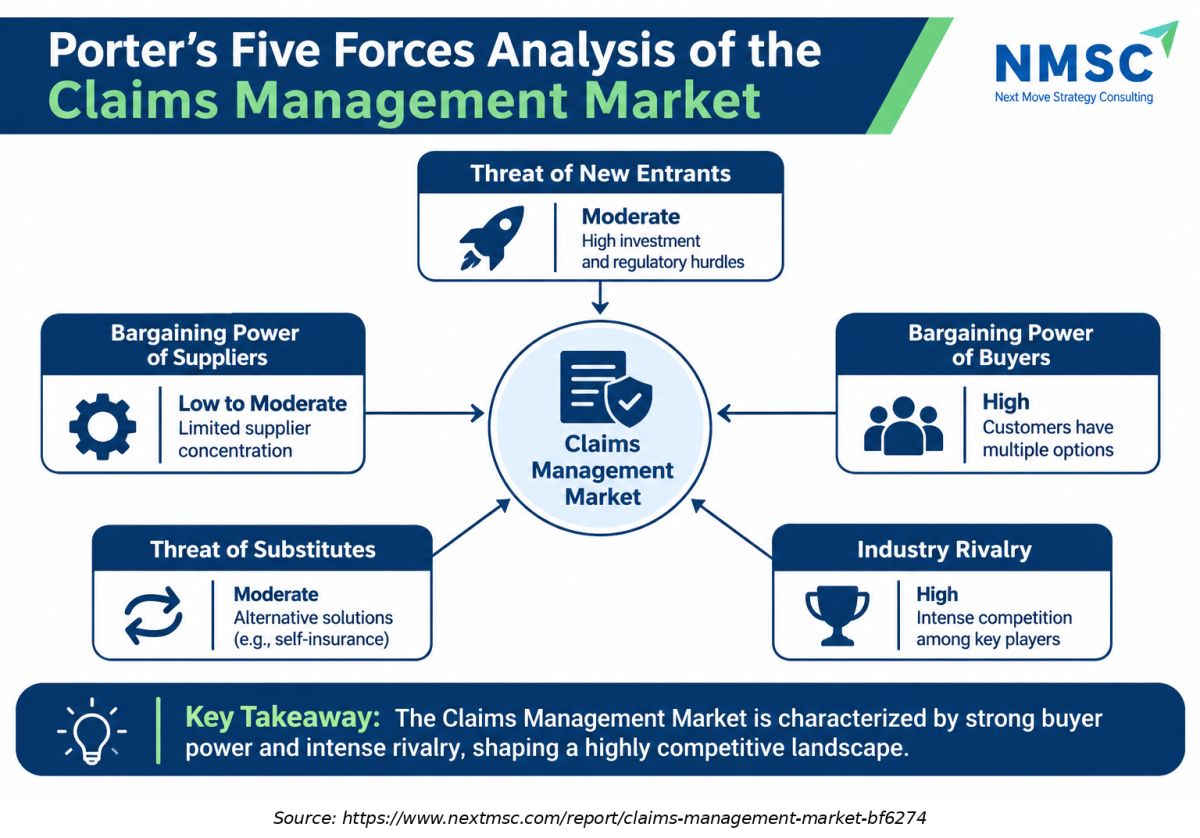
Porter's Five Forces Analysis of the Claims Management Market

The above infographic indicates that rivalry and buyer power are the two forces that matter most for providers. Large carriers negotiate hard and run multi-vendor stacks, so suppliers must prove measurable outcomes. Entry barriers protect core platforms but not point solutions, which keeps pressure on specialists. Providers should prioritize deep integrations, outcome based pricing and proprietary data to defend margins.

Growth Opportunities

Our analysis suggests three opportunity pools offer the clearest path to above market growth through 2035.

Can AI Guided Workers' Compensation and Disability Claims Open a New Revenue Pool?

Disability and workers' compensation files are long, document heavy and costly to manage. CCC bought EvolutionIQ to bring AI guidance to this area. Administrators and carriers that adopt AI-guidance tools can shorten claims processing times and improve return-to-work planning. Success depends on clinical data access and adjuster trust in recommendations.

Will Asia-Pacific Insurers Leapfrog Legacy Claims Systems?

Asia-Pacific is the fastest growing region at 8.82% in our model, reaching USD 24.42 Bn by 2035. Insurers expanding quickly can deploy cloud claims platforms without large legacy estates. Cloud vendors and local integrators gain most, and vendors with regional hosting gain an edge. Realization depends on local data residency rules and language capable automation.

Is Fraud and Subrogation Analytics the Highest Return Add On?

Fraud Detection and Subrogation grows at 8.53% in our function view, ahead of the market. Recovery and leakage control show direct financial returns, which eases budget approval. Analytics vendors and platform marketplaces benefit. Value depends on clean claims data and integration into adjuster workflows. Early movers can lock in carrier data partnerships.

Regional Outlook

2025 (USD Billion)
2035 (USD Billion)
North Americ
Europe
Asia-Pacific
Middle East
Latin Americ
Region 2025 (USD Billion) 2035 (USD Billion) CAGR (%)
North America $10.0 USD Billion $40.0 USD Billion 9.0%
Europe $17.1 USD Billion $51.1 USD Billion 27.0%
Asia-Pacific $24.2 USD Billion $62.2 USD Billion 25.0%
Middle East & Africa $31.3 USD Billion $73.3 USD Billion 23.0%
Latin America $38.4 USD Billion $84.4 USD Billion 12.0%

Regional data is locked

Unlock complete regional numbers for this market.

Unlock Full Data

Competitive Landscape

We found that the Claims Management Market is a layered contest between platform vendors, administrators and AI specialists, with scale and integration depth deciding who wins large programs.

How Do Companies Compete in the Claims Management Market?

Providers compete on integration depth, delivery capacity and measurable outcomes rather than price alone. Platform vendors court carriers with cloud claims suites and partner marketplaces. Administrators sell field expertise and capacity that flexes with catastrophe activity. Crawford's 2025 revenue before reimbursements of USD 1.266 Bn shows the scale at which a listed administrator operates.

Which Competitive Archetypes Dominate?

Three archetypes stand out. Platform vendors such as Guidewire and Duck Creek sell core claims systems. Administrators such as Sedgwick, Crawford and CorVel sell outsourced handling and loss adjusting. Data and AI specialists such as Verisk, CCC and Shift Technology sell analytics and decision tools. Many firms now blend two archetypes, which blurs boundaries.

How Do Innovation and Differentiation Strategies Differ?

Differentiation is moving from features to data and governance. Guidewire stresses agents that run on the same platform as the core, while Sedgwick stresses expert led work supported by AI. Both claim lower friction for claimants. Pricing is shifting toward subscription and outcome linked fees, and geographic expansion often follows large carrier relationships.

How Do Mergers and Partnerships Shape Competition?

Acquisitions add scarce AI talent and new claim types, as CCC showed with EvolutionIQ. Partnerships extend platforms without heavy build cost, as seen in Quantexa's accelerator. Both strategies favor companies with established customer relationships, while insurance carriers prefer partners with proven implementation and service-delivery capabilities. Smaller vendors should seek marketplace placement to gain reach.

Key Market Players

Our assessment indicates that the following companies lead the global market, listed in indicative ranked order by scale of claims related operations.

Sedgwick Claims Management Services, Inc. Crawford & Company Guidewire Software, Inc. Verisk Analytics, Inc. CCC Intelligent Solutions Holdings Inc. Gallagher Bassett Services, Inc. Solera Holdings, LLC Sapiens International Corporation N.V. CorVel Corporation Duck Creek Technologies Majesco Applied Systems, Inc. Enlyte Group Insurity, Inc. Origami Risk LLC Davies Group Limited McLarens Global Limited Genpact Limited Shift Technology SAS Charles Taylor Limited

Latest Developments

Based on research conducted by NMSC, the following verified developments from 2025 and 2026 most clearly affect the market.

Date Event
October 2026 Guidewire introduced an agentic AI platform that places AI agents inside its claims applications, covering first notice of loss through adjudication. Some features are limited to early access customers or remain on the roadmap.
August 2026 n2uitive launched a cloud native accelerator for Guidewire ClaimCenter that lets adjusters initiate, capture and access recorded statements inside the claims system.
May 2026 Sedgwick introduced Omni, a proprietary digital ecosystem that combines its claims data with AI and machine learning capabilities, announced at RISKWORLD 2026.
January 2026 Quantexa made its decision intelligence accelerator for Guidewire ClaimCenter globally available on the Guidewire Marketplace.
January 2025 CCC Intelligent Solutions completed its acquisition of EvolutionIQ, adding AI guidance for disability and injury claims management.

Expert Insights

Mona Barnes

Mona Barnes

Global Chief Claims Officer, Commercial Risk Solutions | Aon

"“The winners in the next decade won’t be the insurers that strip the most cost out of claims.”"

Analyst Interpretation

Barnes shared this perspective in Aon's Q2 2026 Global Insurance Market Overview, discussing the growing use of AI and digital tools in claims management.

Key Benefits for Stakeholders

How Do Insurance Carriers Benefit from Claims Modernization?

Carriers are the largest buyers at USD 27.08 Bn in 2025. They gain shorter cycle times, better fraud control and lower handling cost, but face integration burden and governance duties. Priority actions include moving to cloud claims, which grows at 10.96%, and piloting AI on low complexity files first. Early wins build internal confidence.

How Do Third-Party Administrators and Adjusting Firms Benefit?

Technology spending by Third-Party Administrators is projected to grow at a 7.45% CAGR, while the Third-Party Administration services segment is forecast to reach USD 21.91 Bn by 2035. They benefit from outsourcing demand and catastrophe surges but face margin pressure from automation. Likely actions include building proprietary digital platforms and offering blended service and software contracts. Scale helps absorb catastrophe peaks.

How Do Technology Vendors and Investors Benefit?

Software is the fastest growing component at 8.84%, led by Claims Analytics and AI. Vendors gain recurring revenue and marketplace reach, while investors gain exposure to sticky workflows. Constraints include long sales cycles and regulatory scrutiny of automated decisions. Vendors should invest in explainability and partner ecosystems. Partner extensions also increase platform stickiness.

Key Market Segments Evaluated

By Component

  • Software 
    • Claims Administration Platforms
    • Claims Analytics and AI
    • Fraud Detection and Prevention
  • Services 
    • Third-Party Administration
    • Loss Adjusting
    • Claims Outsourcing and Consulting

By Deployment Mode

  • Cloud
  • On-Premises
  • Hybrid

By Insurance Type

  • Motor
  • Property
  • Health
  • Life
  • Liability and Specialty

By Function

  • FNOL and Intake
  • Investigation and Adjudication
  • Fraud Detection and Subrogation
  • Settlement and Payment
  • Claims Reporting and Compliance

By End User

  • Insurance Carriers
  • Third-Party Administrators
  • Self-Insured Enterprises and Government
  • Brokers and Agents

By Region

  • North America 
    • U.S.
    • Canada
    • Mexico
  • Europe 
    • UK
    • Germany
    • France
    • Italy
    • Spain
    • Sweden
    • Denmark
    • Finland
    • Netherlands
    • Rest of Europe
  • Asia-Pacific 
    • China
    • India
    • Japan
    • South Korea
    • Taiwan
    • Indonesia
    • Vietnam
    • Australia
    • Philippines
    • Malaysia
    • Rest of APAC
  • Middle East & Africa 
    • Saudi Arabia
    • UAE
    • Egypt
    • Israel
    • Turkey
    • Nigeria
    • South Africa
    • Rest of MEA
  • Latin America 
    • Brazil
    • Argentina
    • Chile
    • Colombia
    • Rest of LATAM

Conclusion & Recommendations

The Claims Management Market is forecast to grow from USD 46.58 Bn in 2026 to USD 84.21 Bn by 2035 at 6.80%, adding USD 37.63 Bn. Software and cloud deployment outgrow the total, while services remain the largest revenue base. Growth is durable because claims volumes, regulatory duties and automation needs all persist across insurance cycles.

What Strategic Positioning Recommendations Does NMSC Offer?

NMSC's analysis indicates that providers should combine proprietary claims data, open integrations and expert services. Platform vendors should deepen marketplaces and agent governance. Administrators should build digital ecosystems that complement field teams. Specialists should target high return use cases such as fraud, subrogation and medical review. Execution speed will decide results.

How Attractive Is the Claims Management Market for Investment?

Our analysis indicates that investment opportunities are particularly attractive in businesses with recurring software revenue, proprietary claims data and established or expanding operations in Asia-Pacific. Services assets offer steady cash flow but face automation pressure. Investors should weigh catastrophe driven earnings swings, as Crawford's 2025 Platform Solutions decline illustrates. Diversified exposure across lines reduces volatility, and valuation discipline remains important.

What Are the Key Market Shifts and Risks in the Claims Management Market?

Key shifts include the move to agentic AI, cloud first claims cores and blended service plus software offers. Risks include integration failures, uneven AI regulation across states and countries, and talent shortages. Providers should track regulatory updates and invest in controls early. Vendors with clear audit features should gain trust, and buyers should plan phased rollouts.

What Are the Primary Growth Pathways Through 2035?

Three pathways stand out: AI enabled analytics and fraud control, cloud migration of mid size insurers, and expansion in Asia-Pacific, which grows at 8.82%. Each pathway rewards firms that integrate with existing carrier systems. Execution quality will separate leaders from followers. Partnerships with platform owners can speed entry, and vendors should budget for localization and compliance work.

Delivered Customizations

We have successfully delivered the following deep-dive customizations:

Client Request Customization Delivered Value Adds
Historical Claims Market Revenue Analysis
  • Historical revenue analysis of claims management software and services, 2019 to 2025, by component.
  • Shows which component is driving growth and where to focus investment and go-to-market effort.
Vendor Technology vs Services Revenue Split
  • Company-level revenue split between claims software and claims services, from public filings and segment disclosures.
  • Benchmarks how leading vendors balance product and service revenue, informing partnership and M&A targets.
Claims Market Sizing by Component
  • TAM, SAM and VAM estimates for claims management software and services, built from insurer spending and claim volume data.
  • Quantifies the addressable opportunity per component to prioritize market entry and sales capacity.
Software Subscription Transition Forecast
  • Forecast of claims software shifting from perpetual licences to cloud subscription revenue, based on listed vendors' recurring revenue disclosures.
  • Helps vendors time pricing model changes and estimate recurring revenue growth under SaaS adoption.
Claims Outsourcing Penetration Assessment
  • Share of claims handled by third-party administrators and outsourced services versus in-house handling, by insurance line.
  • Identifies outsourcing demand pockets to guide services portfolio expansion and TPA partnership strategy.
Insurance Line Claims Demand Mapping
  • Claims volume and component demand mapped across property and casualty, health, and life insurance lines using regulator and national statistics.
  • Pinpoints high-volume insurance lines where claims software and services offer the strongest near-term demand.

FAQs

Sources & References

1.

Crawford & Company, 2025 fourth quarter and full year results (Business Wire)

businesswire.com
2.

Crawford & Company, 2025 fourth quarter earnings release (investor relations)

s25.q4cdn.com
3.

Sedgwick Claims Management Services, Inc., Omni announcement (PR Newswire)

prnewswire.com
4.

n2uitive Corporation, accelerator for Guidewire ClaimCenter (PR Newswire)

prnewswire.com
5.

Quantexa, accelerator for Guidewire ClaimCenter on Guidewire Marketplace (GlobeNewswire)

aap.com.au
6.

CCC Intelligent Solutions, completion of EvolutionIQ acquisition (investor relations)

ir.cccis.com/node/9501/pdf
7.

Guidewire agentic AI platform launches coverage (IT Brief)

itbrief.co.nz
8.

National Association of Insurance Commissioners, AI model bulletin adoption map

content.naic.org
9.

Claims Journal, Crawford claims trends report coverage

claimsjournal.com

Investment Opportunities

Where Is Capital Concentrating in Claims Management?

Verified deal activity centers on AI capabilities. CCC used cash and stock to acquire EvolutionIQ, and Guidewire has expanded its agent tooling. Our assessment suggests that investors favor businesses with proprietary claims data, recurring revenue streams and deeply integrated claims-management workflows. Pure services assets draw less enthusiasm unless they pair expertise with technology. We expect continued selective consolidation.

How Does Infrastructure Investment Shape Capacity?

Cloud platforms and partner marketplaces set the capacity ceiling for automation. Cloud deployment is estimated to expand from USD 22.45 Bn in 2026 (rising from USD 20.09 Bn in 2025) to USD 57.26 Bn by 2035. Investment in system observability, data infrastructure and cybersecurity will influence the volume of claims that can be processed through automated workflows. Capacity planning should include catastrophe peaks.

What ESG Considerations Matter for Claims Providers?

Fair treatment of claimants, transparent AI decisions and climate related loss resilience are the main ESG themes. The NAIC bulletin ties AI use to documented programs and testing. Faster digital settlement also helps communities recover after disasters. Investors should check bias testing, data protection and audit readiness during diligence. Strong controls also protect brand trust.

About the Author

Mayurima Roy

Mayurima Roy

Mayurima Roy is Research Analyst at Next Move Strategy Consulting, where she has spent 4 years working across the firm's full industry coverage rather than a single fixed vertical. Her work centers on structured research, ongoing trend tracking, competitive assessment, and insight-led content development, translating complex market data into clear, decision-ready narratives that support informed client decision-making across diverse global industries, market sectors, and world regions every day.

About the Reviewer

Supradip Baul

Supradip Baul

Supradip Baul is an accomplished business consultant and strategist with over a decade of rich experience in market intelligence, strategy, technology, and business transformation. His work has included rigorous qualitative and quantitative analysis across multiple industries, helping clients shape investment decisions and long-term roadmaps. Earlier in his career, he was associated with Gartner, where he contributed to industry-leading reports and market share analyses. He has worked with leading global companies and holds an MBA with a dual specialization in Marketing and Finance.

Download Free Sample

Gustaf Hummel Burstrom

GUSTAF HUMMEL BURSTROM

Founder

Revline Tools AB

Joseph and the team at Next Move Strategy Consulting have been excellent to work with, in supplying us with relevant market data and forecasts for our specific category. We had some special requirements and they were able to do a custom package to suit our needs. We would definitely recommend them to any other company needing market data and forecasts

Mohit Agarwal

MOHIT AGARWAL

Chief Manager

DryChem India Pvt. Ltd.

Next Move Strategy Consulting is an amazing team of consultants. We required a market study report for our investors on top priority and the team went above and beyond our expectations to deliver the same with ample supporting data within a short time span enabling us to secure the investments and keep our project timeline maintained. Their professionalism, attention to detail, and timely delivery of actionable recommendations have left a lasting impression on our organization.

Pratyush Kumar Das

PRATYUSH KUMAR DAS

Assistant Manager

Polycab India Limited

We would like to express our appreciation for the data and insights provided by nextmsc. We are very pleased with the quality and depth of the information, which has proven to be highly valuable and beneficial for our business decision-making.

Nishant Awate

NISHANT AWATE

Business Development Global Sales

Zehnder Group Deutschland GmbH

Our experience working with Next Move Strategy Consulting was positive. The team was responsive, professional, and open to incorporating our specific requirements throughout the project. The India AHU market study was comprehensive and well structured, covering market value and volume forecasts, product and application segments, and key industry trends. The inclusion of both AHU and residential MVHR market insights made the study particularly relevant for our strategic market assessment. Overall, the report provides a solid foundation for evaluating market potential, identifying priority segments, and supporting business-development decisions in India.

Gaurav Jaiswal

GAURAV JAISWAL

Founder & CEO

Yano Charge Private Limited

The EV Charging market research report provided by the NextMSC was exceptionally detailed and insightful. It offered a comprehensive analysis that proved to be a game-changer for our strategic planning. Truly a testament to the NextMSC’s expertise and thoroughness in EV market landscape & analysis.

Custom Market Research Services

We will customize the research for you if the listed report does not fully match your requirements.

Get 30% Free Customization

Select License

This website uses cookies to ensure you get the best experience on our website. Learn more

✖