CPO Optical Interconnect Market Global Industry Analysis and Forecast (2026–2035)

Revenue climbs from USD 260.00 Million in 2025 to USD 7,200.00 Million by 2035 at a 31.8% CAGR over 2026–2035, powered by AI cluster power limits, 102.4 Tbps switch platforms and COUPE packaging, with North America leading.

Download Free Sample PDF
Base Year (2025)
$260.0 Million
Forecast (2035)
$7,200.0 Million
CAGR (2026-2035)
31.8%
Top Region
North America

What Is the CPO Optical Interconnect Market Size?

The global CPO Optical Interconnect Market was valued at USD 260.00 Million in 2025 and is estimated at USD 600.00 Million in 2026, forecast to reach USD 7,200.00 Million by 2035 at a CAGR of 31.8% from 2026 to 2035. North America leads with approximately 54% share, while optical engines hold approximately 48%.

As of October 2026, selected CPO platforms have progressed into shipment or initial production, although broader market adoption remains at an early stage. Broadcom announced shipments of its third-generation Tomahawk 6–Davisson switch on October 8, 2025, while Coherent expects initial CPO-related revenue in its December 2026 quarter. Buyers now evaluate optical interconnect content per switch port rather than per pluggable module, which shifts value toward optical engines, external lasers, and fiber attach assemblies. Concentrated supply among few qualified vendors makes early hyperscale commitments the main driver of revenue timing.

During our market evaluation, we noticed that leadership is forming around switch platforms, laser supply and packaging capacity.

CPO Optical Interconnect Market Global Industry Analysis and Forecast (2026–2035) Revenue Forecast

Values in USD Million

2025 $260.0 Million
2025
2026 $600.0 Million
2026
2027 $790.8 Million
2027
2028 $1,042.3 Million
2028
2029 $1,373.7 Million
2029
2030 $1,810.6 Million
2030
2031 $2,386.3 Million
2031
2032 $3,145.2 Million
2032
2033 $4,145.3 Million
2033
2034 $5,463.5 Million
2034
2035 $7,200.0 Million
2035

Key Takeaways

By Component: Optical engines held the largest share, expanding from USD 120.00 Million in 2025 to USD 3,300.00 Million by 2035; External laser sources are the fastest growing at 33.4% CAGR from 2026–2035.

By Application: Scale out switching held the largest share, expanding from USD 214.00 Million in 2025 to USD 4,320.00 Million by 2035; Scale up fabrics is the fastest growing at 48.2% CAGR from 2026–2035.

By End User: Hyperscale cloud providers held the largest share, expanding from USD 168.00 Million in 2025 to USD 4,610.00 Million by 2035; AI cloud and colocation providers is the fastest growing at 32.7% CAGR from 2026–2035.

Dominant Region: North America dominated with approximately 54% revenue share in 2026, anchored by the headquarters of leading switch, laser and fiber suppliers and the largest hyperscale clusters.

Fastest-Growing Region: Asia-Pacific is expected to register the highest CAGR of 33.4% during 2026–2035, driven by Taiwan packaging and photonics capacity.

Dominant Country: The U.S. led the market with an estimated USD 128.00 Million in 2025, supported by hyperscale deployment of NVIDIA and Broadcom platforms.

Fastest-Growing Country: India is the fastest growing listed country, projected to expand from USD 3.00 Million in 2025 at a CAGR of 36.3%, driven by greenfield AI campuses.

CPO optical interconnect offers an absolute opportunity of USD 6,600.00 Million between 2026 and 2035, favouring external laser sources and scale up fabrics.

According to NMSC analysis, the most important structural shift is the rise of external laser sources as a separately sourced subsystem, because shared laser supply lets switch makers keep heat away from optical engines. Our assessment indicates that this separation raises the strategic value of laser capacity, as shown by NVIDIA committing USD 2,000 Million each to Lumentum and Coherent in March 2026.

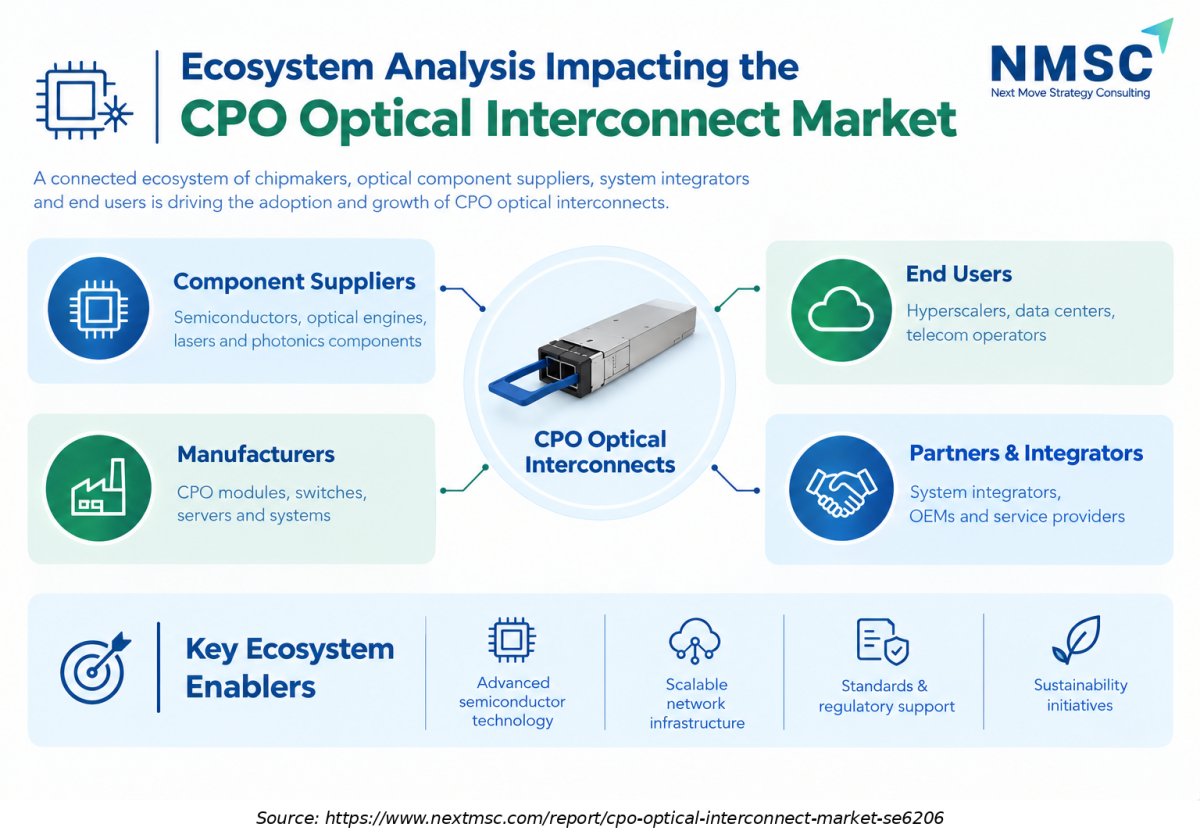
Ecosystem Analysis Impacting the CPO Optical Interconnect Market

The infographic maps optical-engine and laser suppliers, silicon-photonics foundries, packaging and fiber-connectivity partners, CPO platform developers, and hyperscale end users. It highlights how packaging yields, laser reliability, interoperability standards, and power efficiency influence market adoption.

What Does the CPO Optical Interconnect Market Encompass?

The CPO Optical Interconnect Market covers the optical subsystems integrated into the same package as switch ASICs or accelerators, namely optical engines, external laser sources, fiber attach and connectivity assemblies, and the integration and packaging services that join them. It excludes switch silicon, chassis, conventional pluggable transceivers, and near-packaged optics (NPO) to maintain a distinct market boundary and avoid double counting across adjacent connectivity categories. Revenue is recorded at the point of sale of each subsystem to a switch maker, accelerator vendor or hyperscale.

Technology adoption is progressing across several architectures, including on-substrate optical engines for switches, interposer-integrated engines for accelerators, and optical I/O chiplets for scale-up fabrics. Interoperability efforts include the Optical Compute Interconnect Multi-Source Agreement (OCI MSA). On May 4, 2026, GlobalFoundries introduced its SCALE CPO optical module as an OCI MSA-capable platform. Power availability is a major infrastructure constraint rather than a regulation in itself. The IEA's 2026 update projects global data-center electricity consumption to increase from approximately 485 TWh in 2025 to around 950 TWh in 2030.

Market Drivers & Dynamics

Interactive Dataset
AI cluster power and thermal limits driver +7.5% Global, led by North America and Asia-Pacific 2026–2032
Switch capacity moving to 102.4 Tbps and beyond driver +6.0% Global 2026–2032
Hyperscaler and chip vendor supply commitments driver +4.5% North America and Taiwan 2026–2029
Scale up optical I/O adoption in accelerators driver +5.0% North America and Asia-Pacific 2027–2035
Engine yield and packaging capacity constraints restraint −4.5% Taiwan and U.S. 2026–2028
Laser reliability and serviceability concerns versus pluggables restraint −3.0% Global 2026–2029
Improving pluggable and linear optics restraint −3.5% Global 2026–2030
Interoperability gaps across multivendor designs restraint -2.0% Global 2026–2028
Source: Next Move Strategy Consulting

Growth Drivers

What is the primary growth driver of the CPO Optical Interconnect Market?

The primary driver is the power and bandwidth demand of AI clusters. The IEA's 2026 update projects total data-center electricity consumption to rise from approximately 485 TWh in 2025 to 950 TWh in 2030. NVIDIA has highlighted the energy-efficiency benefits of CPO, making power consumption per port an important design consideration.

How is rising AI cluster scale driving the market growth?

NVIDIA reports that its photonics switches deliver 3.5 times better power efficiency, 10 times better resiliency and 4 times fewer lasers than traditional approaches. Broadcom's third generation Davisson platform doubled CPO switching capacity to 102.4 Tbps using 16 optical engines of 6.4 Tbps each. As cluster sizes grow, these gains translate directly into demand for engines, lasers and fiber attach content in datacenternetworking fabrics.

Growth Inhibitors

What is restraining the CPO Optical Interconnect Market?

Supply readiness is the main restraint. Fabrinet states that CPO opportunities remain at an early stage without substantial financial impact, and Coherent expects initial CPO revenue only from the December 2026 quarter. We estimate that engine yield, laser capacity and packaging allocation cap 2026 revenue at USD 600.00 Million despite strong customer interest, and serviceability concerns relative to pluggables also slow deployment.

What Are the Growth Opportunities?

How Can Scale Up Optical I/O Create a New Revenue Pool?

Replacing copper links between accelerators inside a rack with optical I/O creates a pool that pluggable transceivers never addressed. Chiplet vendors such as Ayar Labs and Lightmatter, and platform owners such as Marvell, can sell engines that sit beside accelerators in the package. Hyperscale operators designing custom accelerators are the primary beneficiaries, since optical reach lets them build larger coherent compute domains.

Can Test and Reliability Services Become a Profit Pool?

CPO packages are difficult to repair after assembly, so testing optical engines, lasers and fiber attach before final integration protects expensive switch silicon. Contract manufacturers and test specialists that build engine screening, burn in and alignment inspection can earn recurring revenue from every program. Integration and packaging providers are the main beneficiaries, as quality evidence becomes a condition for hyperscale qualification.

How Can Regional Packaging and Connectivity Hubs Capture Localized Demand?

Customer pressure to localize manufacturing is creating regional hubs. Corning will build three plants in North Carolina and Texas, and TSMC concentrates COUPE packaging in Taiwan. Suppliers that place photonic wafers, fiber attach and testing near hyperscale campuses shorten logistics and qualification cycles, which benefits the fiber attach and integration segments in North America and Asia-Pacific.

Segmentation Analysis

2025 (USD Million)
2035 (USD Million)
Optical engines 2025: $120.0 Million | 2035: $3,300.0 Million
Optical engi
External laser sources 2025: $52.0 Million | 2035: $1,680.0 Million
External las
Fiber attach and connectivity 2025: $44.0 Million | 2035: $1,300.0 Million
Fiber attach
Integration and packaging 2025: $44.0 Million | 2035: $920.0 Million
Integration
Optical engines $120.0 Million $3,300.0 Million 31.1%
External laser sources $52.0 Million $1,680.0 Million 33.4%
Fiber attach and connectivity $44.0 Million $1,300.0 Million 32.7%
Integration and packaging $44.0 Million $920.0 Million 30.5%

Which Component Leads the CPO Optical Interconnect Market?

Optical engines are the dominant component, growing from USD 120.00 Million in 2025 to USD 3,300.00 Million by 2035, because every CPO design needs photonic and electronic dies packaged together. External laser sources are the fastest growing at 33.4% CAGR from 2026 to 2035, supported by NVIDIA purchase commitments and capacity expansion at Lumentum and Coherent. Fiber attach and integration services follow closely as packaging yields mature.

2025 (USD Million)
2035 (USD Million)
Scale out sw
Scale up fab
Telecom
HPC and ente
Segment Item 2025 (USD Million) 2035 (USD Million) CAGR
Scale out switching $10.0 USD Million $40.0 USD Million 25.0%
Scale up fabrics $17.1 USD Million $51.1 USD Million 11.0%
Telecom $24.2 USD Million $62.2 USD Million 25.0%
HPC and enterprise networking $31.3 USD Million $73.3 USD Million 11.0%

Segment-wise data is locked

Unlock complete segment-wise numbers for By Application.

Unlock Full Data
2025 (USD Million)
2035 (USD Million)
Hyperscale c
AI cloud and
Enterprise
HPC and tele
Segment Item 2025 (USD Million) 2035 (USD Million) CAGR
Hyperscale cloud providers $10.0 USD Million $40.0 USD Million 27.0%
AI cloud and colocation providers $17.1 USD Million $51.1 USD Million 9.0%
Enterprise $24.2 USD Million $62.2 USD Million 19.0%
HPC and telecom operators $31.3 USD Million $73.3 USD Million 17.0%

Segment-wise data is locked

Unlock complete segment-wise numbers for By End User.

Unlock Full Data

Growth Opportunities

NMSC's analysis indicates that three opportunity pools offer the most attractive risk adjusted returns for suppliers and investors through 2035.

How Can Scale Up Optical I/O Create a New Revenue Pool?

Replacing copper links between accelerators inside a rack with optical I/O creates a pool that pluggable transceivers never addressed. Chiplet vendors such as Ayar Labs and Lightmatter, and platform owners such as Marvell, can sell engines that sit beside accelerators in the package. Hyperscale operators designing custom accelerators are the primary beneficiaries, since optical reach lets them build larger coherent compute domains.

Can Test and Reliability Services Become a Profit Pool?

CPO packages are difficult to repair after assembly, so testing optical engines, lasers and fiber attach before final integration protects expensive switch silicon. Contract manufacturers and test specialists that build engine screening, burn in and alignment inspection can earn recurring revenue from every program. Integration and packaging providers are the main beneficiaries, as quality evidence becomes a condition for hyperscale qualification.

How Can Regional Packaging and Connectivity Hubs Capture Localized Demand?

Customer pressure to localize manufacturing is creating regional hubs. Corning will build three plants in North Carolina and Texas, and TSMC concentrates COUPE packaging in Taiwan. Suppliers that place photonic wafers, fiber attach and testing near hyperscale campuses shorten logistics and qualification cycles, which benefits the fiber attach and integration segments in North America and Asia-Pacific.

Regional Outlook

2025 (USD Million)
2035 (USD Million)
North Americ
Europe
Asia-Pacific
Middle East
Latin Americ
Region 2025 (USD Million) 2035 (USD Million) CAGR (%)
North America $10.0 USD Million $40.0 USD Million 9.0%
Europe $17.1 USD Million $51.1 USD Million 27.0%
Asia-Pacific $24.2 USD Million $62.2 USD Million 25.0%
Middle East & Africa $31.3 USD Million $73.3 USD Million 23.0%
Latin America $38.4 USD Million $84.4 USD Million 12.0%

Regional data is locked

Unlock complete regional numbers for this market.

Unlock Full Data

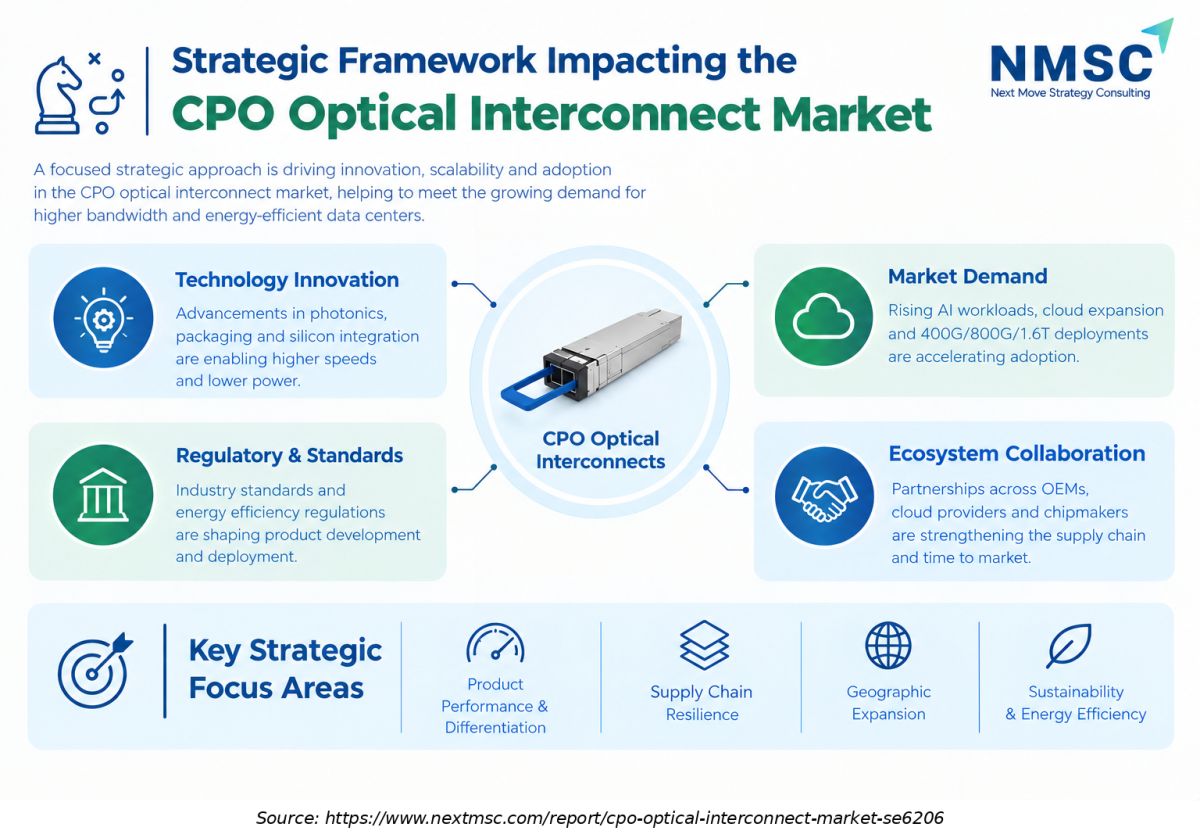
Strategic Framework Impacting the CPO Optical Interconnect Market

Strategic Framework Impacting the CPO Optical Interconnect Market
The infographic highlights key strategies shaping the CPO Optical Interconnect Market, including photonics innovation, silicon integration, growing AI infrastructure demand, and strategic partnerships. It shows how performance improvements, supply chain resilience, geographic expansion, and energy efficiency support long-term market growth.

Competitive Landscape

Our assessment indicates that the competitive landscape is concentrated, with platform owners, laser suppliers and packaging partners forming interdependent alliances.

How Do Companies Compete in the CPO Optical Interconnect Market?

Competition in the CPO Optical Interconnect Market centers on system-level power per bit, delivery certainty, and ecosystem breadth rather than unit price. NVIDIA and Broadcom compete through their CPO networking platforms and associated supply chains. Smaller firms differentiate through optical-chiplet designs and specialized technologies, while hyperscale’s exercise leverage through qualification requirements and volume commitments.
How Do Leaders Differentiate Through Innovation?

Innovation focuses on higher lane speeds, lower laser count and easier serviceability. NVIDIA claims four times fewer lasers than traditional designs, Broadcom reached 6.4 Tbps engines on its third-generation platform, and Lightmatter offers 64 Tbps 3D CPO engines. GlobalFoundries launched an OCI MSA capable SCALE module in May 2026 to standardize scale up optics. These steps lower integration risk for accelerator designers and widen the addressable market.

What Role Does M&A Play in Consolidation?

Strategic transactions secure scarce capabilities rather than consolidate share. Marvell completed its Celestial AI acquisition on 2 February 2026, adding about USD 50 Million in annual operating expense, and NVIDIA invested USD 2,000 Million each in Lumentum and Coherent. Corning pairs capacity commitments with an NVIDIA partnership. We expect further minority stakes, capacity prepayments and tuck in deals for fiber attach and test technology.

Key Market Players

We found that eleven verified companies currently supply CPO platforms, optical subsystems or packaging, ranked here by operational scale.

NVIDIA Corporation Broadcom Inc. Taiwan Semiconductor Manufacturing Company Limited Coherent Corp. Lumentum Holdings Inc. Marvell Technology, Inc. Corning Incorporated GlobalFoundries Inc. Fabrinet Ayar Labs, Inc. Lightmatter, Inc.

Latest Developments

Based on research conducted by NMSC, we found that recent announcements concentrate on production ramps, capacity investments and strategic financing.

Date Event
18 March 2025 NVIDIA announces Spectrum-X Photonics and Quantum-X Photonics CPO switches with TSMC, Coherent, Corning, Foxconn, Lumentum and SENKO.
8 October 2025 Broadcom announces it is shipping Tomahawk 6 Davisson, its third generation 102.4 Tbps CPO Ethernet switch.
2 February 2026 Marvell completes its acquisition of Celestial AI and its Photonic Fabric optical interconnect technology.
6 May 2026 NVIDIA and Corning announce a multiyear partnership to expand U.S. optical connectivity manufacturing capacity tenfold.

Expert Insights

Manish Mehta

Manish Mehta

Vice President, Marketing and Operations | Broadcom Optical Systems Division

"By co-packing the optical interconnect directly on a common substrate, you can eliminate a lot of that functionality and therefore reduce the power."

Analyst Interpretation

The statement highlights power efficiency as a key technical consideration in CPO adoption. Integrating optical components closer to switching silicon reduces the length of electrical signal paths and can eliminate some power-consuming circuitry. As AI networks require higher bandwidth and density, these architectural benefits are supporting the development of integrated optical interconnect solutions.

Investment Opportunities

Where Are Capital Inflows Concentrating?

Capital is flowing to vendors that control scarce inputs. NVIDIA committed USD 2,000 Million each to Lumentum and Coherent in March 2026, Ayar Labs raised USD 650 Million during 2026, and Marvell absorbed Celestial AI. Investors should expect further funding rounds for optical-chiplet developers and laser suppliers as hyperscalers diversify their supply chains. Returns may favor firms with qualified products and secured foundry capacity, while pre-revenue developers face valuation risks if production ramps are delayed.

How Is Infrastructure Investment Reshaping Capacity?

Infrastructure spending targets lasers, fiber connectivity and packaging. Lumentum plans a new U.S. fab, Corning will build three plants in North Carolina and Texas, and TSMC is scaling COUPE alongside CoWoS. These projects take years to qualify, so capacity added in 2026 and 2027 determines how quickly revenue can reach the volume window that follows. Suppliers with committed customers can underwrite capital expenditure at lower risk.

What ESG Considerations Matter for Investors?

CPO reduces optical power per bit, which supports operators facing grid limits and emissions targets and fits the agenda of sustainable computing. NVIDIA cites a 3.5 times power efficiency gain, and the IEA expects data center electricity demand to reach around 945 TWh by 2030. Investors should also assess laser materials sourcing, water use in photonic wafer fabs and recyclability of fiber assemblies. Governance risks include supply concentration among few foundries and lock in around proprietary architectures.

Key Benefits for Stakeholders

How Does the Report Help Hyperscale and Enterprise Operators?

Operators gain a view of when CPO becomes deployable at scale, which components limit supply and how switch generations change optical content per port. The segmentation by component, application and end user helps procurement teams size laser, engine and fiber needs, while regional analysis supports site planning for datacenterinfrastructure. Our forecasts help operators time pilots in 2026 and 2027 before volume purchasing in later years.

How Does the Report Help Investors and Financial Analysts?

Investors in the CPO Optical Interconnect Market receive reconciled forecasts that sum to the global total, a ranked list of eleven verified vendors and an assessment of where value accrues along the supply chain. The analysis highlights external laser sources and scale up fabrics as the fastest growing segments, and it identifies capacity commitments that indicate revenue visibility. Risk factors such as yield, packaging allocation and pluggable competition support scenario planning.
How Does the Report Help Technology Vendors and Product Teams?

Vendors can benchmark positioning against platform owners, foundry enablers, component specialists and optical I/O innovators. The report maps adoption timing for scale out switching and scale up fabrics, which guides roadmap sequencing for engines, lasers and connectors. Product teams can use the country and regional estimates to prioritize qualification partners, localized assembly and service coverage.

Key Market Segments Evaluated

By Component

  • Optical engines
  • External laser sources
  • Fiber attach and connectivity
  • Integration and packaging

By Application

  • Scale out switching
  • Scale up fabrics
  • Telecom, HPC and enterprise networking

By End User

  • Hyperscale cloud providers
  • AI cloud and colocation providers
  • Enterprise, HPC and telecom operators

By Region

  • North America 
    • U.S.
    • Canada
    • Mexico
  • Europe 
    • UK
    • Germany
    • France
    • Italy
    • Spain
    • Sweden
    • Denmark
    • Finland
    • Netherlands
    • Rest of Europe
  • Asia-Pacific 
    • China
    • India
    • Japan
    • South Korea
    • Taiwan
    • Indonesia
    • Vietnam
    • Australia
    • Philippines
    • Malaysia
    • Rest of APAC
  • Middle East & Africa 
    • Saudi Arabia
    • UAE
    • Egypt
    • Israel
    • Turkey
    • Nigeria
    • South Africa
    • Rest of MEA
  • Latin America 
    • Brazil
    • Argentina
    • Chile
    • Colombia
    • Rest of LATAM

Conclusion & Recommendations

Our analysis shows that revenue should multiply twelve times between 2026 and 2035, compounding at 31.8% annually as production ramps in 2027 and 2028 and scale up fabrics mature. Within the CPO Optical Interconnect Market, optical engines remain the largest component, but external laser sources and fiber attach assemblies gain share as bottlenecks shift. The outlook depends on engine yield, packaging allocation and reliability evidence from early hyperscale deployments.

What Strategic Positioning Recommendations Does NMSC Offer?

We recommend that platform owners secure multiyear laser and packaging capacity, that component suppliers qualify with at least two platform ecosystems, and that start-ups focus on scale up optical I/O where standards remain open. Operators should run pilots with at least two vendor architectures to avoid lock in. Positioning around power per bit, test coverage and delivery certainty will matter more than list price through 2030.

How Strong Is the Investment Attractiveness of This Market?

Investment attractiveness is high but uneven. Supply constrained inputs such as ultra-high-power lasers, fiber connectivity and advanced packaging offer visible demand supported by customer commitments, while pre revenue developers carry technology and funding risk. We assess scale up fabrics as the highest growth option at 48.2% CAGR from 2026 to 2035, and scale out switching as the largest base at USD 4,320.00 Million by 2035.

What Are the Market Shifts and Key Risks in This Market?

Key shifts include the move from pluggable to co packaged architectures, the separation of laser sources from engines and the extension of optics into accelerator packages. Risks include engine yield, laser reliability, packaging allocation and improving pluggable or linear optics that delay adoption. Concentration among few foundries and platform owners also creates customer dependency, and a slower volume ramp would reduce 2035 revenue below our forecast.

What Are the Primary Growth Pathways Through 2035?

Growth pathways include volume ramps of Broadcom and NVIDIA switches in 2027 and 2028, entry of scale up CPO from the second half of calendar 2027, and wider adoption by AI cloud and colocation providers. Further upside comes from standardization through the OCI MSA, localization of fiber and laser manufacturing, and emerging markets in India and the Gulf. Suppliers that align capacity with these pathways capture the largest share.

FAQs

Sources & References

1.

NVIDIA Investor Relations, Spectrum-X Photonics announcement (18 March 2025)

investor.nvidia.com
2.

NVIDIA Technical Blog, How Industry Collaboration Fosters NVIDIA Co-Packaged Optics

developer.nvidia.com
3.

Optica Optics and Photonics News, NVIDIA Looks to Co-Packaged Optics for AI Factories

optica-opn.org
4.

Optica Optics and Photonics News, Nvidia Invests US$4 Billion in Photonic Technology

optica-opn.org
5.

Broadcom Investor Relations, Tomahawk 6 Davisson release (8 October 2025)

investors.broadcom.com
6.

Broadcom Investor Relations, Tomahawk 6 shipping release

investors.broadcom.com
7.

Broadcom Investor Relations, fiscal Q2 2026 earnings conference call (3 June 2026)

investors.broadcom.com
8.

TSMC North America Technology Symposium press release, COUPE roadmap

businesswire.com
9.

Marvell Investor Relations, Completion of Celestial AI acquisition

investor.marvell.com
10.

Lumentum Holdings, Form 8-K fiscal 2026 results (SEC)

sec.gov
11.

Lumentum Holdings, fiscal 2026 annual report to shareholders (SEC)

sec.gov
12.

Coherent Corp., Fourth quarter and fiscal year 2026 results

coherent.com
13.

Coherent Corp., Form 8-K fiscal 2026 results (SEC)

sec.gov
14.

Corning Incorporated, NVIDIA and Corning partnership release (6 May 2026)

corning.com
15.

GlobalFoundries, Form 6-K first quarter 2026 (SEC)

sec.gov
16.

GlobalFoundries, SCALE CPO optical module release (4 May 2026)

nasdaq.com
17.

Fabrinet, Form 8-K fiscal 2026 results (SEC)

sec.gov
18.

Ayar Labs, press release on TeraPHY optical I/O demonstration

businesswire.com
19.

Lightmatter, press releases including Passage L200 announcement

businesswire.com
20.

International Energy Agency, Energy and AI report announcement

iea.org

About the Author

Mayurima Roy

Mayurima Roy

Mayurima Roy is Research Analyst at Next Move Strategy Consulting, where she has spent 4 years working across the firm's full industry coverage rather than a single fixed vertical. Her work centers on structured research, ongoing trend tracking, competitive assessment, and insight-led content development, translating complex market data into clear, decision-ready narratives that support informed client decision-making across diverse global industries, market sectors, and world regions every day.

About the Reviewer

Supradip Baul

Supradip Baul

Supradip Baul is an accomplished business consultant and strategist with over a decade of rich experience in market intelligence, strategy, technology, and business transformation. His work has included rigorous qualitative and quantitative analysis across multiple industries, helping clients shape investment decisions and long-term roadmaps. Earlier in his career, he was associated with Gartner, where he contributed to industry-leading reports and market share analyses. He has worked with leading global companies and holds an MBA with a dual specialization in Marketing and Finance.

Download Free Sample

Mohit Agarwal

MOHIT AGARWAL

Chief Manager

DryChem India Pvt. Ltd.

Next Move Strategy Consulting is an amazing team of consultants. We required a market study report for our investors on top priority and the team went above and beyond our expectations to deliver the same with ample supporting data within a short time span enabling us to secure the investments and keep our project timeline maintained. Their professionalism, attention to detail, and timely delivery of actionable recommendations have left a lasting impression on our organization.

Nishant Awate

NISHANT AWATE

Business Development Global Sales

Zehnder Group Deutschland GmbH

Our experience working with Next Move Strategy Consulting was positive. The team was responsive, professional, and open to incorporating our specific requirements throughout the project. The India AHU market study was comprehensive and well structured, covering market value and volume forecasts, product and application segments, and key industry trends. The inclusion of both AHU and residential MVHR market insights made the study particularly relevant for our strategic market assessment. Overall, the report provides a solid foundation for evaluating market potential, identifying priority segments, and supporting business-development decisions in India.

Gustaf Hummel Burstrom

GUSTAF HUMMEL BURSTROM

Founder

Revline Tools AB

Joseph and the team at Next Move Strategy Consulting have been excellent to work with, in supplying us with relevant market data and forecasts for our specific category. We had some special requirements and they were able to do a custom package to suit our needs. We would definitely recommend them to any other company needing market data and forecasts

Gaurav Jaiswal

GAURAV JAISWAL

Founder & CEO

Yano Charge Private Limited

The EV Charging market research report provided by the NextMSC was exceptionally detailed and insightful. It offered a comprehensive analysis that proved to be a game-changer for our strategic planning. Truly a testament to the NextMSC’s expertise and thoroughness in EV market landscape & analysis.

Robert Sean Trevino

ROBERT SEAN TREVINO

Sr. Director, Head of Strategic Insights & Analytics

Foundation Medicine

I realized that it was a reliable source of information. These days, there are many people who are looking for authentic data, and this is one of the only sources that can offer them with what they need;

Custom Market Research Services

We will customize the research for you if the listed report does not fully match your requirements.

Get 30% Free Customization

Select License

This website uses cookies to ensure you get the best experience on our website. Learn more

✖