Data Center Interconnect Market Global Industry Analysis and Forecast (2026–2035)

The Data Center Interconnect Market was valued at USD 7.80 Billion in 2025 and is projected to reach USD 41.00 Billion by 2035, growing at a CAGR of 16.0% from 2026 to 2035. Key growth drivers include AI-driven data center expansion, hyperscale cloud investments, rising demand for high-speed coherent pluggable optics, and multi-campus AI connectivity, with North America leading the market.

Download Free Sample PDF
Base Year (2025)
$7.80 Billion
Forecast (2035)
$41.00 Billion
CAGR (2026-2035)
16.0%
Top Region
North America

What Is the Data Center Interconnect Market Size?
The global Data Center Interconnect Market was valued at USD 7.80 Billion in 2025 and is estimated at USD 10.80 Billion in 2026. It is forecast to reach USD 41.00 Billion by 2035, a CAGR of 16.0% from 2026 to 2035. North America leads with approximately 43% share, while DCI platforms and line systems hold approximately 45% of revenue.

We observed that hyperscale operators now spread AI training across several campuses because single sites hit limits on grid power and land. That shift turns interconnect from a background utility into a planned capacity line item, and vendors reported record optical orders through 2026. Ciena, Cisco and Nokia each disclosed growth tied to cloud and AI customers, which supports our view that demand in the data center interconnect market is structural rather than cyclical.

Based on our market evaluation, we identified that growth concentrates heavily in high-speed optical components and AI-driven interconnect applications, as summarized in the table below.

Data Center Interconnect Market Global Industry Analysis and Forecast (2026–2035) Revenue Forecast

Values in USD Billion

2025 $7.80 Billion
2025
2026 $10.80 Billion
2026
2027 $12.53 Billion
2027
2028 $14.53 Billion
2028
2029 $16.86 Billion
2029
2030 $19.55 Billion
2030
2031 $22.68 Billion
2031
2032 $26.31 Billion
2032
2033 $30.52 Billion
2033
2034 $35.41 Billion
2034
2035 $41.00 Billion
2035

Key Takeaways

By Component: DCI platforms and line systems held the largest share, expanding from USD 3.50 Billion in 2025 to USD 13.00 Billion by 2035; Coherent pluggable optics is the fastest growing at 18.5% CAGR from 2026–2035.

By Application: Content delivery and cloud connectivity held the largest share, expanding from USD 2.80 Billion in 2025 to USD 12.80 Billion by 2035; AI cluster scale across is the fastest growing at 23.0% CAGR from 2026–2035.

By End User: Cloud service providers and “hyperscalers” held the largest share, expanding from USD 4.35 Billion in 2025 to USD 26.00 Billion by 2035; Colocation and data center operators is the fastest growing at 18.5% CAGR from 2026–2035.

Dominant Region: North America dominated with approximately 43% revenue share in 2025, equal to USD 3.35 Billion, anchored by hyperscale campus clusters across the United States.

Fastest-Growing Region: Asia-Pacific is expected to register the highest CAGR of 17.7% during 2026–2035, driven by cloud and AI buildouts in China and India.

Dominant Country: The U.S. led the market with an estimated USD 3.05 Billion in 2025, supported by the densest concentration of hyperscale cloud regions.

Fastest-Growing Country: India is projected to expand from USD 0.25 Billion in 2025 at a CAGR of 20.3% during 2026–2035, driven by new cloud regions and data center parks.

The Data Center Interconnect Market offers an absolute investment opportunity of approximately USD 30.20 Billion between 2026 and 2035, the gap between the USD 41.00 Billion forecast for 2035 and the USD 10.80 Billion base in 2026. Coherent pluggable optics and open optical line systems look like the most capital efficient categories for network investors.

According to NMSC analysis, the move from standalone transponders to coherent pluggables that plug directly into routers is the most structurally important shift, because it lets “hyperscalers” add interconnect capacity at switch speed and cost. Chassis vendors defend share through open line systems and automation software. Operators that master both layers will capture the largest share of incremental spend.

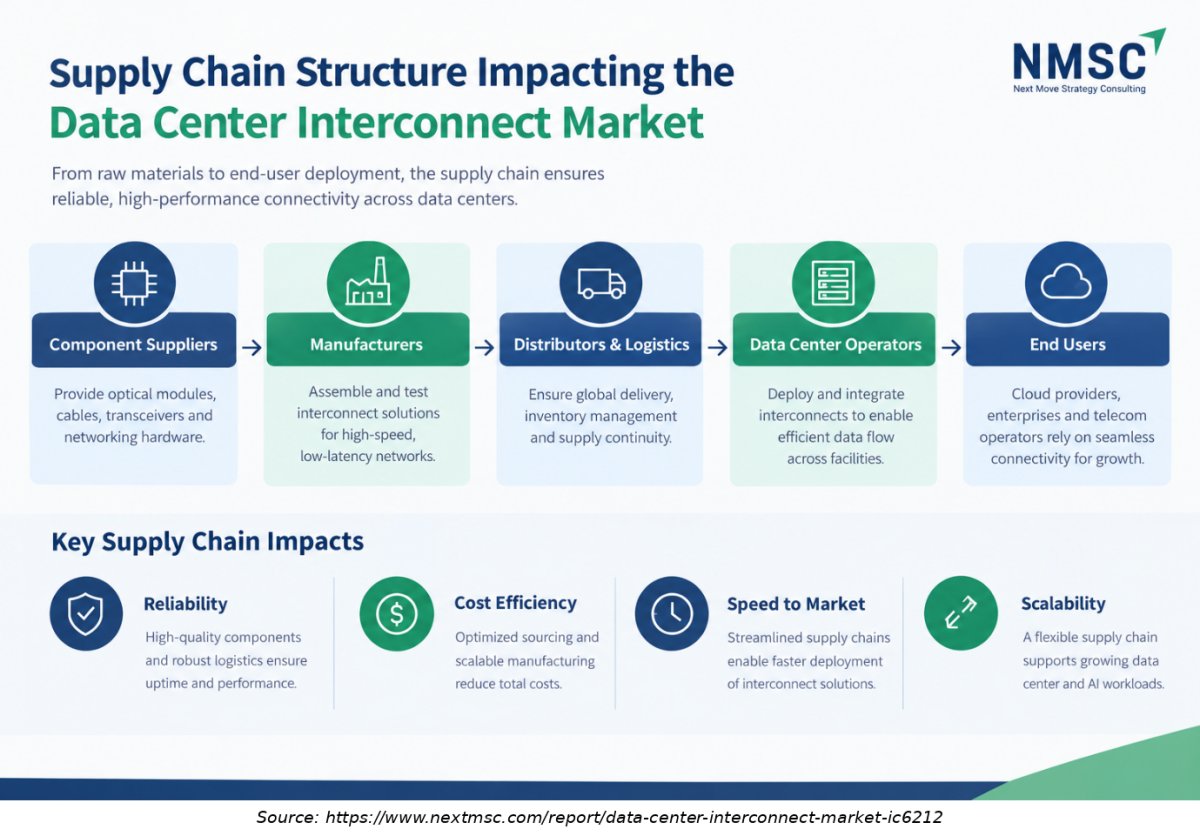
Supply Chain Structure Impacting the Data Center Interconnect Market

Supply Chain Structure Impacting the Data Center Interconnect Market
The Data Center Interconnect supply chain connects component suppliers, manufacturers, distributors, and data center operators. Efficient sourcing, reliable logistics, and scalable infrastructure support cost optimization, faster deployment, and seamless connectivity.

What Does the Data Center Interconnect Market Encompass?
The Data Center Interconnect Market covers the optical transport platforms, coherent pluggable modules, optical line systems, management software and professional services that link two or more data centers across campus, metro and regional distances. It excludes switching inside the data center, colocation cross connects and general long haul carrier transport, which belong to adjacent markets. This market report sizes the revenue vendors earn from interconnect deployments, expressed in USD Billion.
Structural evolution is visible in the move from fixed transponder shelves to disaggregated designs, where IP routers carry 400ZR and 800ZR optics over open line systems. Marvell introduced a 1.6T ZR/ZR+ pluggable in March 2026, showing how quickly port rates are rising. The regulatory backdrop adds weight, because the EU Energy Efficiency Directive requires operators of data centres above 500 kW to report energy performance, which favours efficient optics.

Market Drivers & Dynamics

Interactive Dataset
AI cluster scale across architectures driver +3.2% North America, Asia-Pacific 2026–2032
Hyperscaler capital expenditure growth driver +2.8% North America, Europe, Asia-Pacific 2026–2030
Shift to 800ZR and 1.6T coherent pluggables driver +2.1% Global 2026–2033
Power and grid limits on single sites driver +1.6% North America, Europe 2026–2035
Component and memory supply constraints restraint −1.4% Global 2026–2028
Fiber availability and permitting delays restraint −0.9% Europe, North America 2026–2030
Export controls and vendor access limits restraint −0.8% Asia-Pacific, Middle East & Africa 2026–2031
Price erosion from pluggable commoditisation restraint −0.7% Global 2027–2035
Source: Next Move Strategy Consulting

Growth Drivers

What is the primary growth driver of the Data Center Interconnect Market?

Hyperscaler spending on AI infrastructure is the primary driver. Alphabet raised its 2026 capital expenditure guidance to between USD 180 Billion and USD 190 Billion in April 2026, and Cisco booked USD 9.30 Billion of hyperscale AI infrastructure orders in fiscal 2026. Each new campus needs diverse fiber routes and optical capacity back to existing regions, so revenue in the data center interconnect market follows capital spending with a short lag.

How is power scarcity driving the market growth?

Electricity limits push operators to spread AI capacity across several sites. The IEA projects data centre electricity consumption to more than double to around 945 TWh by 2030, with the United States accounting for nearly half of demand growth. When one campus cannot secure enough power, operators build in several regions and connect them with high-capacity optical links. We found that the data center interconnect market favours coherent pluggables and open line systems, which add bandwidth without new fiber.

Growth Inhibitors

What is restraining the Data Center Interconnect Market?

Supply constraints represent the primary market restraint. Cisco's fiscal 2026 SEC filing cites elevated memory costs as a product mix headwind, while Lumentum attributed 78% of its fiscal 2026 revenue growth to laser chip and optical assembly shipments (as detailed in Lumentum's FY2026 SEC Form 10-K), underscoring component supply tightness across the optical ecosystem. Fiber permitting and right of way delays in parts of Europe and North America add timing risk to new routes.

Segmentation Analysis

2025 (USD Billion)
2035 (USD Billion)
DCI platforms and line systems 2025: $3.50 Billion | 2035: $13.00 Billion
DCI platform
Coherent pluggable optics 2025: $2.90 Billion | 2035: $20.90 Billion
Coherent plu
Software 2025: $0.60 Billion | 2035: $3.00 Billion
Software
Services 2025: $0.80 Billion | 2035: $4.10 Billion
Services
DCI platforms and line systems $3.50 Billion $13.00 Billion 12.5%
Coherent pluggable optics $2.90 Billion $20.90 Billion 18.5%
Software $0.60 Billion $3.00 Billion 15.8%
Services $0.80 Billion $4.10 Billion 17.6%

Which component dominates the Data Center Interconnect Market?

DCI platforms and line systems lead with approximately 45% of 2025 revenue, reflecting the installed base of optical shelves and open line systems at cloud operators. Coherent pluggable optics is the fastest growing component at 18.5% CAGR from 2026 to 2035, because 800ZR and 1.6T modules plug directly into routers and switches. Marvell introduced the COLORZ 1600 in March 2026 and Coherent offers 800G ZR/ZR+ modules, which supports our growth assumption.

2025 (USD Billion)
2035 (USD Billion)
AI cluster s
Disaster rec
Workload and
Content deli
Segment Item 2025 (USD Billion) 2035 (USD Billion) CAGR
AI cluster scale across $10.0 USD Billion $40.0 USD Billion 18.0%
Disaster recovery and business continuity $17.1 USD Billion $51.1 USD Billion 16.0%
Workload and storage migration $24.2 USD Billion $62.2 USD Billion 22.0%
Content delivery and cloud connectivity $31.3 USD Billion $73.3 USD Billion 12.0%

Segment-wise data is locked

Unlock complete segment-wise numbers for By Application.

Unlock Full Data
2025 (USD Billion)
2035 (USD Billion)
Cloud servic
Colocation a
Telecom serv
Enterprises
Segment Item 2025 (USD Billion) 2035 (USD Billion) CAGR
Cloud service providers and “hyperscalers” $10.0 USD Billion $40.0 USD Billion 26.0%
Colocation and data center operators $17.1 USD Billion $51.1 USD Billion 16.0%
Telecom service providers $24.2 USD Billion $62.2 USD Billion 18.0%
Enterprises $31.3 USD Billion $73.3 USD Billion 8.0%

Segment-wise data is locked

Unlock complete segment-wise numbers for By End User.

Unlock Full Data
2025 (USD Billion)
2035 (USD Billion)
North Americ
U.S.
Canada
Mexico
Europe
Segment Item 2025 (USD Billion) 2035 (USD Billion) CAGR
North America $10.0 USD Billion $40.0 USD Billion 14.0%
U.S. $17.1 USD Billion $51.1 USD Billion 8.0%
Canada $24.2 USD Billion $62.2 USD Billion 14.0%
Mexico $31.3 USD Billion $73.3 USD Billion 24.0%
Europe $38.4 USD Billion $84.4 USD Billion 15.0%

Segment-wise data is locked

Unlock complete segment-wise numbers for By Region.

Unlock Full Data

Growth Opportunities

We found that three opportunity pools stand out for vendors and investors, each tied to a concrete deployment mechanism.

Where Does Scale Across Networking Create Value?

Multi campus AI training requires dedicated high-capacity links, which creates recurring demand for line systems, coherent pluggables and encryption. Cloud operators and AI hosting providers are the main buyers, and vendors that bundle open line systems with automation software capture larger orders. We project the AI and HPC cluster scale across application to grow from USD 2.70 Billion in 2026 to USD 17.40 Billion by 2035.

How Can Vendors Monetize Edge AI Inference Links?

As edge AI inference moves closer to users, regional data centers need metro links back to core training sites. Colocation and data center operators are the beneficiaries, because they host these smaller sites and buy interconnect for tenants. Vendors offering compact 400ZR and 800ZR modules with open line systems can serve many small sites efficiently, and colocation demand is forecast to rise at 18.5% CAGR from 2026 to 2035.

What Opportunity Exists in Emerging Region Cloud Builds?

India, Saudi Arabia and the UAE are adding cloud regions and data center parks that need domestic and cross border interconnect. Local operators and global vendors with regional presence benefit, particularly in routing, line systems and managed services. Based on our estimates, India grows at 20.3% CAGR from 2026 to 2035 and Saudi Arabia at 18.9%, both above the global rate of 16.0%.

Regional Outlook

2025 (USD Billion)
2035 (USD Billion)
North Americ
Europe
Asia-Pacific
Middle East
Latin Americ
Region 2025 (USD Billion) 2035 (USD Billion) CAGR (%)
North America $10.0 USD Billion $40.0 USD Billion 9.0%
Europe $17.1 USD Billion $51.1 USD Billion 27.0%
Asia-Pacific $24.2 USD Billion $62.2 USD Billion 25.0%
Middle East & Africa $31.3 USD Billion $73.3 USD Billion 23.0%
Latin America $38.4 USD Billion $84.4 USD Billion 12.0%

Regional data is locked

Unlock complete regional numbers for this market.

Unlock Full Data

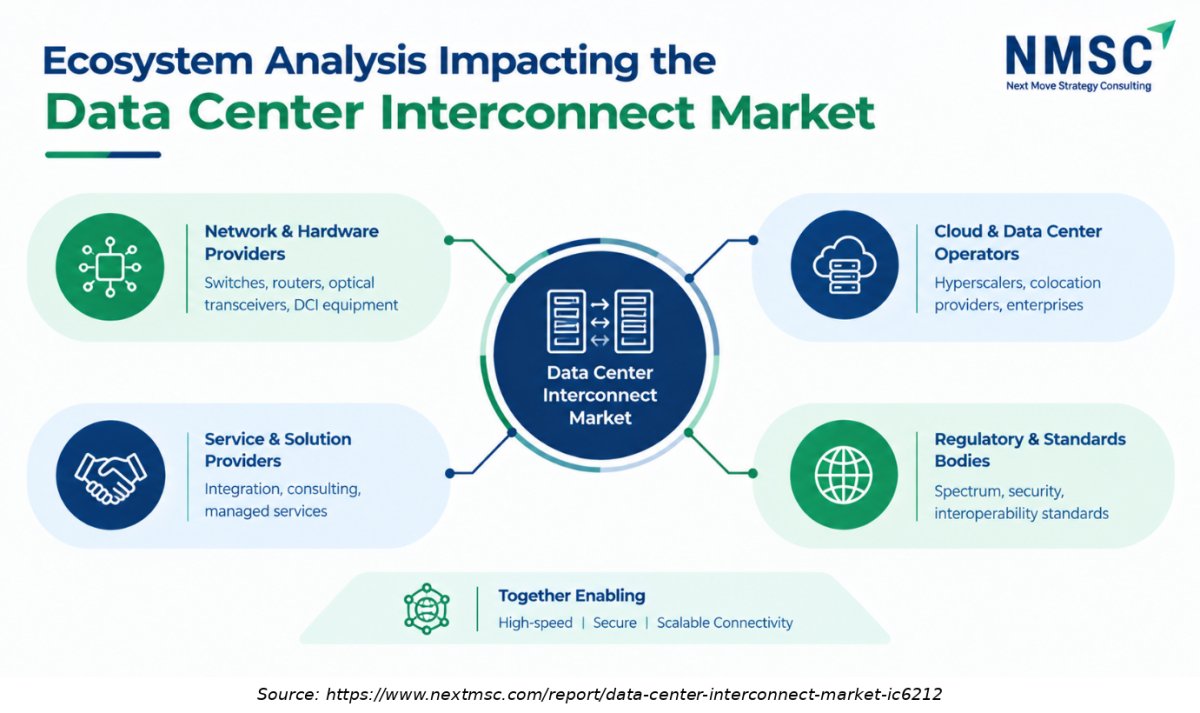
Ecosystem Analysis Impacting the Data Center Interconnect Market
The Data Center Interconnect ecosystem brings together component suppliers, network equipment providers, telecom operators, cloud providers, and data center operators. Their collaboration enables high-speed, secure, and reliable connectivity, while advancements in optical networking, AI infrastructure, and cloud computing drive market growth.

Competitive Landscape

How Do Companies Compete in the Data Center Interconnect Industry?

Vendors compete on capacity per fiber, power per bit, time to deliver and the ability to integrate with hyperscale operations. Cisco booked USD 9.30 Billion of hyperscale AI infrastructure orders in fiscal 2026, while Ciena reported USD 1.67 Billion of revenue in its fiscal third quarter. Pricing pressure is rising as pluggable modules commoditise, so suppliers expand geographically through partners and bundle software and services to protect margins in the data center interconnect market.

Which Vendor Archetypes Dominate the Market?

Three archetypes compete. Optical systems specialists such as Ciena, Nokia, ZTE and Adtran differentiate through line systems, reach and automation. Platform vendors such as Cisco and Arista differentiate through routing silicon and operating software. Component and silicon suppliers such as Marvell and Coherent differentiate through coherent DSPs, lasers and modules sold to every other group.

What Innovation and Differentiation Strategies Are Companies Using?

Suppliers race to introduce faster modules and tighter integration Marvell announced 2nm coherent DSPs with integrated MACsec in March 2026, and Coherent developed a 140 GBaud optical subassembly for 800G pluggables. ZTE promotes C+L full band integrated optics to raise fiber capacity. Adtran positions open line systems for short links between data centers. These moves target lower power and simpler operations.

How Active Is M&A in the Data Center Interconnect Industry?

Consolidation has reshaped the supplier base. Nokia's optical net sales reached EUR 3.02 Billion in 2025, with the Infinera acquisition adding to growth, and HPE closed its Juniper Networks acquisition on 2 July 2025 for routing and data center scale. We expect further deals in coherent silicon, photonic integration and automation software as vendors seek control of scarce capabilities.

Key Market Players

Based on research conducted by NMSC, we found that eight companies qualify as verified key players, listed here in ranked order.

Ciena Corporation Cisco Systems, Inc. Nokia Corporation Marvell Technology, Inc. ZTE Corporation Coherent Corp. Arista Networks, Inc. (DCI routing platforms) Adtran Holdings, Inc.

Latest Developments

We observed that 2025 and 2026 announcements cluster around 800G and 1.6T coherent optics, hyperscale orders and consolidation.

Date Event
October 2026 Cisco announced an open packet-to-optical “scale-across” architecture combining Silicon One P200 routing, deep-buffered systems, and coherent optics to connect AI fabrics across sites. It said 51.2T P200 systems were in production at “hyperscalers”, while Cisco and NVIDIA plan an open 400G-per-lane pluggable-optics specification
September 2026 Marvell said it would demonstrate 2nm optical technologies, including 400G-per-lane PAM4, an 800G ZR/ZR+ pluggable with MACsec, and 1.6T ZR and O-band coherent-lite links
March 2026 Nokia introduced application-optimized coherent transport solutions and a compact multi-fiber inline amplifier for AI-driven networks
March 2026 ZTE and China Mobile launched the Scale-Across (GSE-DCI) solution for long-haul interconnection between computing centers
October 2025 Arista unveiled its R4 router family for AI, data-center, and routed-backbone deployments, including dense 800 Gbps systems and 3.2 Tbps HyperPorts

Expert Insights

Gary Smith

President and CEO | Ciena

"Whether for training or inferring, these data center investments need to be interconnected by cutting-edge, low latency, high-speed connectivity solutions."

Analyst Interpretation

The statement highlights the growing importance of high-speed, low-latency interconnection as AI workloads increase data traffic between distributed data centers. “hyperscalers” and cloud providers are investing in advanced optical networking, high-capacity fiber infrastructure, and scalable connectivity solutions to support AI computing and data transfer. These developments are strengthening demand for data center interconnect technologies that enable reliable, efficient, and high-bandwidth communication between facilities

Investment Opportunities

Where Is Capital Flowing in Data Center Interconnect?

Capital is flowing into coherent optics, optical line systems and the silicon behind them. Lumentum reported fiscal 2026 net revenue of USD 3.01 Billion, an 83.2% increase, and Marvell expects its interconnect revenue to grow more than 50% in fiscal 2027. Our assessment indicates that investors will favour suppliers with secured hyperscale agreements and in house photonics, because those assets protect volume in the data center interconnect market through the 2026–2028 supply squeeze.

How Much Infrastructure Investment Does the Market Require?

Interconnect spending follows data center construction, since every new campus needs routes, line systems and modules back to existing regions. Alphabet guided to between USD 180 Billion and USD 190 Billion of 2026 capital expenditure, and Nokia guided to higher capital expenditure tied to added optical manufacturing capacity. We found that vendors expanding factory output and test capacity gain the earliest access to hyperscale orders.

What ESG Considerations Shape Investment in Data Center Interconnect?

Energy intensity is the central ESG issue, with the IEA expecting data centre electricity use to reach around 945 TWh by 2030. Pluggable coherent optics reduce space and power, and ZTE states that its C+L integrated modules cut power per Gbit by 68%. EU reporting rules for facilities of at least 500 kW increase transparency, so investors increasingly screen suppliers on power per bit and product lifecycle disclosure.

Key Benefits for Stakeholders

How Do Enterprise and Industry Leaders Benefit from This Analysis?

Cloud, colocation and enterprise network leaders gain a clear view of where capacity, pricing and technology are heading. The segment tables show coherent pluggable optics growing at 18.5% CAGR and AI cluster scale across at 23.0%, which guides architecture and sourcing decisions. Our findings suggest that buyers who adopt open line systems early can negotiate better terms and avoid single supplier dependence in the data center interconnect market.

How Do Investors and Financial Analysts Benefit from This Analysis?

Investors receive a reconciled forecast of USD 7.80 Billion in 2025, USD 10.80 Billion in 2026 and USD 41.00 Billion in 2035, with segment and country detail that ties to company disclosures. The restraint assessment, including supply constraints and pricing pressure, helps analysts stress test earnings and capital plans. Regional data highlights where growth outpaces the global rate, notably Asia-Pacific and the Gulf.

How Do Technology Vendors and Product Teams Benefit from This Analysis?

Vendors can use the segmentation to prioritise product roadmaps, from 1.6T modules and encryption to automation software and services. The competitive section maps three vendor archetypes and shows where consolidation is changing bargaining power. Country level estimates identify where local partners matter most, helping product teams plan channels, support coverage and certification work ahead of demand.

Key Market Segments Evaluated

By Component

  • DCI platforms and line systems
  • Coherent pluggable optics
  • Software
  • Services

By Application

  • AI cluster scale across
  • Disaster recovery and business continuity
  • Workload and storage migration
  • Content delivery and cloud connectivity

By End User

  • Cloud service providers and “hyperscalers”
  • Colocation and data center operators
  • Telecom service providers
  • Enterprises

By Region

  • North America 
    • U.S.
    • Canada
    • Mexico
  • Europe 
    • UK
    • Germany
    • France
    • Italy
    • Spain
    • Sweden
    • Denmark
    • Finland
    • Netherlands
    • Rest of Europe
  • Asia-Pacific 
    • China
    • India
    • Japan
    • South Korea
    • Taiwan
    • Indonesia
    • Vietnam
    • Australia
    • Philippines
    • Malaysia
    • Rest of APAC
  • Middle East & Africa 
    • Saudi Arabia
    • UAE
    • Egypt
    • Israel
    • Turkey
    • Nigeria
    • South Africa
    • Rest of MEA
  • Latin America 
    • Brazil
    • Argentina
    • Chile
    • Colombia
    • Rest of LATAM

Conclusion & Recommendations

We expect the market to grow from USD 10.80 Billion in 2026 to USD 41.00 Billion by 2035, a steady expansion led by AI workloads that span multiple sites. Growth will fade from the current surge as the installed base matures and prices fall. Even so, the cumulative opportunity of USD 30.20 Billion makes interconnect one of the most dynamic parts of data center infrastructure.

What Strategic Positioning Recommendations Does NMSC Offer?

Vendors should secure supply of lasers and DSPs, invest in 1.6T modules and integrated encryption, and pair hardware with automation software. Operators should adopt open line systems and qualify at least two module suppliers. We recommend that new entrants target colocation and AI hosting buyers, where the fastest growing segment is forecast to expand at 18.5% CAGR.

What Is the Investment Attractiveness of the Data Center Interconnect Market?

Attractiveness is high but uneven. Coherent pluggable optics and services combine strong growth with recurring volume, while mature line systems offer steadier returns at 12.5% CAGR. Asia-Pacific offers the fastest regional growth at 17.7%, and India leads countries at 20.3%. Investors should favour suppliers with hyperscale agreements and diversified component sourcing.

What Are the Market Shifts and Key Risks in the Data Center Interconnect Market?

Key shifts include the move to pluggables, the rise of encryption and multivendor designs, and consolidation among suppliers. Main risks are component shortages, pricing erosion, export controls and a slowdown in hyperscale spending. We found that a pause in capital expenditure would hit the AI and HPC scale across application first, so scenario planning matters for every participant in the data center interconnect market.

What Are the Primary Growth Pathways Through 2035?

Three pathways stand out. First, scale across links between AI campuses lift that application to USD 17.40 Billion by 2035. Second, colocation and data center operators extend demand into more metros. Third, emerging regions such as India and Saudi Arabia add new routes and services at rates above 18%. Combined, these pathways support the 16.0% CAGR forecast.

FAQs

Sources & References

1.

Ciena Corporation, Form 10-Q for the quarter ended 2 May 2026 (SEC)

sec.gov
2.

Ciena Corporation, Fiscal Third Quarter 2026 Financial Results

s25.q4cdn.com
3.

Cisco Systems, Inc., Fourth Quarter and Fiscal Year 2026 Earnings (SEC 8-K)

sec.gov
4.

Cisco Systems, Inc., Form 10-K for fiscal 2026 (SEC)

sec.gov
5.

Cisco Systems, Inc., Q1 FY2026 earnings slides

s2.q4cdn.com
6.

Nokia Corporation, Form 6-K fourth quarter 2025 report (SEC)

sec.gov
7.

Nokia Corporation, 2025 results exhibit with Optical Networks net sales (SEC)

sec.gov
8.

Marvell Technology, Inc., COLORZ 1600 and 2nm coherent DSP announcement

businesswire.com
9.

Marvell Technology, Inc., FY2026 financial and business results presentation

investor.marvell.com
10.

Marvell, Lumentum and Coherent, 800G ZR/ZR+ 500 km interoperability demonstration

investor.marvell.com
11.

Coherent Corp., 140 GBaud IC-TROSA press release

coherent.com
12.

ZTE Corporation, 2025 Annual Results Announcement (HKEXnews)

www1.hkexnews.hk
13.

ZTE Corporation, C+L full band integrated OTN press release

zte.com.cn
14.

ZTE Corporation, Futurecom 2025 portfolio press release

zte.com.cn
15.

Arista Networks, Inc., 400G ZR interoperability testing press release

businesswire.com
16.

Arista Networks, Inc., Form 10-K for 2024 (SEC)

sec.gov
17.

ADTRAN Holdings, Inc., Second Quarter 2026 Financial Results

businesswire.com
18.

Lumentum Holdings Inc., Fiscal 2026 results (SEC 8-K)

sec.gov
19.

Lumentum Holdings Inc., Form 10-K for fiscal 2026 (SEC)

sec.gov
20.

Hewlett Packard Enterprise, closing of the Juniper Networks acquisition

hpe.com
21.

Alphabet Inc., investor relations (Q1 2026 earnings and capital expenditure guidance)

abc.xyz/investor
22.

International Energy Agency, Energy and AI (2025)

iea.org
23.

European Commission, Minimum performance standards for EU data centres

energy.ec.europa.eu
24.

Swedish Energy Agency, Data centres energy performance reporting

energimyndigheten.se

About the Author

Mayurima Roy

Mayurima Roy

Mayurima Roy is Research Analyst at Next Move Strategy Consulting, where she has spent 4 years working across the firm's full industry coverage rather than a single fixed vertical. Her work centers on structured research, ongoing trend tracking, competitive assessment, and insight-led content development, translating complex market data into clear, decision-ready narratives that support informed client decision-making across diverse global industries, market sectors, and world regions every day.

About the Reviewer

Supradip Baul

Supradip Baul

Supradip Baul is an accomplished business consultant and strategist with over a decade of rich experience in market intelligence, strategy, technology, and business transformation. His work has included rigorous qualitative and quantitative analysis across multiple industries, helping clients shape investment decisions and long-term roadmaps. Earlier in his career, he was associated with Gartner, where he contributed to industry-leading reports and market share analyses. He has worked with leading global companies and holds an MBA with a dual specialization in Marketing and Finance.

Download Free Sample

Nishant Awate

NISHANT AWATE

Business Development Global Sales

Zehnder Group Deutschland GmbH

Our experience working with Next Move Strategy Consulting was positive. The team was responsive, professional, and open to incorporating our specific requirements throughout the project. The India AHU market study was comprehensive and well structured, covering market value and volume forecasts, product and application segments, and key industry trends. The inclusion of both AHU and residential MVHR market insights made the study particularly relevant for our strategic market assessment. Overall, the report provides a solid foundation for evaluating market potential, identifying priority segments, and supporting business-development decisions in India.

Pratyush Kumar Das

PRATYUSH KUMAR DAS

Assistant Manager

Polycab India Limited

We would like to express our appreciation for the data and insights provided by nextmsc. We are very pleased with the quality and depth of the information, which has proven to be highly valuable and beneficial for our business decision-making.

Mohit Agarwal

MOHIT AGARWAL

Chief Manager

DryChem India Pvt. Ltd.

Next Move Strategy Consulting is an amazing team of consultants. We required a market study report for our investors on top priority and the team went above and beyond our expectations to deliver the same with ample supporting data within a short time span enabling us to secure the investments and keep our project timeline maintained. Their professionalism, attention to detail, and timely delivery of actionable recommendations have left a lasting impression on our organization.

Kevin Coker

KEVIN COKER

Founder, CEO and Board Diector

Proxima Clinical Research

I have been using Next MSC reports for product positioning in a new geography for a long time. They have by far the best reports I have found and the price is reasonable too!

Henri Knyphausen

HENRI KNYPHAUSEN

Partner at Singulier [Ex-BCG]

Singulier

I recently engaged NEXTMSC.com for a commercial due diligence project within the intralogistics sector, and I am pleased to provide a reference based on my experience. In utilizing NEXTMSC.com's services, I found their report to offer valuable insights into market dynamics and key industry players. The initial report provided a solid foundation for our analysis. However, as we were investigating a smaller target in the market, and I had specific customization requests requiring additional research. These requests included detailed information on product portfolios of various players and sub-market sizes, both inclusive and exclusive of certain product categories. NEXTMSC.com demonstrated commendable responsiveness and agility in accommodating these customization requests. Within a timeframe of 1-2 weeks, they delivered a revised report that met our specific needs. Furthermore, they were receptive to my follow-up inquiries, ensuring clarity and understanding of the data provided. The final deliverable significantly contributed to our due diligence efforts. One of NEXTMSC.com's notable strengths lies in their qualitative research capabilities. However, for future engagements, I would recommend the inclusion of a quantified market model in Excel format. Such a model would offer the ability to conduct in-depth analyses and explore various market segments, including country-specific data and subcomponent breakdowns. Based on my positive experience, I would not hesitate to work with NEXTMSC.com again. Their responsiveness, willingness to accommodate customization requests, and commitment to delivering actionable insights make them a reliable partner for commercial research projects.

Custom Market Research Services

We will customize the research for you if the listed report does not fully match your requirements.

Get 30% Free Customization

Select License

This website uses cookies to ensure you get the best experience on our website. Learn more

✖