Data Center Integration Services Market Global Industry Analysis and Forecast (2026–2035)

Rising AI capital spending, higher rack power density and hybrid cloud migration are lifting Data Center Integration Services Market revenue from USD 18.20 Billion in 2025 to USD 62.80 Billion by 2035, a CAGR of 12.9% over 2026–2035, with North America as the leading region.

Download Free Sample PDF
Base Year (2025)
$18.20 Billion
Forecast (2035)
$62.80 Billion
CAGR (2026-2035)
12.9%
Top Region
North America

What Is the Data Center Integration Services Market Size?

The global Market reached USD 18.20 Billion in 2025 and is estimated at USD 21.00 Billion in 2026, forecast to reach USD 62.80 Billion by 2035 at a CAGR of 12.9% between 2026 and 2035. North America leads with approximately 40% revenue share, while Migration and consolidation is the dominant service type at approximately 33%.

We observed that integration spending follows equipment and facility commitments by a few quarters, so the segment readings below describe a lagging view of the data center build cycle. Providers book revenue as racks are installed, powered and accepted, while orders for the underlying hardware and facility works are placed earlier, which explains why services growth tends to trail capital spending announcements.

Data Center Integration Services Market Global Industry Analysis and Forecast (2026–2035) Revenue Forecast

Values in USD Billion

2025 $18.20 Billion
2025
2026 $21.00 Billion
2026
2027 $23.71 Billion
2027
2028 $26.77 Billion
2028
2029 $30.22 Billion
2029
2030 $34.12 Billion
2030
2031 $38.52 Billion
2031
2032 $43.49 Billion
2032
2033 $49.10 Billion
2033
2034 $55.43 Billion
2034
2035 $62.80 Billion
2035

Key Takeaways

By Service Type: Migration and consolidation held the largest share, expanding from USD 6.00 Billion in 2025 to USD 18.00 Billion by 2035; Installation and commissioning is the fastest growing at 14.4% CAGR from 2026–2035.

By Infrastructure Layer: Compute and storage held the largest share, expanding from USD 6.55 Billion in 2025 to USD 19.40 Billion by 2035; Power and cooling systems is the fastest growing at 15.4% CAGR from 2026–2035.

By Data Center Type: Hyperscale and AI held the largest share, expanding from USD 6.10 Billion in 2025 to USD 30.80 Billion by 2035, and is also the fastest growing at 16.4% CAGR from 2026–2035.

Dominant Region: North America dominated with approximately 40% revenue share in 2025, or USD 7.35 Billion, anchored by hyperscale campus construction.

Fastest-Growing Region: Asia-Pacific is expected to register the highest CAGR of 16.8% during 2026–2035, driven by AI capacity programs.

Dominant Country: The U.S. led the market with an estimated USD 6.30 Billion in 2025, supported by the largest hyperscale pipeline.

Fastest-Growing Country: India is projected to expand from USD 0.45 Billion in 2025 at a CAGR of 20.9% during 2026–2035, driven by new cloud and AI facilities.

The Data Center Integration Services Market presents an absolute investment opportunity of approximately USD 41.80 Billion between 2026 and 2035, calculated as the 2035 forecast of USD 62.80 Billion less the 2026 base of USD 21.00 Billion, which makes installation and commissioning capacity and power and cooling integration the most capital efficient areas for service investors.

According to NMSC analysis, the movement of integration work from enterprise server rooms toward hyperscale and AI campuses is the most structurally important change in the industry, because project size, power density and commissioning complexity per site now exceed what generalist IT teams can deliver without specialist partners. This change also raises average contract value, lengthens project timelines and favors providers with proven delivery records.

Ecosystem Analysis Impacting the Data Center Integration Services Market

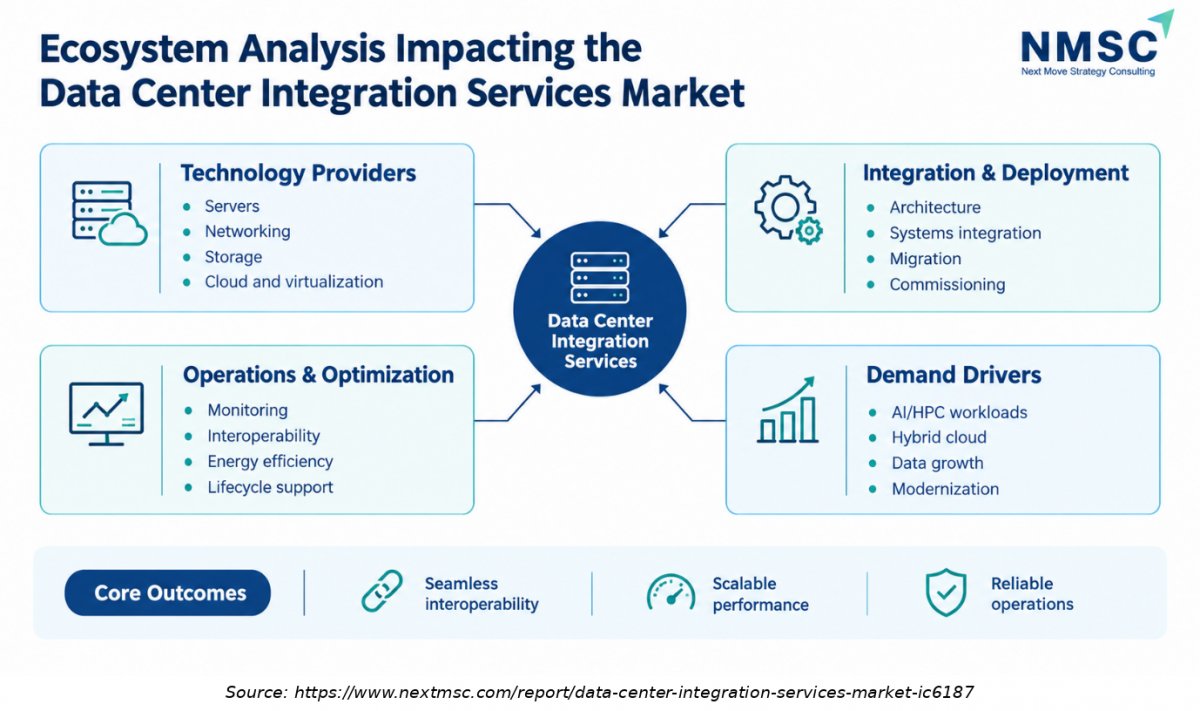
The infographic highlights the key ecosystem factors influencing the Data Center Integration Services Market, including technology providers, cloud service vendors, infrastructure suppliers, system integrators, and end users. It illustrates how growing cloud adoption, AI-driven workloads, digital transformation, and demand for scalable infrastructure are driving collaboration among stakeholders, creating new opportunities for innovation and market growth.

What Does the Data Center Integration Services Market Encompass?

Data center integration services cover the design, installation, commissioning, migration and optimization work that joins datacenterinfrastructure layers into one working facility. Compute, storage, network, power, cooling and orchestration software all fall inside the scope. Providers sell these services to enterprises, colocation operators, hyperscalers and edge operators as fixed scope projects or multiyear programs. This market report excludes hardware sales, land, building shell construction and pure hosting, so figures count only services revenue that connects infrastructure layers.
The scope has widened since 2023 as AI clusters raised rack densities and turned liquid cooling, high voltage distribution and low latency fabrics into integration problems rather than product choices. Regulation also shapes demand, because Delegated Regulation (EU) 2024/1364 requires operators of data centres with at least 500 kW of IT power to report energy and sustainability indicators, which pulls monitoring and metering work into project scope. Technology adoption now centers on digital twins, AIOps and automated commissioning.

Market Drivers & Dynamics

Interactive Dataset
AI and hyperscale capacity build out driver +2.6% Global, led by North America and Asia-Pacific 2026–2035
Hybrid and multicloud migration programs driver +1.8% North America, Europe 2026–2032
Power and liquid cooling retrofits for dense racks driver +1.9% Global 2026–2033
Sovereign cloud and data residency mandates driver +1.2% Europe, Middle East & Africa, Asia-Pacific 2026–2035
Energy and sustainability reporting rules driver +0.7% Europe 2026–2029
Grid connection delays and equipment shortages restraint −1.7% U.S., Europe 2026–2030
Skilled technician and engineer shortage restraint −1.1% Global 2026–2031
Hardware and component cost volatility restraint −0.6% Global 2026–2028
Source: Next Move Strategy Consulting

Growth Drivers

What Is the Primary Growth Driver of the Data Center Integration Services Market?

The primary driver is the scale of capital flowing into AI capacity. The International Energy Agency states that data centre investment reached about USD 500 Billion in 2024, nearly double the 2022 level, and that capital expenditure of the five largest technology companies exceeded USD 400 Billion in 2025, with a further 75% rise expected in 2026. Each dollar of equipment spending creates integration work, so service demand follows this capital cycle with a short lag.

How Is Rising Power Density Driving the Data Center Integration Services Market Growth?

Power draw per site is rising faster than facility designs can adapt. The US Department of Energy reported, through Lawrence Berkeley National Laboratory, that data centers used about 176 TWh, or 4.4% of US electricity, in 2023 and could use 325 to 580 TWh by 2028. Integrators capture this shift through electrical, cooling and monitoring work, and we found that retrofit programs in existing hyperscale datacenter and enterprise halls add demand beyond new construction.

Growth Inhibitors

What Is Restraining the Data Center Integration Services Market?

Physical bottlenecks cap how quickly projects convert from plan to revenue. The International Energy Agency notes that shortages of transformers and gas turbines, long grid connection queues and complex permitting are slowing data centre development. Our assessment indicates that delayed energization postpones commissioning revenue by several quarters, while limited technician availability adds a second constraint on installation capacity. Providers that secure labor and equipment slots early gain a clear share advantage.

What Are the Growth Opportunities?

Where Does AI Factory Deployment Create the Largest Revenue Pool?

Hyperscale and AI facilities form the largest revenue pool, rising from USD 7.85 Billion in 2026 to USD 30.80 Billion in 2035. Providers that package rack integration, fabric validation and acceptance testing into repeatable build blocks can deliver more halls per year with fewer site visits. The main beneficiary is the Hyperscale and AI data center type, followed by compute and storage integration.

How Can Providers Monetize Power and Cooling Retrofits?

Existing halls designed for lower rack densities need electrical and thermal upgrades before they can host accelerators. Integrators that offer assessment, phased cutover and commissioning for these retrofits serve enterprise and colocation clients at once. Power and cooling systems is the beneficiary layer, growing from USD 5.20 Billion in 2026 to USD 18.90 Billion in 2035 as retrofit programs scale across mature regions.

Why Do Sovereign and Edge Deployments Open New Contracts?

National cloud and data residency programs create smaller regional builds that global providers rarely serve efficiently. Local delivery teams, standard designs and remote commissioning tools let integrators win each edge datacenter contract at acceptable margins. Edge is the beneficiary type, expanding from USD 2.20 Billion in 2026 to USD 6.60 Billion in 2035, while Asia-Pacific and Middle East & Africa gain most from regional programs.

Segmentation Analysis

2025 (USD Billion)
2035 (USD Billion)
Consulting and design 2025: $2.55 Billion | 2035: $8.20 Billion
Consulting a
Installation and commissioning 2025: $5.65 Billion | 2035: $22.40 Billion
Installation
Migration and consolidation 2025: $6.00 Billion | 2035: $18.00 Billion
Migration an
Optimization and support 2025: $4.00 Billion | 2035: $14.20 Billion
Optimization
Consulting and design $2.55 Billion $8.20 Billion 11.8%
Installation and commissioning $5.65 Billion $22.40 Billion 14.4%
Migration and consolidation $6.00 Billion $18.00 Billion 11.2%
Optimization and support $4.00 Billion $14.20 Billion 13.9%

Which Service Type Leads the Data Center Integration Services Market?

Migration and consolidation led with USD 6.00 Billion in 2025, about 33% of revenue, because enterprises are still retiring legacy rooms and moving workloads into colocation and cloud facilities. Installation and commissioning are the fastest growing service type at 14.4% CAGR from 2026 to 2035, as AI campuses require large deployment crews and formal acceptance testing. Consulting and design grow more slowly at 11.8%, since clients increasingly buy design inside delivery contracts.

2025 (USD Billion)
2035 (USD Billion)
Compute and
Network and
Power and co
Management a
Segment Item 2025 (USD Billion) 2035 (USD Billion) CAGR
Compute and storage $10.0 USD Billion $40.0 USD Billion 21.0%
Network and interconnect $17.1 USD Billion $51.1 USD Billion 19.0%
Power and cooling systems $24.2 USD Billion $62.2 USD Billion 21.0%
Management and orchestration software $31.3 USD Billion $73.3 USD Billion 19.0%

Segment-wise data is locked

Unlock complete segment-wise numbers for By Infrastructure Layer.

Unlock Full Data
2025 (USD Billion)
2035 (USD Billion)
Enterprise
Colocation
Hyperscale a
Edge
Segment Item 2025 (USD Billion) 2035 (USD Billion) CAGR
Enterprise $10.0 USD Billion $40.0 USD Billion 24.0%
Colocation $17.1 USD Billion $51.1 USD Billion 18.0%
Hyperscale and AI $24.2 USD Billion $62.2 USD Billion 8.0%
Edge $31.3 USD Billion $73.3 USD Billion 10.0%

Segment-wise data is locked

Unlock complete segment-wise numbers for By Data Center Type.

Unlock Full Data
2025 (USD Billion)
2035 (USD Billion)
North Americ
Canada
Mexico
Europe: UK
Germany
Segment Item 2025 (USD Billion) 2035 (USD Billion) CAGR
North America: U.S. $10.0 USD Billion $40.0 USD Billion 10.0%
Canada $17.1 USD Billion $51.1 USD Billion 8.0%
Mexico $24.2 USD Billion $62.2 USD Billion 18.0%
Europe: UK $31.3 USD Billion $73.3 USD Billion 8.0%
Germany $38.4 USD Billion $84.4 USD Billion 15.0%

Segment-wise data is locked

Unlock complete segment-wise numbers for By Region.

Unlock Full Data

Growth Opportunities

Our assessment indicates that three opportunities offer the clearest path to above market growth in the Data Center Integration Services Market through 2035.

Where Does AI Factory Deployment Create the Largest Revenue Pool?

Hyperscale and AI facilities form the largest revenue pool, rising from USD 7.85 Billion in 2026 to USD 30.80 Billion in 2035. Providers that package rack integration, fabric validation and acceptance testing into repeatable build blocks can deliver more halls per year with fewer site visits. The main beneficiary is the Hyperscale and AI data center type, followed by compute and storage integration.

How Can Providers Monetize Power and Cooling Retrofits?

Existing halls designed for lower rack densities need electrical and thermal upgrades before they can host accelerators. Integrators that offer assessment, phased cutover and commissioning for these retrofits serve enterprise and colocation clients at once. Power and cooling systems is the beneficiary layer, growing from USD 5.20 Billion in 2026 to USD 18.90 Billion in 2035 as retrofit programs scale across mature regions.

Why Do Sovereign and Edge Deployments Open New Contracts?

National cloud and data residency programs create smaller regional builds that global providers rarely serve efficiently. Local delivery teams, standard designs and remote commissioning tools let integrators win each edge datacenter contract at acceptable margins. Edge is the beneficiary type, expanding from USD 2.20 Billion in 2026 to USD 6.60 Billion in 2035, while Asia-Pacific and Middle East & Africa gain most from regional programs.

Regional Outlook

2025 (USD Billion)
2035 (USD Billion)
North Americ
Europe
Asia-Pacific
Middle East
Latin Americ
Region 2025 (USD Billion) 2035 (USD Billion) CAGR (%)
North America $10.0 USD Billion $40.0 USD Billion 9.0%
Europe $17.1 USD Billion $51.1 USD Billion 27.0%
Asia-Pacific $24.2 USD Billion $62.2 USD Billion 25.0%
Middle East & Africa $31.3 USD Billion $73.3 USD Billion 23.0%
Latin America $38.4 USD Billion $84.4 USD Billion 12.0%

Regional data is locked

Unlock complete regional numbers for this market.

Unlock Full Data

Competitive Landscape

Our assessment indicates that the Data Center Integration Services Market is fragmented below a group of global integrators that bundle consulting, build and operate services. Scale, partner ecosystems and delivery records separate leaders from regional specialists, and most large programs are awarded to providers that can show completed builds at comparable power density.

How Do Companies Compete in the Data Center Integration Services Market?

Competition rests on delivery scale, partner ecosystems and the ability to carry outcome risk. Kyndryl describes itself as the world's largest IT infrastructure services provider and reported USD 15.10 Billion of fiscal 2026 revenue, while Accenture generated USD 74.20 Billion across consulting and managed services. Fixed price projects dominate builds and subscription style contracts dominate operations. Geographic expansion follows hyperscale site selection.

Which Provider Archetypes Dominate Integration Programs?

Three archetypes dominate. Global integrators such as Accenture and Capgemini lead consulting and design. Infrastructure specialists such as Kyndryl, DXC Technology and NTT DATA lead migration and operations. Indian IT majors, including TCS, Infosys, Wipro and HCLTech, compete on delivery scale, while IBM and Fujitsu pair integration with proprietary platforms and Cognizant builds hyperscale operations depth. Differentiation themes are outcome accountability, deployment speed and AI infrastructure skills.

How Do Leading Companies Differentiate Through Innovation?

Providers differentiate through tooling rather than labor alone. Kyndryl launched Agentic Service Management for autonomous IT operations, and Cognizant's Astreya acquisition adds an AI operations platform used in hyperscale environments. HCLTech combines AI data center design, DevOps and AI cloud operations, while Infosys embeds AIOps and agentic AI in client estates. Our analysis shows that tooling depth shortens commissioning cycles and lets providers price on outcomes.

What Does M&A Activity Reveal About Provider Strategy?

Acquisitions concentrate on hyperscale facing capability. Cognizant completed its USD 0.63 Billion Astreya acquisition in the second quarter of 2026, and HCLTech chose a build path with board approval for up to INR 3,500 crore of AI data center investment. We found that buyers Favor targets with recurring managed infrastructure revenue and existing hyperscale relationships, because these assets add margin visibility and shorten qualification for large AI infrastructure contracts.

Key Market Players

NMSC's analysis indicates that the following twelve companies form the core competitive set. They are ranked on infrastructure services scale and were verified through official company filings, annual reports and press releases, with group level figures used where market specific revenue is not disclosed by the company in its public reports.

Kyndryl Holdings, Inc. International Business Machines Corporation NTT DATA Group Corporation Accenture plc Fujitsu Limited DXC Technology Company HCL Technologies Limited Tata Consultancy Services Limited Capgemini SE Infosys Limited Wipro Limited Cognizant Technology Solutions Corporation

Latest Developments

We found that recent announcements in the Market point to AI data center capacity, hyperscale partnerships and AI led operations.

Date Event
September 2026 Accenture launched Accenture Construct, combining advisory, engineering, project delivery and technology services into one global business for capital projects
July 2026 HCLTech announced entry into full-stack AI solutions, backed by a proposed investment of up to ₹3,500 crore in AI data centers potentially scaling to 50 MW
April 2026 NTT DATA introduced the SDI Services Agent, a multi-agent conversational layer for infrastructure services
April 2026 DXC launched OASIS, a governed orchestration layer integrating systems, workflows and operational data across existing IT estates
March 2026 Wipro launched an AI-Data Center solution integrating NVIDIA AI Enterprise within Wipro Intelligence
March 2025 Infosys expanded its strategic collaboration with Citizens to support AI-led transformation using cloud, automation and domain platforms

Expert Insights

Giordano (Gio) Albertazzi

CEO | Vertiv

"Our experts correctly identified the proliferation of AI and the need to transition to more complex liquid- and air-cooling strategies as a trend for 2024."

Analyst Interpretation

Increasing AI server density is placing greater demands on thermal management, making conventional cooling configurations insufficient for some deployments. This supports demand for integration services that coordinate servers with liquid-cooling equipment, cooling distribution units, rack infrastructure, power systems and monitoring technologies. Providers capable of implementing and validating these interconnected systems can help customers deploy high-performance computing infrastructure more efficiently

Investment Opportunities

Where Are Capital Inflows Concentrating?

Capital is flowing toward AI capable capacity and the services that deliver it. The International Energy Agency counts about USD 500 Billion of data centre investment in 2024, and hyperscale capital spending exceeded USD 400 Billion in 2025. For service investors, the most attractive targets are firms with hyperscale relationships and repeatable build methods, since these combine recurring revenue with exposure to the fastest growing hyperscale and AI segment.

How Is Infrastructure Investment Reshaping Service Demand?

Utility interconnection, substations, liquid cooling plants and fiber routes now precede server installation, so infrastructure spending creates integration work earlier in the project cycle. We found that providers able to coordinate trades across power, cooling and network layers capture larger scopes and higher margins. Regional programs add further demand, with Asia-Pacific forecast to grow at 16.8% CAGR from 2026 to 2035.

What ESG Considerations Affect Integration Investment?

ESG factors now shape scope and project eligibility, especially for the green datacenter segment. Delegated Regulation (EU) 2024/1364 requires reporting from facilities of at least 500 kW, so integrators must connect metering, water and energy data to reporting systems. Our assessment indicates that clients reward partners that can evidence energy efficiency and renewable sourcing, and that sustainability instrumentation is becoming a standard line item in installation contracts.

Key Benefits for Stakeholders

How Does This Report Help Enterprise and Industry Leaders?

Enterprise leaders gain a benchmark for planning migration, consolidation and modernization budgets. The forecast shows enterprise facilities growing at only 6.2% CAGR, which signals that shared colocation and cloud capacity will absorb more workloads. The segment data helps buyers compare service types, negotiate fixed outcome contracts and sequence projects around power and equipment lead times.

What Value Does This Analysis Offer Investors and Financial Analysts?

Investors receive a reconciled view of revenue by service type, infrastructure layer, data center type and region, with a 2026 base and a 2035 forecast. The analysis separates fast growing pools such as power and cooling from steadier migration work, and it flags execution risks tied to grid delays and labor supply. This supports target screening, valuation cross checks and scenario testing for service portfolios.

How Can Technology Vendors and Service Providers Use These Findings?

Vendors and providers can use the segment and country data to prioritize investment in AI rack integration, liquid cooling engineering and regional delivery teams. The competitive analysis shows where partnerships with hyperscalers, utilities and equipment makers reduce schedule risk. Product teams can also align tooling roadmaps with the fastest growing layers and with compliance duties that are spreading across regions.

Supply Chain Structure Impacting the Data Center Integration Services Market

Supply Chain Structure Impacting the Data Center Integration Services Market
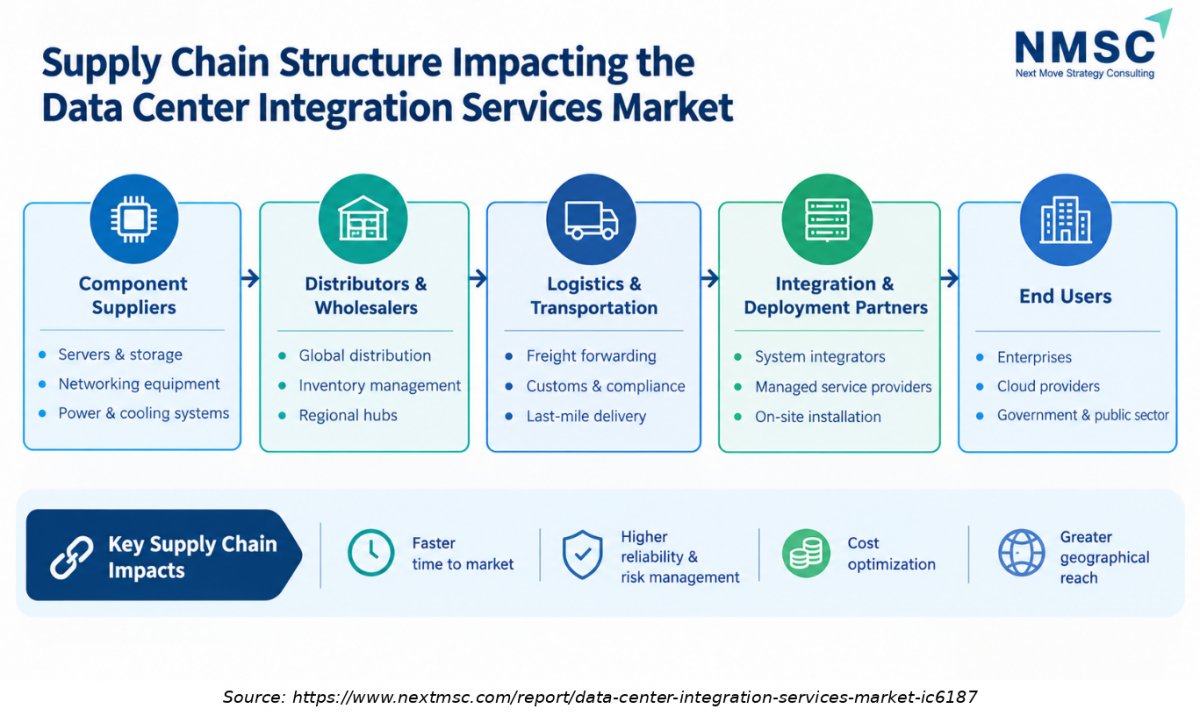
The infographic illustrates the supply chain structure impacting the Data Center Integration Services Market, highlighting the interconnected roles of component suppliers, technology vendors, system integrators, service providers, and end users. It showcases how efficient procurement, infrastructure deployment, technology integration, and service delivery contribute to operational efficiency, scalability, and overall market growth.

Key Market Segments Evaluated

By Service Type

  • Consulting and design
  • Installation and commissioning
  • Migration and consolidation
  • Optimization and support

By Infrastructure Layer

  • Compute and storage
  • Network and interconnect
  • Power and cooling systems
  • Management and orchestration software

By Data Center Type

  • Enterprise
  • Colocation
  • Hyperscale and AI
  • Edge

By Region

  • North America 
    • U.S.
    • Canada
    • Mexico
  • Europe 
    • UK
    • Germany
    • France
    • Italy
    • Spain
    • Sweden
    • Denmark
    • Finland
    • Netherlands
    • Rest of Europe
  • Asia-Pacific 
    • China
    • India
    • Japan
    • South Korea
    • Taiwan
    • Indonesia
    • Vietnam
    • Australia
    • Philippines
    • Malaysia
    • Rest of APAC
  • Middle East & Africa 
    • Saudi Arabia
    • UAE
    • Egypt
    • Israel
    • Turkey
    • Nigeria
    • South Africa
    • Rest of MEA
  • Latin America 
    • Brazil
    • Argentina
    • Chile
    • Colombia
    • Rest of LATAM

Conclusion & Recommendations

The market is set to expand from USD 21.00 Billion in 2026 to USD 62.80 Billion in 2035, a gain of USD 41.80 Billion. Our findings suggest that growth stays above 12% a year because AI capacity, power upgrades and regional sovereignty programs reinforce each other, while enterprise demand fades gradually. Providers should plan for a mix in which hyperscale and AI work reaches about 49% of revenue by 2035.

What Strategic Positioning Recommendations Does NMSC Offer?

Providers should build repeatable blocks for AI racks, invest in power and cooling engineering and secure local delivery capacity in Asia-Pacific and the Gulf. Partnerships with equipment makers and utilities reduce schedule risk. We recommend pricing tied to commissioning milestones, which aligns revenue with the constraints that actually limit project speed, and keeping an enterprise migration practice as a stable base.

How Strong Is the Investment Attractiveness of the Market?

Investment attractiveness is high but uneven. Installation and commissioning and power and cooling systems offer the strongest growth at 14.4% and 15.4%, yet they carry execution and labor risk. Enterprise facilities suit steady cash generation. Investors should favor firms with hyperscaler relationships, recurring operations revenue and disciplined project controls, and should test backlog quality against grid and equipment delivery assumptions.

What Are the Market Shifts and Key Risks Through 2035?

Three shifts and risks stand out. Concentration in a few hyperscale customers raises revenue volatility, grid and equipment shortages can delay commissioning for quarters, and rapid changes in rack design can strand skills and tooling. Our analysis shows that providers with modular delivery methods and a diversified customer mix handle these shocks better. Regulatory change, including European sustainability rating schemes, adds compliance work but also supports demand.

What Are the Primary Growth Pathways Through 2035?

Growth pathways run through AI factory deployment, power and cooling retrofits, sovereign and edge builds, and AI operations tooling that extends integration into long term optimization contracts. Asia-Pacific at 16.8% CAGR and Hyperscale and AI at 16.4% CAGR mark the fastest routes. Providers that combine these pathways with disciplined delivery can capture a disproportionate share of the market expected in 2035.

FAQs

Sources & References

1.

Kyndryl Holdings, Inc., Form 10-K, fiscal 2026 (SEC)

sec.gov
2.

Kyndryl Holdings, Inc., Form 8-K, fiscal 2026 results (SEC)

sec.gov
3.

DXC Technology Company, Form 10-K, fiscal 2026 (SEC)

sec.gov
4.

Accenture plc, Form 10-K, fiscal 2026 (SEC)

sec.gov
5.

IBM, first quarter 2026 results

newsroom.ibm.com
6.

HCLTech, Q1 FY27 press release

aap.com.au
7.

HCLTech, Q1 FY27 investor release

hcltech.com
8.

Tata Consultancy Services, Q1 FY27 earnings call transcript

tcs.com
9.

Capgemini SE, H1 2026 results press release

capgemini.com
10.

Fujitsu Limited, Q1 FY2026 financial summary

resources.global.fujitsu
11.

Infosys Limited, Form 6-K, Q1 FY27 results (SEC)

sec.gov
12.

Wipro Limited, Form 6-K, Q1 FY27 results (SEC)

sec.gov
13.

Cognizant Technology Solutions, Form 8-K, Q2 2026 results (SEC)

sec.gov
14.

NTT DATA Group Corporation, corporate profile

leo-cd01.nttdata.com
15.

NTT, Inc., IR presentation, data center business

group.ntt
16.

International Energy Agency, Energy and AI, executive summary

iea.org
17.

International Energy Agency, data centre electricity use in 2025

iea.org
18.

European Union, Commission Delegated Regulation (EU) 2024/1364

eur-lex.europa.eu
19.

American Public Power Association, summary of the US DOE and Lawrence Berkeley National Laboratory 2024 data center energy report

publicpower.org/node/24770

About the Author

Mayurima Roy

Mayurima Roy

Mayurima Roy is Research Analyst at Next Move Strategy Consulting, where she has spent 4 years working across the firm's full industry coverage rather than a single fixed vertical. Her work centers on structured research, ongoing trend tracking, competitive assessment, and insight-led content development, translating complex market data into clear, decision-ready narratives that support informed client decision-making across diverse global industries, market sectors, and world regions every day.

About the Reviewer

Supradip Baul

Supradip Baul

Supradip Baul is an accomplished business consultant and strategist with over a decade of rich experience in market intelligence, strategy, technology, and business transformation. His work has included rigorous qualitative and quantitative analysis across multiple industries, helping clients shape investment decisions and long-term roadmaps. Earlier in his career, he was associated with Gartner, where he contributed to industry-leading reports and market share analyses. He has worked with leading global companies and holds an MBA with a dual specialization in Marketing and Finance.

Download Free Sample

Kishu Kanda

KISHU KANDA

Strategy Analyst

Accenture

We purchased the AI Consumer Market Report from this company. Not only did they customize the report to meet our specific requirements, but they also showed great flexibility in accommodating our budget. The report we received fully met our expectations. Additionally, they provided prompt and thorough responses to both our pre-purchase and follow-up questions. We look forward to working with this company again in the future.

Semih Kavaklioglu

SEMIH KAVAKLIOGLU

Co-Founder & Sales Manager

Decortie

I work a lot in the marketing industry and I know that research is an essential part of any campaign. I have used Market research reports for my own products and I found them to be very informative and well-researched. The team here produces insightful reports for a good price

Gaurav Jaiswal

GAURAV JAISWAL

Founder & CEO

Yano Charge Private Limited

The EV Charging market research report provided by the NextMSC was exceptionally detailed and insightful. It offered a comprehensive analysis that proved to be a game-changer for our strategic planning. Truly a testament to the NextMSC’s expertise and thoroughness in EV market landscape & analysis.

Pratyush Kumar Das

PRATYUSH KUMAR DAS

Assistant Manager

Polycab India Limited

We would like to express our appreciation for the data and insights provided by nextmsc. We are very pleased with the quality and depth of the information, which has proven to be highly valuable and beneficial for our business decision-making.

Kevin Coker

KEVIN COKER

Founder, CEO and Board Diector

Proxima Clinical Research

I have been using Next MSC reports for product positioning in a new geography for a long time. They have by far the best reports I have found and the price is reasonable too!

Custom Market Research Services

We will customize the research for you if the listed report does not fully match your requirements.

Get 30% Free Customization

Select License

This website uses cookies to ensure you get the best experience on our website. Learn more

✖