Data Center Power Infrastructure Market Global Industry Analysis and Forecast (2026–2035)

Data Center Power Infrastructure Market size was USD 34.80 billion in 2026, projected to reach USD 104.96 billion by 2035, growing at a CAGR of 13.05% from 2026 to 2035. Key drivers include AI campus expansion, onsite power generation for grid-constrained sites, and adoption of 800 VDC rack architectures, with North America leading the market.

Download Free Sample PDF
Base Year (2025)
$27.00 Billion
Forecast (2035)
$104.96 Billion
CAGR (2026-2035)
13.1%
Top Region
North America

What Is the Data Center Power Infrastructure Market Size?

The global Data Center Power Infrastructure Market was USD 27.00 Billion in 2025, is estimated at USD 34.80 Billion in 2026, and is forecast to reach USD 104.96 Billion by 2035 at a 13.05% CAGR. North America leads with about 40% share in 2025, and Power Distribution and Protection holds about 32%.

We observed that AI campus buildouts are actively redistributing capital expenditure toward generation, energy storage, and rack delivery, thereby shifting revenue concentration across every segmentation axis.

Data Center Power Infrastructure Market Global Industry Analysis and Forecast (2026–2035) Revenue Forecast

Values in USD Billion

2025 $27.00 Billion
2025
2026 $34.80 Billion
2026
2027 $39.34 Billion
2027
2028 $44.48 Billion
2028
2029 $50.28 Billion
2029
2030 $56.84 Billion
2030
2031 $64.26 Billion
2031
2032 $72.64 Billion
2032
2033 $82.12 Billion
2033
2034 $92.84 Billion
2034
2035 $104.96 Billion
2035

Key Takeaways

By Product and Service Purchased: Power Distribution and Protection held the largest market share, expanding from USD 8.63 Billion in 2025 to USD 31.72 Billion by 2035. Concurrently, Electrical Energy Storage represents the fastest-growing segment, projected to expand at a 16.81% CAGR from 2026 to 2035.

By Data Center Operator Type: Hyperscale Cloud and AI Operators held the largest share, expanding from USD 11.88 Billion in 2025 to USD 50.68 Billion by 2035; Other Specialized Data Center Operators is the fastest growing at 17.39% CAGR from 2026–2035.

By Electrical Architecture: AC-Dominant Architecture held the largest share, expanding from USD 23.22 Billion in 2025 to USD 80.80 Billion by 2035; DC-Dominant Architecture is the fastest growing at 24.90% CAGR from 2026–2035.

By Power-Chain Location: Central Electrical Plant held the largest share, expanding from USD 8.10 Billion in 2025 to USD 31.53 Billion by 2035; Rack-Level Power Delivery is the fastest growing at 17.06% CAGR from 2026–2035.

By Sales Channel: Direct OEM Sale to Data Center Operator held the largest share, expanding from USD 10.26 Billion in 2025 to USD 36.47 Billion by 2035; EPC and Turnkey Integrator is the fastest growing at 15.17% CAGR from 2026–2035.

Dominant Region: North America held approximately 40% share in 2025 at USD 10.80 Billion and is projected to reach USD 38.23 Billion by 2035.

Fastest-Growing Region: Middle East & Africa is growing at 17.15% CAGR from 2026–2035, rising from USD 1.49 Billion in 2025 to USD 8.06 Billion by 2035.

Dominant Country: The U.S. leads with an estimated USD 9.29 Billion in 2025, projected to reach USD 32.45 Billion by 2035.

Fastest-Growing Country: India, among the 15 countries profiled, is growing at 19.61% CAGR from 2026–2035, rising from USD 0.73 Billion in 2025 to USD 4.81 Billion by 2035.

Investors can target an absolute opportunity of approximately USD 70.16 Billion between 2026 and 2035, favoring suppliers that secure capacity before campus energization.

According to NMSC analysis, EPC and Turnkey Integrator sales overtake direct OEM sales by 2035, shifting purchasing authority toward design build contractors.

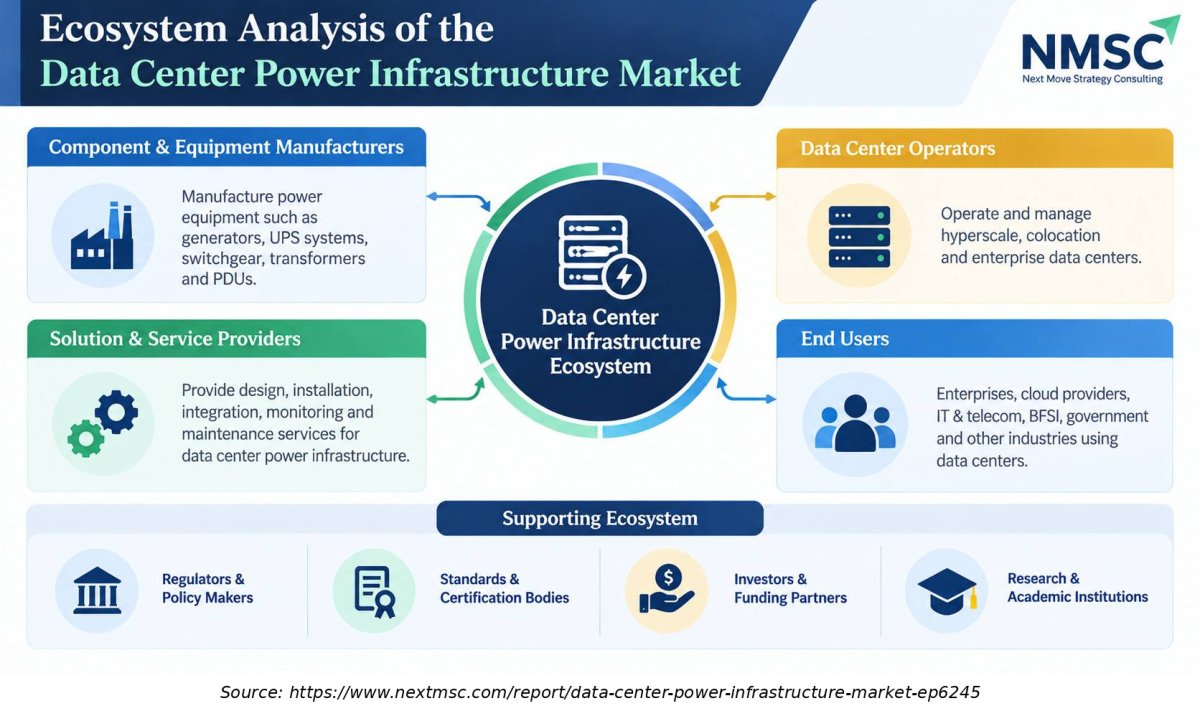
Ecosystem Analysis of the Data Center Power Infrastructure Market

The data center power infrastructure ecosystem comprises equipment manufacturers, solution and service providers, data center operators, and end users. Generators, UPS systems, switchgear, power distribution units, and transformers support reliable power delivery, while regulators, standards bodies, investors, and research institutions contribute to safety, innovation, and infrastructure development.

What does the Data Center Power Infrastructure Market Encompass?

The Data Center Power Infrastructure Market covers equipment and services that generate, convert, distribute, store, monitor and maintain electrical power inside and around data centers. It spans onsite generation, UPS and rectifiers, transformers, switchgear, busway, batteries, controls, software and lifecycle services. This market report excludes servers, cooling equipment and networking hardware, and it counts only separately purchased power assets to prevent double counting across value chain tiers.
The market has shifted from standby diesel and static UPS toward prime power, storage and DC distribution as rack power climbs. Regulation increasingly shapes demand, because the EU Energy Efficiency Directive requires reporting from data centres above 500 kW and US regulators are reforming large load interconnection. Our findings suggest that technology adoption is rapidly consolidating around 800 VDC readiness, lithium-ion storage integration, and advanced digital power monitoring.

Market Drivers & Dynamics

Interactive Dataset
AI and hyperscale campus buildouts raising power per hall driver +3.4% Global; North America and Asia-Pacific lead 2026–2035
Grid interconnection delays pushing onsite and bridge power driver +2.6% North America, Middle East & Africa 2026–2031
Shift to 800 VDC and hybrid AC and DC architectures driver +1.9% North America, Asia-Pacific 2027–2035
Battery storage adoption to absorb AI load swings driver +1.7% Global 2026–2035
Sovereign AI and government compute programs driver +1.2% Middle East, Europe, Asia-Pacific 2026–2033
Transformer, turbine and switchgear shortages and long lead times restraint −2.1% Global 2026–2029
Grid connection and permitting delays restraint −1.8% North America, Europe 2026–2030
Copper, steel and power semiconductor cost volatility and tariffs restraint −1.1% Global 2026–2028
Shortage of skilled labor for high voltage DC installation and service restraint −0.8% North America, Europe 2026–2032
Source: Next Move Strategy Consulting

Growth Drivers

What Is the Primary Growth Driver in the Data Center Power Infrastructure Market?

AI workload growth is the primary driver, because every added megawatt of compute needs generation, conversion, distribution and protection equipment. The IEA reports that electricity demand from data centres rose 17% in 2025, and it projects a rise from 485 TWh in 2025 to about 950 TWh by 2030. Capital expenditure at five large technology companies exceeded USD 400 Billion in 2025, and the IEA expects it to grow a further 75% in 2026.

How Is Grid Congestion Driving Data Center Power Infrastructure Market Growth?

Limited transmission capacity is pushing operators toward onsite generation, storage and flexible load designs, which expands equipment scope per site. A report by the Lawrence Berkeley National Laboratory for the US Department of Energy found that data centers consumed 4.4% of total US electricity in 2023. The study projects this load share to rise significantly to between 6.7% and 12.0% by 2028. Based on research conducted by NMSC, grid capacity bottlenecks directly accelerate operator demand for onsite turbines, switchgear, microgrid controllers, and substation transformers.

Growth Inhibitors

What Is Restraining the Data Center Power Infrastructure Market?

Supply chain tightness is the primary restraint, as the IEA identifies shortages of gas turbines and transformers alongside grid connection delays and permitting complexity. Lead times defer project energization and push buyers toward earlier framework orders, which concentrates revenue in fewer suppliers. Our analysis indicates that component supply restraints will remain temporary due to aggressive capacity expansion by key vendors. Notably, Hitachi Energy announced a USD 1.00 Billion US manufacturing investment in September 2025, while GE Vernova acquired Prolec GE in February 2026 to expand transformer production.

What Are the Growth Opportunities?

Can Prefabricated Power Skids Capture the Time to Power Premium?

Factory built skids that combine generators, switchgear, storage and controls let developers energize campuses before grid upgrades arrive. The mechanism is a single sourced, pre tested power block sold per megawatt, which shifts value toward integration. EPC and Turnkey Integrator buyers benefit most, since this channel grows at a 15.17% CAGR from 2026 to 2035 and overtakes direct OEM sales by 2035.

Does the 800 VDC Transition Create a Standalone Rectifier and Converter Whitespace?

Centralized rectifiers, DC busway and rack level converters are required to feed 800 VDC AI halls beginning in 2027. The mechanism is a new equipment layer replacing AC power supplies and PDUs in homogeneous AI zones. Standalone Rectifiers and Converters, forecast to grow at a 16.72% CAGR from 2026 to 2035, and the DC-Dominant Architecture segment are the direct beneficiaries.

Can Power Analytics and Managed Services Monetize the Installed Base?

Operators running large generator, UPS and battery fleets need predictive maintenance, power optimization and remote operations. The mechanism is subscription software and managed service contracts attached to installed equipment, which stabilizes supplier revenue. Power Management Software grows at a 17.19% CAGR from 2026 to 2035, and Modernization and Managed Services at 15.56%, benefiting vendors with large installed bases.

Segmentation Analysis

2025 (USD Billion)
2035 (USD Billion)
On-Site Power Generation 2025: $5.41 Billion | 2035: $22.39 Billion
On-Site Powe
Power Conversion and Conditioning 2025: $5.94 Billion | 2035: $21.61 Billion
Power Conver
Power Distribution and Protection 2025: $8.63 Billion | 2035: $31.72 Billion
Power Distri
Electrical Energy Storage 2025: $1.89 Billion | 2035: $10.00 Billion
Electrical E
Power Monitoring, Control and Software 2025: $1.35 Billion | 2035: $5.65 Billion
Power Monito
Services 2025: $3.24 Billion | 2035: $12.06 Billion
Services
Other Dedicated Power Infrastructure Equipment 2025: $0.54 Billion | 2035: $1.53 Billion
Other Dedica
On-Site Power Generation $5.41 Billion $22.39 Billion 13.84%
Power Conversion and Conditioning $5.94 Billion $21.61 Billion 12.25%
Power Distribution and Protection $8.63 Billion $31.72 Billion 12.34%
Electrical Energy Storage $1.89 Billion $10.00 Billion 16.81%
Power Monitoring, Control and Software $1.35 Billion $5.65 Billion 13.98%
Services $3.24 Billion $12.06 Billion 12.55%
Other Dedicated Power Infrastructure Equipment $0.54 Billion $1.53 Billion 9.25%

Which Product and Service Segments Dominate and Grow Fastest?

Power Distribution and Protection is the largest segment at USD 8.63 Billion in 2025, and it is forecast to reach USD 31.72 Billion by 2035. Electrical Energy Storage is the fastest growing at a 16.81% CAGR from 2026 to 2035, led by Battery Energy Storage Systems at 19.20%. We found that storage demand follows the IEA observation that AI power swings make storage critical, while transformers and switchgear remain the volume anchors of every project.

2025 (USD Billion)
2035 (USD Billion)
Category A
Category B
Category C
Category D
Segment Item 2025 (USD Billion) 2035 (USD Billion) CAGR
Category A $10.0 USD Billion $40.0 USD Billion 11.0%
Category B $17.1 USD Billion $51.1 USD Billion 21.0%
Category C $24.2 USD Billion $62.2 USD Billion 15.0%
Category D $31.3 USD Billion $73.3 USD Billion 13.0%

Segment-wise data is locked

Unlock complete segment-wise numbers for By Data Center Operator Type.

Unlock Full Data
2025 (USD Billion)
2035 (USD Billion)
Category A
Category B
Category C
Category D
Segment Item 2025 (USD Billion) 2035 (USD Billion) CAGR
Category A $10.0 USD Billion $40.0 USD Billion 16.0%
Category B $17.1 USD Billion $51.1 USD Billion 18.0%
Category C $24.2 USD Billion $62.2 USD Billion 24.0%
Category D $31.3 USD Billion $73.3 USD Billion 14.0%

Segment-wise data is locked

Unlock complete segment-wise numbers for By Electrical Architecture.

Unlock Full Data
2025 (USD Billion)
2035 (USD Billion)
Category A
Category B
Category C
Category D
Segment Item 2025 (USD Billion) 2035 (USD Billion) CAGR
Category A $10.0 USD Billion $40.0 USD Billion 21.0%
Category B $17.1 USD Billion $51.1 USD Billion 19.0%
Category C $24.2 USD Billion $62.2 USD Billion 21.0%
Category D $31.3 USD Billion $73.3 USD Billion 23.0%

Segment-wise data is locked

Unlock complete segment-wise numbers for By Power-Chain Location.

Unlock Full Data
2025 (USD Billion)
2035 (USD Billion)
Category A
Category B
Category C
Category D
Segment Item 2025 (USD Billion) 2035 (USD Billion) CAGR
Category A $10.0 USD Billion $40.0 USD Billion 24.0%
Category B $17.1 USD Billion $51.1 USD Billion 10.0%
Category C $24.2 USD Billion $62.2 USD Billion 8.0%
Category D $31.3 USD Billion $73.3 USD Billion 14.0%

Segment-wise data is locked

Unlock complete segment-wise numbers for By Sales Channel.

Unlock Full Data

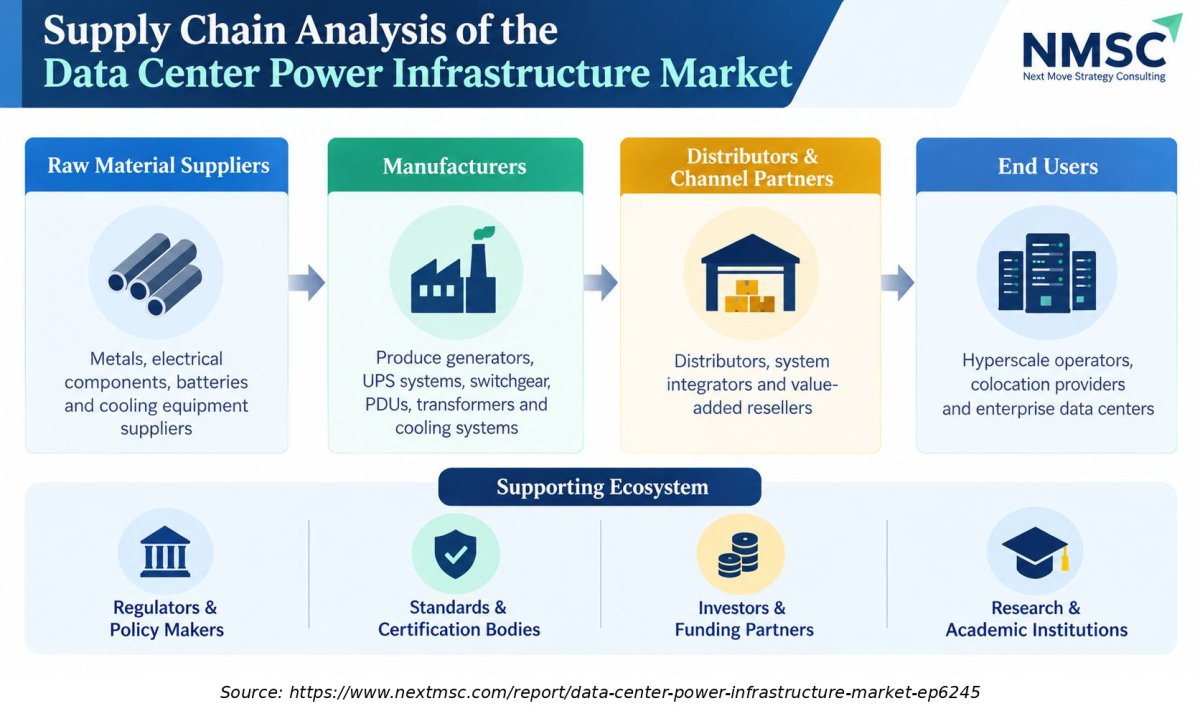
Supply Chain Analysis of the Data Center Power Infrastructure Market

Supply Chain Analysis of the Data Center Power Infrastructure Market
The data center power infrastructure supply chain begins with raw material and electrical component suppliers, followed by manufacturers of generators, UPS systems, switchgear, transformers, and cooling equipment. Distributors, system integrators, and channel partners facilitate product delivery and installation for hyperscale, colocation, and enterprise data centers, supported by regulatory bodies, certification organizations, investors, and research institutions.

Growth Opportunities

Our analysis shows that three whitespace opportunities are positioned to generate disproportionate Data Center Power Infrastructure Market revenue through 2035.

Can Prefabricated Power Skids Capture the Time to Power Premium?

Factory built skids that combine generators, switchgear, storage and controls let developers energize campuses before grid upgrades arrive. The mechanism is a single sourced, pre tested power block sold per megawatt, which shifts value toward integration. EPC and Turnkey Integrator buyers benefit most, since this channel grows at a 15.17% CAGR from 2026 to 2035 and overtakes direct OEM sales by 2035.

Does the 800 VDC Transition Create a Standalone Rectifier and Converter Whitespace?

Centralized rectifiers, DC busway and rack level converters are required to feed 800 VDC AI halls beginning in 2027. The mechanism is a new equipment layer replacing AC power supplies and PDUs in homogeneous AI zones. Standalone Rectifiers and Converters, forecast to grow at a 16.72% CAGR from 2026 to 2035, and the DC-Dominant Architecture segment are the direct beneficiaries.

Can Power Analytics and Managed Services Monetize the Installed Base?

Operators running large generator, UPS and battery fleets need predictive maintenance, power optimization and remote operations. The mechanism is subscription software and managed service contracts attached to installed equipment, which stabilizes supplier revenue. Power Management Software grows at a 17.19% CAGR from 2026 to 2035, and Modernization and Managed Services at 15.56%, benefiting vendors with large installed bases.

Regional Outlook

2025 (USD Billion)
2035 (USD Billion)
North Americ
Europe
Asia-Pacific
Middle East
Latin Americ
Region 2025 (USD Billion) 2035 (USD Billion) CAGR (%)
North America $10.0 USD Billion $40.0 USD Billion 9.0%
Europe $17.1 USD Billion $51.1 USD Billion 27.0%
Asia-Pacific $24.2 USD Billion $62.2 USD Billion 25.0%
Middle East & Africa $31.3 USD Billion $73.3 USD Billion 23.0%
Latin America $38.4 USD Billion $84.4 USD Billion 12.0%

Regional data is locked

Unlock complete regional numbers for this market.

Unlock Full Data

Competitive Landscape

Our assessment indicates that the market remains moderately concentrated, with electrical majors, critical power specialists, and engine OEMs competing directly for hyperscale campus deployments.

Dimension Description
Market Structure Moderately concentrated; global electrical and critical power suppliers lead, while engine, turbine and transformer specialists dominate their niches.
Innovation Focus 800 VDC power systems, solid state transformers, lithium-ion storage, prime power turbine packages and AI based power analytics.
M&A Activity Acquisitions of prefabricated enclosure, transformer and solid-state power specialists, plus strategic collaborations between generation and distribution suppliers.

How Do Companies Compete in the Data Center Power Infrastructure Market?

Companies compete on delivery capacity, grid to rack portfolio breadth and the ability to commit manufacturing slots to hyperscale frameworks. Pricing is project based, and suppliers protect margins through bundled systems and long service contracts instead of discounting. Geographic expansion follows demand, as Hitachi Energy's USD 1.00 Billion US plan and Caterpillar's capacity expansion show. We observed that reliability records and speed matter more than unit price on AI campuses.

Which Competitive Archetypes Dominate the Data Center Power Infrastructure Market?

Three archetypes dominate. Electrical majors such as Schneider Electric SE, Eaton Corporation plc, ABB Ltd. and Siemens AG win on portfolio breadth and global service. Critical power specialists such as Vertiv Holdings Co., Delta Electronics, Inc. and Socomec SAS win on UPS and rack power depth. Engine and turbine OEMs such as Caterpillar Inc., Cummins Inc. and GE Vernova Inc. win on prime power scale.

What Innovation and Differentiation Strategies Are Companies Pursuing?

Leaders differentiate through 800 VDC readiness, validated reference designs with NVIDIA and integrated power and cooling blocks. Eaton acquired Resilient Power Systems in August 2025 to scale medium voltage solid state transformer technology, and Vertiv and Caterpillar paired distribution with generation in November 2025. Our findings suggest that software, digital twins and analytics will separate suppliers once hardware specifications converge.

What M&A and Partnership Activity Is Shaping the Data Center Power Infrastructure Market?

Consolidation targets scarce capacity and new technology. Eaton completed the Fibrebond acquisition in April 2025 and Resilient Power Systems in August 2025, while GE Vernova completed Prolec GE in February 2026 to deepen its transformer position. Strategic frameworks, such as Caterpillar with ProPetro for up to 2.1 GW, lock in long term supply. Our analysis shows that integrated generation and distribution partnerships will remain more common than large mergers.

Key Market Players

Based on research conducted by NMSC, the following 20 companies represent the validated leadership set across power generation, conversion, distribution and services.

Schneider Electric SE Vertiv Holdings Co. Eaton Corporation plc ABB Ltd. Siemens AG Legrand SA Delta Electronics, Inc. Huawei Technologies Co., Ltd. GE Vernova Inc. Hitachi Energy Ltd. Cummins Inc. Caterpillar Inc. Mitsubishi Electric Corporation Fuji Electric Co., Ltd. Generac Power Systems, Inc. Rolls-Royce Power Systems AG Rehlko Toshiba International Corporation Socomec SAS Piller Group GmbH

Latest Developments

During our market evaluation, we noticed that 2025–2026 activity centers on 800 VDC alignment, transformer capacity and prime power partnerships.

Date Event
September 2026 Eaton signed an agreement to acquire COL Group for an enterprise value of €810 million. COL Group supplies medium-voltage distribution equipment, including SF₆-free switchgear, grid automation and modular power systems. The deal would expand Eaton’s European manufacturing footprint for data-center and utility customers; closing is expected in Q1 2027.
September 2026 ABB launched Infinitus, an integrated source-to-rack direct-current portfolio for AI data centers. It combines solid-state transformers, medium-voltage powertrains, DC sources, distribution and protection, and cooling optimization. ABB says components are expected over the next 12 months, with the first complete DC-native facilities expected within two to three years

Investment Opportunities

Where Are Capital Inflows Concentrating in the Data Center Power Infrastructure Market?

Capital is concentrating in manufacturing capacity, acquisitions and power as a service. According to IEA reports, capital expenditure across the five largest technology companies exceeded USD 400 Billion in 2025. In response, vendors are expanding capacity, highlighted by Eaton acquiring Fibrebond for USD 1.40 Billion and Hitachi Energy committing USD 1.00 Billion to US manufacturing facilities. Investors should favor suppliers with secured turbine, transformer and switchgear slots, because capacity is the scarce asset through 2029.

How Is Infrastructure Investment Shaping Data Center Power Infrastructure Market Capacity?

Infrastructure investment is shifting toward transformer plants, turbine lines and prefabrication facilities that shorten delivery. Caterpillar's framework with ProPetro for up to 2.1 GW, and GE Vernova's Prolec GE purchase, show suppliers and customers locking capacity years ahead. Utilities and regulators also invest in interconnection reform, which lifts demand for substation equipment and monitoring, and benefits suppliers positioned near large load corridors.

What ESG Considerations Are Influencing Data Center Power Infrastructure Market Investment?

Environmental, Social, and Governance considerations focus on emissions from onsite gas generation, battery safety and efficiency disclosure. The European Commission requires reporting from data centres above 500 kW and is advancing ratings that classify power and water efficiency. Investors increasingly favor suppliers with efficient UPS, low loss transformers, hydrogen ready engines and green datacenter credentials, while worker safety in high voltage DC servicing becomes a governance issue.

Key Benefits for Stakeholders

How Does This Report Benefit Data Center Operators and Industry Leaders?

Operators and engineering leaders gain segment level revenue forecasts from USD 27.00 Billion in 2025 to USD 104.96 Billion by 2035, and clear guidance on architecture choices. The analysis compares AC, DC and hybrid paths, onsite power options and procurement channels. Leaders can time capacity reservations, benchmark suppliers and plan retrofit cycles with confidence in the 13.05% CAGR outlook.

How Does This Report Benefit Investors and Financial Analysts?

Investors and financial analysts receive a reconciled sizing model across segments, regions and countries, with every table summing to the global totals. The USD 70.16 Billion absolute opportunity between 2026 and 2035, plus segment CAGRs from 8.17% to 24.90%, helps screen exposure by technology and geography. The competitive and M&A assessment highlights where capacity scarcity supports pricing power.

How Does This Report Benefit Technology Vendors and Product Teams?

Vendors and product teams gain visibility into which segments, notably Electrical Energy Storage, Standalone Rectifiers and Converters and Power Management Software, outgrow the Data Center Power Infrastructure market. The report maps differentiation themes, channel shifts toward EPC firms and regional demand by country. Product managers can prioritize 800 VDC certification, storage integration and analytics roadmaps against quantified demand to 2035.

Key Market Segments Evaluated

By Product and Service Purchased

  • On-Site Power Generation 
    • Engine Generator Sets
      • Diesel and Liquid-Fuel Generator Sets
      • Natural-Gas Generator Sets
      • Other-Fuel Generator Sets
    • Turbine Generation Packages
      • Gas Turbine Packages
      • Other Turbine Packages
    • Fuel-Cell Generation Systems
    • On-Site Renewable Generation Systems
      • Solar Photovoltaic Systems
      • Other Dedicated Renewable Generation Systems
  • Power Conversion and Conditioning 
    • Uninterruptible Power Supply Systems
      • Static AC UPS
      • Rotary and Kinetic UPS
      • DC UPS
    • Standalone Rectifiers and Converters
      • AC-DC Rectifiers and DC Power Systems
      • DC-DC Power Converters
    • Power-Quality Conditioning Equipment
      • Voltage Regulators and Conditioners
      • Harmonic Filters and Power-Factor Correction Equipment
  • Power Distribution and Protection 
    • Transformers
      • High-Voltage and Medium-Voltage Site Transformers
      • Medium-Voltage and Low-Voltage Distribution Transformers
    • Switchgear and Switchboards
      • Medium-Voltage Switchgear
      • Low-Voltage Switchgear and Switchboards
    • Transfer Switching Equipment
      • Automatic Transfer Switches
      • Static Transfer Switches
    • Power Distribution Units and Panels
      • Floor-Standing Power Distribution Units
      • Remote Power Panels and Branch-Circuit Panels
      • Rack Power Distribution Units
    • Busway and Busbar Systems
      • Busway Systems with Tap-Off Units
      • Other Dedicated Busbar Distribution Systems
    • Power Cabling and Connections
      • Facility Feeder Cables and Terminations
      • Rack Power Whips and Connectors
    • Other Discrete Distribution and Protection Equipment
      • Standalone Circuit Breakers and Protection Relays
      • Surge Protection and Grounding Equipment
  • Electrical Energy Storage 
    • Battery Energy Storage Systems
      • Lithium-Ion Systems
      • Lead-Acid Systems
      • Other Battery Chemistries
    • Separately Sold UPS Battery Systems
      • Replacement Battery Strings
      • Replacement Battery Cabinets
    • Standalone Kinetic Energy Storage
      • Flywheel Storage Systems
      • Other Kinetic Storage Systems
  • Power Monitoring, Control and Software 
    • Monitoring and Metering Hardware
      • Power and Energy Meters
      • Power-Quality Sensors and Monitors
    • Electrical Control and Automation
      • Power-System and Microgrid Controllers
      • Standalone Equipment-Control Systems
    • Power Management Software
      • Electrical Power Monitoring Software
      • Power Optimization and Analytics Software
  • Services 
    • Engineering and System Integration
      • Power-System Design and Engineering
      • Electrical Integration and Testing Design
    • Installation and Commissioning
      • Installation and Site Acceptance Testing
      • Commissioning and Performance Validation
    • Maintenance and Repair
      • Preventive and Corrective Maintenance
      • Repair and Emergency Field Service
    • Modernization and Managed Services
      • Equipment Retrofit and Upgrades
      • Remote Monitoring and Managed Operations
  • Other Dedicated Power Infrastructure Equipment 
    • Standalone Electrical Enclosures and Mounting Assemblies
    • Other Separately Purchased Facility-Power Accessories

By Data Center Operator Type

  • Hyperscale Cloud and AI Operators
  • Colocation and Wholesale Data Center Operators
  • Enterprise and Private Data Center Operators
  • Telecom and Edge Operators
  • Government, Defence and Research Operators
  • Other Specialized Data Center Operators

By Electrical Architecture

  • AC-Dominant Architecture
  • DC-Dominant Architecture
  • Hybrid AC-DC Architecture

By Power-Chain Location

  • Grid Interconnection and Substation
  • Central Electrical Plant
  • Facility-Level Distribution
  • Data Hall and Row Distribution
  • Rack-Level Power Delivery
  • Supervisory Monitoring and Control

By Sales Channel

  • Direct OEM Sale to Data Center Operator
  • EPC and Turnkey Integrator
  • Electrical Contractor and Panel Builder
  • Distributor and Reseller

By Region

  • North America 
    • U.S.
    • Canada
    • Mexico
  • Europe 
    • UK
    • Germany
    • France
    • Italy
    • Spain
    • Sweden
    • Denmark
    • Finland
    • Netherlands
    • Rest of Europe
  • Asia-Pacific 
    • China
    • India
    • Japan
    • South Korea
    • Taiwan
    • Indonesia
    • Vietnam
    • Australia
    • Philippines
    • Malaysia
    • Rest of APAC
  • Middle East & Africa 
    • Saudi Arabia
    • UAE
    • Egypt
    • Israel
    • Turkey
    • Nigeria
    • South Africa
    • Rest of MEA
  • Latin America 
    • Brazil
    • Argentina
    • Chile
    • Colombia
    • Rest of LATAM

Conclusion & Recommendations

The market is forecast to expand from USD 34.80 Billion in 2026 to USD 104.96 Billion by 2035, adding USD 70.16 Billion. Our assessment indicates that growth stays strong because AI workloads keep raising power per rack and site. Mix will shift toward storage, DC distribution and onsite generation, while services provide durable recurring revenue as installed fleets age and operators seek uptime.

What Strategic Positioning Recommendations Does NMSC Offer?

Suppliers in the Data Center Power Infrastructure Market should secure manufacturing capacity, certify 800 VDC products and build integrated generation, storage and distribution offers. We recommend strengthening relationships with EPC and turnkey integrators, since that channel overtakes direct sales by 2035. Operators should reserve equipment slots early, standardize reference designs and negotiate service terms. Both groups should prioritize North America and the fast growing Middle East and Asia-Pacific corridors.

What Investment Attractiveness Does the Market Offer Through 2035?

Investment attractiveness is high, supported by the USD 70.16 Billion opportunity and a 13.05% CAGR from 2026 to 2035. The strongest risk adjusted exposure sits in transformers, switchgear, storage and power software, where demand is visible and capacity is constrained. Capital intensive turbine and fuel cell exposure offers higher growth but needs closer attention to execution, fuel supply and emissions rules.

What Are the Market Shifts and Key Risks Through 2035?

Key shifts include the move from standby to prime power, from AC toward hybrid and DC designs, and from direct purchasing to integrator led procurement. Key risks include shortages of transformers and turbines, interconnection delays, input cost swings and a possible slowdown in AI capital spending. Regulatory uncertainty on efficiency standards and large load tariffs may also change project economics across regions.

What Are the Growth Pathways Through 2035?

Primary growth pathways include battery energy storage at a 19.20% CAGR, DC-Dominant Architecture at 24.90%, and fast growing regions led by Middle East & Africa at 17.15%. Services and software add recurring revenue through managed operations and analytics. Suppliers combining prefabrication, integrated controls and local assembly are best placed to convert these pathways into sustained share gains.

Delivered Customizations

We have successfully delivered the following deep-dive customizations:

Client Request Customization Delivered Value Adds
Historical Power Equipment Market Analysis
  • Historical revenue and shipment analysis of data center power equipment across product categories, operator types, and regions.
  • Identifies fastest-growing power equipment categories and informs capacity and investment prioritization.
Vendor Share in Power Product Categories
  • Company-level revenue share benchmarking across UPS, backup generators, switchgear, PDUs, and power-distribution products.
  • Highlights competitive positioning gaps and supports portfolio focus and partnership decisions.
Country-Level Power Equipment Trade Assessment
  • Country-wise import and export analysis of UPS systems, generators, transformers, switchgear, and batteries used in data centers.
  • Reveals sourcing dependencies and export opportunities for manufacturing and distribution strategy.
Operator-Type Power Capacity Pipeline Assessment
  • Megawatt capacity pipeline analysis for hyperscale, colocation, and enterprise data center operators based on public announcements and planning records.
  • Pinpoints where near-term power equipment demand will concentrate to guide sales targeting and capacity planning.
Power-Chain Content-per-MW Benchmarking
  • Equipment value per megawatt across medium-voltage, UPS, distribution, and backup generation layers by electrical architecture.
  • Quantifies value opportunity by power-chain stage and supports product pricing and architecture-led offering decisions.
Installed-Base Service and Lifecycle Revenue Opportunity
  • Estimated service, maintenance, and battery-replacement revenue pool for installed UPS, generator, and switchgear assets by operator type.
  • Sizes recurring service revenue potential and supports service contract and aftermarket strategy.

FAQs

Sources & References

1.

International Energy Agency, Key Questions on Energy and AI (Executive Summary, 2026)

iea.org
2.

International Energy Agency, Data centre electricity use surged in 2025 (April 2026)

iea.org
3.

U.S. Department of Energy, 2024 Report on U.S. Data Center Energy Use

energy.gov
4.

Lawrence Berkeley National Laboratory, Report Evaluates Increase in Electricity Demand from Data Centers

energyanalysis.lbl.gov
5.

European Commission, Energy performance of data centres

energy.ec.europa.eu
6.

European Commission, EU-wide scheme for rating sustainability of data centres (March 2024)

energy.ec.europa.eu
7.

U.S. Federal Energy Regulatory Commission, large load interconnection proceedings (homepage)

ferc.gov
8.

Eaton, Eaton completes acquisition of Fibrebond (April 2025)

businesswire.com
9.

Eaton, Eaton completes acquisition of Resilient Power Systems Inc. (August 2025)

businesswire.com
10.

Vertiv, Vertiv accelerates AI infrastructure evolution in alignment with NVIDIA 800 VDC (May 2025)

prnewswire.com
11.

Schneider Electric, 800 VDC power systems in support of NVIDIA's next generation GPUs (October 2025)

se.com
12.

Caterpillar, Vertiv and Caterpillar energy optimization collaboration (November 2025)

caterpillar.com
13.

Caterpillar, PROPWR strategic framework agreement (April 2026)

caterpillar.com
14.

GE Vernova, GE Vernova completes Prolec GE acquisition (February 2026)

gevernova.com
15.

Hitachi Energy, USD 1 billion US manufacturing investment (September 2025)

hitachienergy.com

About the Author

Liza Phukan

Liza Phukan

Liza Phukan is Research Associate at Next Move Strategy Consulting, where she has covered emerging industries and market research across sectors for 3.5 years. Her work includes analyzing industry developments, validating market data, and developing structured business content from research findings. She uses secondary research and data-validation practices to turn complex market information into clear decision-useful market analysis for business audiences and support report development and B2B.

About the Reviewer

Supradip Baul

Supradip Baul

Supradip Baul is an accomplished business consultant and strategist with over a decade of rich experience in market intelligence, strategy, technology, and business transformation. His work has included rigorous qualitative and quantitative analysis across multiple industries, helping clients shape investment decisions and long-term roadmaps. Earlier in his career, he was associated with Gartner, where he contributed to industry-leading reports and market share analyses. He has worked with leading global companies and holds an MBA with a dual specialization in Marketing and Finance.

Download Free Sample

Nishant Awate

NISHANT AWATE

Business Development Global Sales

Zehnder Group Deutschland GmbH

Our experience working with Next Move Strategy Consulting was positive. The team was responsive, professional, and open to incorporating our specific requirements throughout the project. The India AHU market study was comprehensive and well structured, covering market value and volume forecasts, product and application segments, and key industry trends. The inclusion of both AHU and residential MVHR market insights made the study particularly relevant for our strategic market assessment. Overall, the report provides a solid foundation for evaluating market potential, identifying priority segments, and supporting business-development decisions in India.

Gaurav Jaiswal

GAURAV JAISWAL

Founder & CEO

Yano Charge Private Limited

The EV Charging market research report provided by the NextMSC was exceptionally detailed and insightful. It offered a comprehensive analysis that proved to be a game-changer for our strategic planning. Truly a testament to the NextMSC’s expertise and thoroughness in EV market landscape & analysis.

Pratyush Kumar Das

PRATYUSH KUMAR DAS

Assistant Manager

Polycab India Limited

We would like to express our appreciation for the data and insights provided by nextmsc. We are very pleased with the quality and depth of the information, which has proven to be highly valuable and beneficial for our business decision-making.

Diana Trejo

DIANA TREJO

Assistant Manager

Sumitomo Corporation de Mexico, S.A. de C.V.

Recently, we purchased a report on the Mexico Data Center Market from Next Move Strategy Consulting. The service has been excellent, with support that is always timely and thoroughly professional. The information provided is interesting, highly useful, and delivered with clarity. I would highly recommend NextMSC for anyone seeking insightful and dependable analysis.

Kevin Coker

KEVIN COKER

Founder, CEO and Board Diector

Proxima Clinical Research

I have been using Next MSC reports for product positioning in a new geography for a long time. They have by far the best reports I have found and the price is reasonable too!

Custom Market Research Services

We will customize the research for you if the listed report does not fully match your requirements.

Get 30% Free Customization

Select License

This website uses cookies to ensure you get the best experience on our website. Learn more

✖