Dynamic Random Access Memory (DRAM) Market Global Industry Analysis and Forecast (2026–2035)

Dynamic Random Access Memory (DRAM) Market size was USD 184.13 billion in 2026, projected to reach USD 434.97 billion by 2035, growing at a CAGR of 10.02% from 2026 to 2035. Key drivers include AI accelerator demand for High Bandwidth Memory, the migration of servers to DDR5, and rising LPDDR content in on-device AI products, with Asia-Pacific leading the market.

Download Free Sample PDF
Base Year (2025)
$184.13 Billion
Forecast (2035)
$434.97 Billion
CAGR (2026-2035)
10.0%
Top Region
Asia-Pacific

What Is the Dynamic Random Access Memory (DRAM) Market Size?

The 2026 market estimate must be updated using the latest available forecast. The 2035 market value and CAGR must then be recalculated from the same forecast series. Asia-Pacific leads with approximately 52% revenue share in 2025, while DDR SDRAM is the dominant architecture with approximately 44% of revenue.

We observed that artificial intelligence server buildouts have shifted DRAM purchasing from commodity volume toward value dense products such as High Bandwidth Memory, DDR5 server modules and LPDDR for accelerator platforms. Accelerator performance now depends on memory bandwidth and capacity as much as on compute, which raises content per system and changes how suppliers allocate wafer capacity.

Dynamic Random Access Memory (DRAM) Market Global Industry Analysis and Forecast (2026–2035) Revenue Forecast

Values in USD Billion

2025 $184.13 Billion
2025
2026 $202.58 Billion
2026
2027 $222.88 Billion
2027
2028 $245.21 Billion
2028
2029 $269.78 Billion
2029
2030 $296.81 Billion
2030
2031 $326.55 Billion
2031
2032 $359.27 Billion
2032
2033 $395.27 Billion
2033
2034 $434.88 Billion
2034
2035 $434.97 Billion
2035

Key Takeaways

By Product Architecture: DDR SDRAM held the largest share, expanding from USD 68.76 Billion in 2025 to USD 147.89 Billion by 2035; High Bandwidth Memory is the fastest growing at 15.92% CAGR from 2026–2035.

By Die Density: Above 8.1 Gb to 16 Gb held the largest share, expanding from USD 62.50 Billion in 2025 to USD 121.79 Billion by 2035; Above 32 Gb is the fastest growing at 22.87% CAGR from 2026–2035.

By Immediate Contracting Counterparty: System OEM held the largest share, expanding from USD 46.88 Billion in 2025 to USD 121.79 Billion by 2035; Semiconductor and Accelerator Vendor is the fastest growing at 13.94% CAGR from 2026–2035.

By Sales Channel: Direct Sales held the largest share, expanding from USD 112.50 Billion in 2025 to USD 330.58 Billion by 2035, and is also the fastest growing at 10.62% CAGR from 2026–2035.

By End-User: Server and Data Center Systems held the largest share, expanding from USD 58.59 Billion in 2025 to USD 187.04 Billion by 2035; Healthcare Systems is the fastest growing at 17.62% CAGR from 2026–2035.

Dominant Region: Asia-Pacific dominated with approximately 52% revenue share in 2025, at USD 81.25 Billion, anchored by memory manufacturing and electronics assembly.

Fastest-Growing Region: Latin America is expected to register the highest CAGR of 13.18% during 2026–2035, driven by data center and mobile device build outs.

Dominant Country: The U.S. led the market with an estimated USD 40.32 Billion in 2025, supported by hyperscale data center and accelerator demand.

Fastest-Growing Country: India is projected to expand from USD 4.06 Billion in 2025 at a CAGR of 18.13%, driven by electronics assembly and data center investment.

The absolute opportunity must be recalculated as the updated 2035 forecast less the revised 2026 market value. The existing USD 250.84 billion estimate should not be retained. This positions High Bandwidth Memory, DDR5 server memory and high density dies as the most capital efficient categories for memory investors.

According to NMSC analysis, the shift of High Bandwidth Memory from an accelerator side component to a contracted capacity commitment is the most structurally significant change in the market. It moves a large share of supplier revenue from spot pricing toward negotiated volume agreements, which stabilizes utilization planning across the leading fabs.

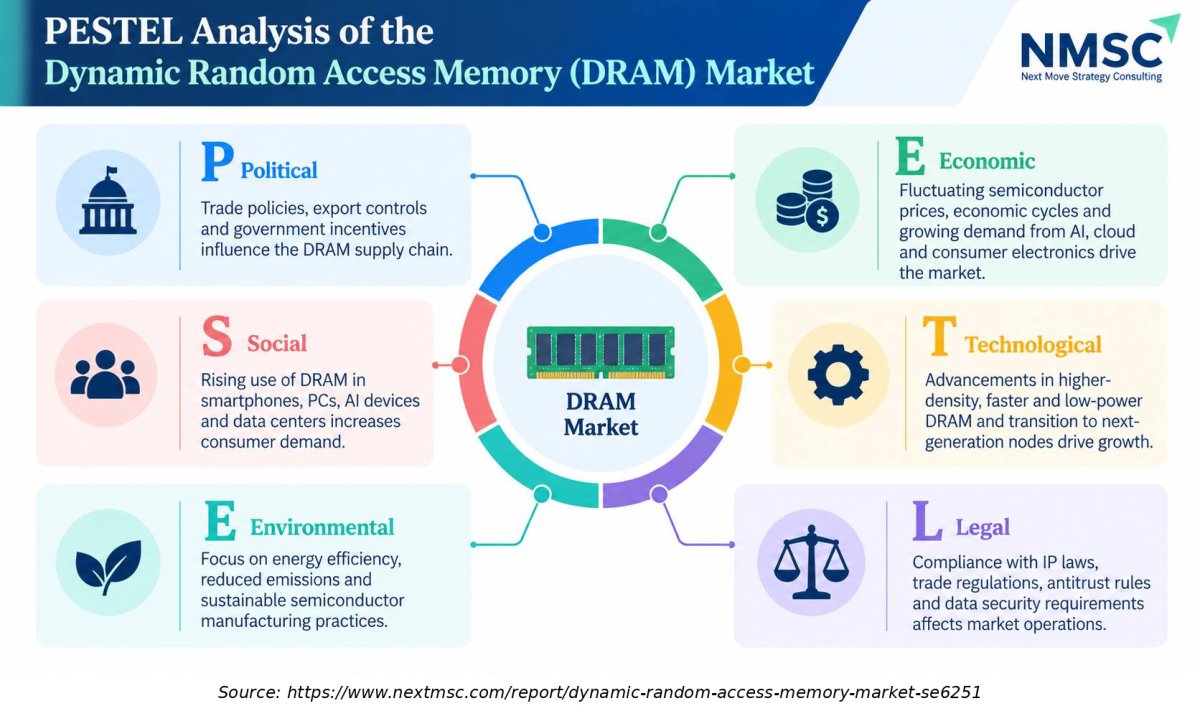
PESTEL Analysis of the Dynamic Random Access Memory (DRAM) Market

PESTEL Analysis of the Dynamic Random Access Memory (DRAM) Market
The Dynamic Random Access Memory (DRAM) market is influenced by government trade policies, semiconductor investments, and demand from AI, cloud computing, and consumer electronics. Technological advancements in memory density, speed, and power efficiency shape market growth. Environmental concerns encourage energy-efficient manufacturing, while intellectual property protection, export controls, trade regulations, and data security requirements affect industry operations.

What does the Dynamic Random Access Memory (DRAM) Market Encompass?

This Dynamic Random Access Memory (DRAM) market covers volatile semiconductor memory devices and modules that store each bit as a charge in a capacitor and require periodic refresh. It includes DDR, LPDDR, GDDR and High Bandwidth Memory products, plus legacy and specialty interfaces, sold as dies, packaged components and stacked devices. The scope excludes NAND flash, NOR flash, SRAM and emerging non volatile memories, and it measures supplier revenue rather than the value of end systems.

Product interfaces are defined by JEDEC, whose published specifications for DDR5, LPDDR6 and High Bandwidth Memory set the rules that suppliers and buyers adopt across platforms. Public policy also shapes the structure of supply, including U.S. CHIPS Act funding for Micron fabs and export control rules affecting advanced equipment and accelerators. Technology adoption is moving toward sixth generation 10 nanometer class processes, taller die stacks and advanced packaging.

Market Drivers & Dynamics

Interactive Dataset
AI accelerator demand for High Bandwidth Memory and high capacity server memory driver +3.4% Global 2026–2035
Migration of servers and clients from DDR4 to DDR5 driver +2.1% Global 2026–2032
Rising LPDDR content in smartphones, AI PCs and edge devices driver +1.6% Asia-Pacific, North America 2026–2033
Growing memory content per vehicle and industrial system driver +0.9% Global 2027–2035
Public funding and fab investment supporting regional supply driver +0.7% North America, Asia-Pacific 2026–2031
Cyclical oversupply risk as new fabs reach volume restraint −1.8% Global 2028–2035
Capital intensity and long fab construction timelines restraint −1.1% Global 2026–2032
Export controls and trade restrictions on equipment and chips restraint −0.9% Asia-Pacific 2026–2035
Customer concentration and buyer pricing power in AI accelerators restraint −0.6% Global 2026–2033
Source: Next Move Strategy Consulting

Growth Drivers

What Is the Primary Growth Driver in the Dynamic Random Access Memory (DRAM) Market?

Demand for memory attached to AI accelerators is the primary driver of the Dynamic Random Access Memory (DRAM) market. Each accelerator generation adds stacks, capacity and bandwidth, so memory content per system rises faster than unit shipments. Micron stated in December 2025 that it was exiting the Crucial consumer business to improve supply for larger strategic customers in faster growing segments. Industry derived estimates place High Bandwidth Memory at USD 41.43 Billion in 2026, growing at 15.92% CAGR to 2035.

How Is Server and Data Center Spending Driving Dynamic Random Access Memory (DRAM) Market Growth?

Cloud operators are refreshing fleets with DDR5 platforms and raising installed capacity per server to support training and inference. We observed that this spending moves through system OEMs, ODMs and accelerator vendors, which explains their rising share of purchases. Our estimates place Server and Data Center Systems at USD 70.06 Billion in 2026 and USD 187.04 Billion by 2035, a CAGR of 11.53%.

Growth Inhibitors

What Is Restraining the Dynamic Random Access Memory (DRAM) Market?

The primary restraint is the cyclical link between capacity additions and prices. Fabs cost billions of dollars and take years to reach volume, so suppliers commit capital during shortages and then face oversupply when output arrives. Industry derived estimates indicate that a new fab need roughly three to four years from groundbreaking to meaningful output, and Micron's New York site is a current example. Export controls add uncertainty for suppliers with fabs or customers in restricted Dynamic Random Access Memory (DRAM) markets.

What Are the Growth Opportunities?

Can DDR5 Module Upgrades Capture the Data Center Refresh Cycle?

Operators replacing DDR4 servers move to DDR5 at higher capacity per socket. The mechanism is processor platform transitions that require the newer interface. This benefits DDR5 and newer, which reaches USD 115.35 Billion by 2035, and the System OEM counterparty segment.

Does Automotive and Edge Compute Memory Represent an Untapped Volume Opportunity?

Vehicles with centralized compute and driver assistance need more LPDDR and GDDR with strict reliability qualification. The mechanism is multi year design wins that lock in supply for production programs. Automotive Systems grows at 15.33% CAGR, benefiting suppliers with automotive grade portfolios and the Industrial and Embedded Systems segment.

Can 32 Gb Dies Unlock Higher Stack Capacity for Accelerators?

Higher density dies allow taller stacks and larger module capacities within the same footprint. The mechanism is process shrinks that raise bits per wafer. The Above 32 Gb band grows at 22.87% CAGR, benefiting High Bandwidth Memory suppliers and the Graphics and Accelerator Hardware segment.

Segmentation Analysis

2025 (USD Billion)
2035 (USD Billion)
DDR SDRAM 2025: $68.76 Billion | 2035: $147.89 Billion
DDR SDRAM
LPDDR SDRAM 2025: $37.50 Billion | 2035: $95.69 Billion
LPDDR SDRAM
GDDR SDRAM 2025: $12.50 Billion | 2035: $26.10 Billion
GDDR SDRAM
High Bandwidth Memory 2025: $32.81 Billion | 2035: $156.59 Billion
High Bandwid
Other DRAM Interfaces 2025: $4.69 Billion | 2035: $8.70 Billion
Other DRAM I
DDR SDRAM $68.76 Billion $147.89 Billion 7.19%
LPDDR SDRAM $37.50 Billion $95.69 Billion 9.07%
GDDR SDRAM $12.50 Billion $26.10 Billion 6.86%
High Bandwidth Memory $32.81 Billion $156.59 Billion 15.92%
Other DRAM Interfaces $4.69 Billion $8.70 Billion 5.57%

Which Product Architecture Leads the Dynamic Random Access Memory (DRAM) Market?

DDR SDRAM is the largest architecture at USD 68.76 Billion in 2025, supported by server, PC and embedded demand, but High Bandwidth Memory is the fastest growing at 15.92% CAGR from 2026 to 2035. Within sub segments, HBM4 and newer grows at 41.68%, and GDDR7 and newer at 26.97%. Older interfaces such as DDR3 decline at -11.30% as buyers migrate platforms.

2025 (USD Billion)
2035 (USD Billion)
Up to 4 Gb
Above 4.1 Gb
Above 8.1 Gb
Above 16.1 G
Above 32 Gb
Segment Item 2025 (USD Billion) 2035 (USD Billion) CAGR
Up to 4 Gb $10.0 USD Billion $40.0 USD Billion 26.0%
Above 4.1 Gb to 8 Gb $17.1 USD Billion $51.1 USD Billion 24.0%
Above 8.1 Gb to 16 Gb $24.2 USD Billion $62.2 USD Billion 22.0%
Above 16.1 Gb to 32 Gb $31.3 USD Billion $73.3 USD Billion 8.0%
Above 32 Gb $38.4 USD Billion $84.4 USD Billion 27.0%

Segment-wise data is locked

Unlock complete segment-wise numbers for By Die Density.

Unlock Full Data
2025 (USD Billion)
2035 (USD Billion)
System OEM
ODM and EMS
Semiconducto
Memory Modul
Authorized D
Segment Item 2025 (USD Billion) 2035 (USD Billion) CAGR
System OEM $10.0 USD Billion $40.0 USD Billion 27.0%
ODM and EMS $17.1 USD Billion $51.1 USD Billion 25.0%
Semiconductor and Accelerator Vendor $24.2 USD Billion $62.2 USD Billion 15.0%
Memory Module Assembler $31.3 USD Billion $73.3 USD Billion 25.0%
Authorized Distributor $38.4 USD Billion $84.4 USD Billion 22.0%

Segment-wise data is locked

Unlock complete segment-wise numbers for By Immediate Contracting Counterparty.

Unlock Full Data
2025 (USD Billion)
2035 (USD Billion)
Direct Sales
Distributor
Representati
Segment Item 2025 (USD Billion) 2035 (USD Billion) CAGR
Direct Sales $10.0 USD Billion $40.0 USD Billion 24.0%
Distributor Sales $17.1 USD Billion $51.1 USD Billion 10.0%
Representative-Led Sales $24.2 USD Billion $62.2 USD Billion 8.0%

Segment-wise data is locked

Unlock complete segment-wise numbers for By Sales Channel.

Unlock Full Data
2025 (USD Billion)
2035 (USD Billion)
Server and D
Personal Com
Mobile Devic
Graphics and
Gaming Conso
Segment Item 2025 (USD Billion) 2035 (USD Billion) CAGR
Server and Data Center Systems $10.0 USD Billion $40.0 USD Billion 26.0%
Personal Computing Systems $17.1 USD Billion $51.1 USD Billion 16.0%
Mobile Devices $24.2 USD Billion $62.2 USD Billion 18.0%
Graphics and Accelerator Hardware $31.3 USD Billion $73.3 USD Billion 8.0%
Gaming Consoles $38.4 USD Billion $84.4 USD Billion 23.0%

Segment-wise data is locked

Unlock complete segment-wise numbers for By End-User.

Unlock Full Data

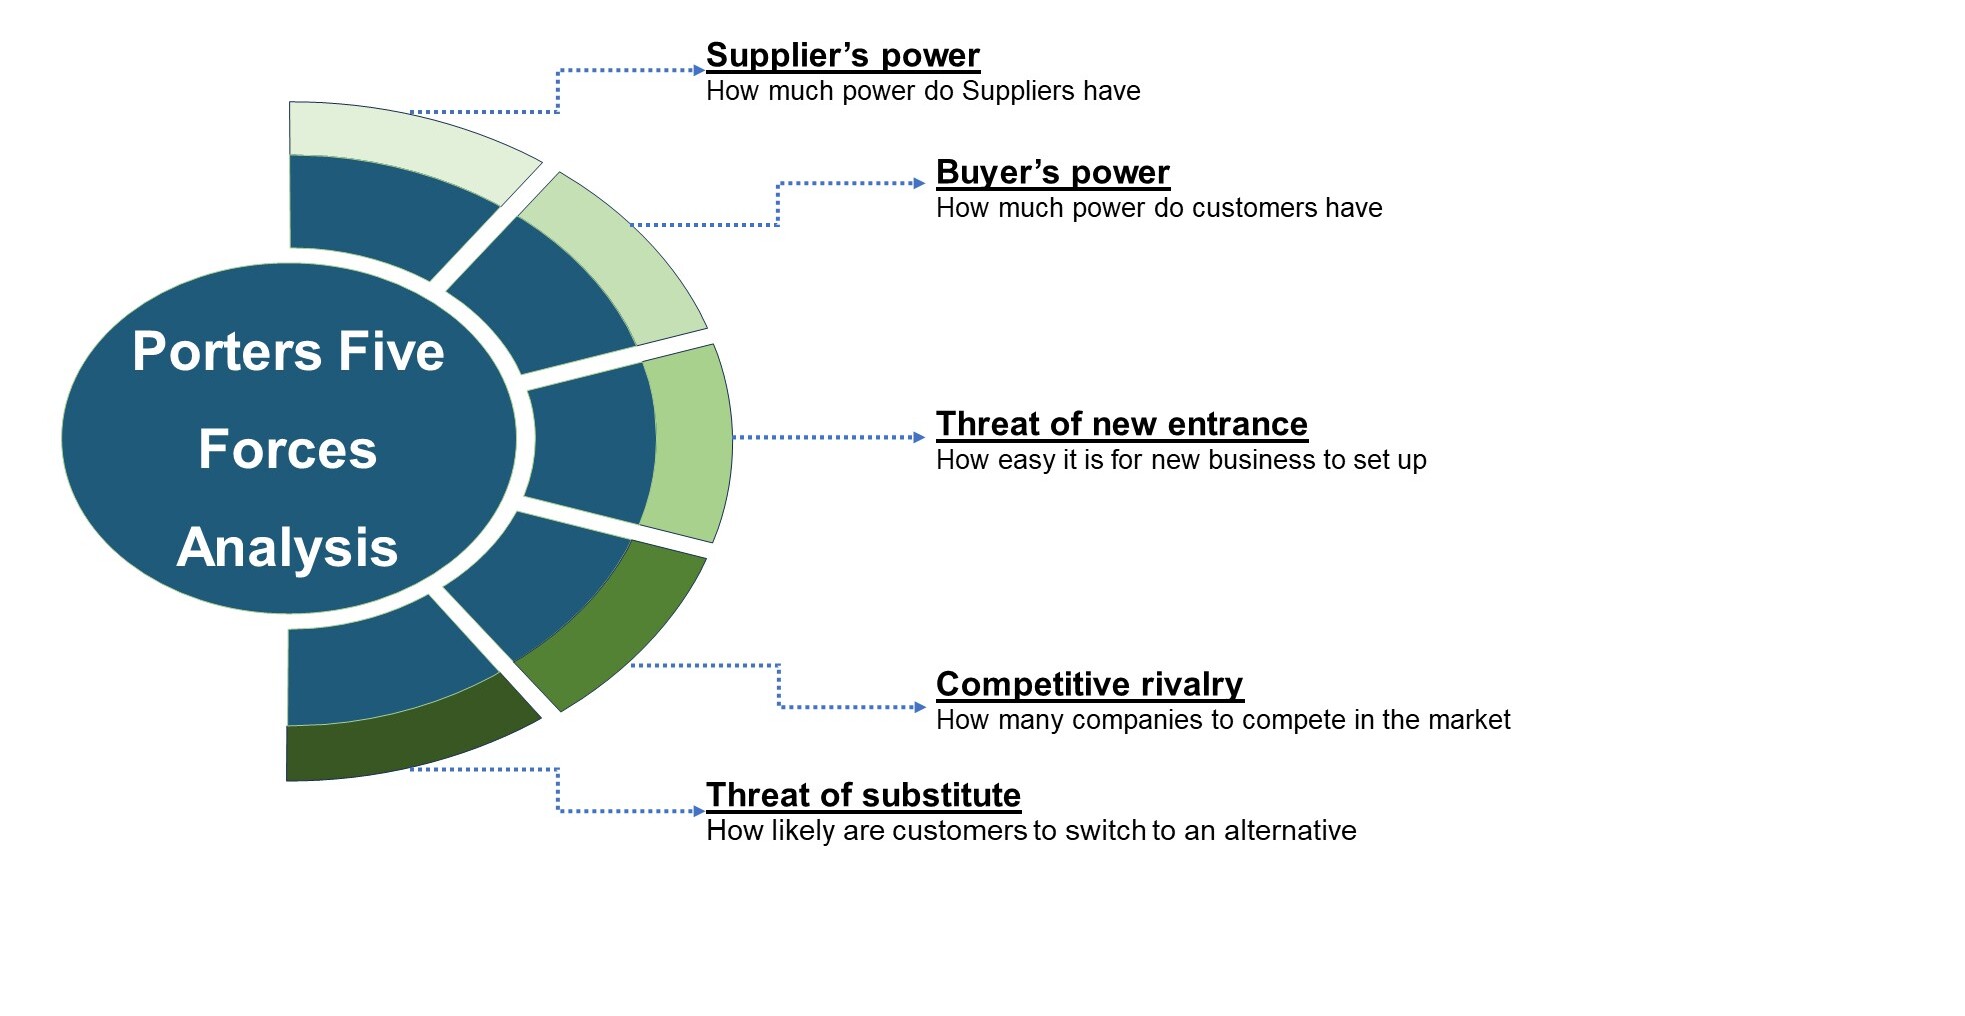
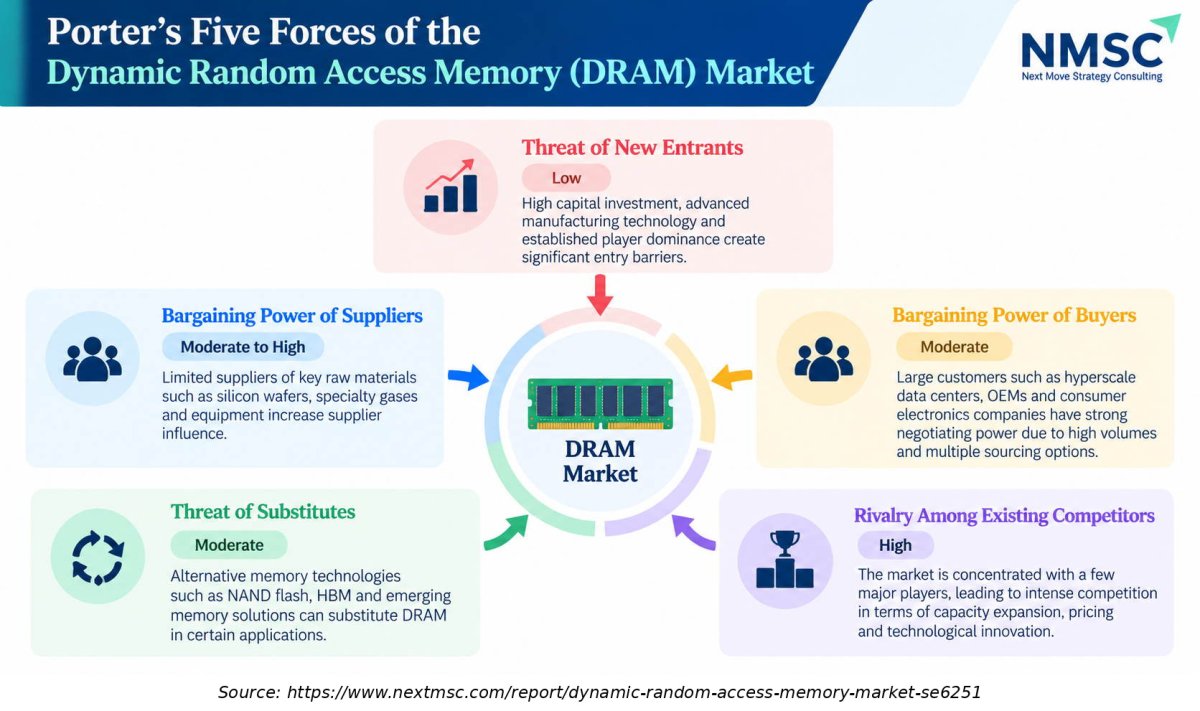
Porter’s Five Forces of the Dynamic Random Access Memory (DRAM) Market

The Dynamic Random Access Memory (DRAM) market faces intense competition among established manufacturers, while high capital requirements and advanced technology limit new entrants. Supplier power is influenced by the availability of specialised materials and equipment, whereas large buyers benefit from high-volume purchases and multiple sourcing options. Alternative memory technologies, including NAND flash and high-bandwidth memory, create substitution pressures in selected applications.

Growth Opportunities

Our analysis shows that three whitespace opportunities are positioned to generate above average revenue for suppliers who invest ahead of buyer demand in each category. Each opportunity rests on a concrete mechanism and a clearly identified beneficiary segment within the supplied segmentation.

Can DDR5 Module Upgrades Capture the Data Center Refresh Cycle?

Operators replacing DDR4 servers move to DDR5 at higher capacity per socket. The mechanism is processor platform transitions that require the newer interface. This benefits DDR5 and newer, which reaches USD 115.35 Billion by 2035, and the System OEM counterparty segment.

Does Automotive and Edge Compute Memory Represent an Untapped Volume Opportunity?

Vehicles with centralized compute and driver assistance need more LPDDR and GDDR with strict reliability qualification. The mechanism is multi year design wins that lock in supply for production programs. Automotive Systems grows at 15.33% CAGR, benefiting suppliers with automotive grade portfolios and the Industrial and Embedded Systems segment.

Can 32 Gb Dies Unlock Higher Stack Capacity for Accelerators?

Higher density dies allow taller stacks and larger module capacities within the same footprint. The mechanism is process shrinks that raise bits per wafer. The Above 32 Gb band grows at 22.87% CAGR, benefiting High Bandwidth Memory suppliers and the Graphics and Accelerator Hardware segment.

Regional Outlook

2025 (USD Billion)
2035 (USD Billion)
North Americ
Europe
Asia-Pacific
Middle East
Latin Americ
Region 2025 (USD Billion) 2035 (USD Billion) CAGR (%)
North America $10.0 USD Billion $40.0 USD Billion 9.0%
Europe $17.1 USD Billion $51.1 USD Billion 27.0%
Asia-Pacific $24.2 USD Billion $62.2 USD Billion 25.0%
Middle East & Africa $31.3 USD Billion $73.3 USD Billion 23.0%
Latin America $38.4 USD Billion $84.4 USD Billion 12.0%

Regional data is locked

Unlock complete regional numbers for this market.

Unlock Full Data

Competitive Landscape

We observed that competition in this industry is shaped by scale in wafer capacity, leadership in process technology and the ability to qualify High Bandwidth Memory with accelerator vendors. The table below summarizes the structure, innovation focus and consolidation pattern, and the questions that follow explain how suppliers compete and differentiate.

Dimension Description
Market Structure Concentrated, with three integrated suppliers holding more than 80% of revenue (industry derived estimate) and a second tier of regional and specialty suppliers.
Innovation Focus HBM4 and stacked products, sixth generation 10 nanometer class processes, LPDDR6 and higher density DDR5 modules.
M&A Activity Limited by antitrust and national security reviews, so portfolio exits, greenfield fabs and long term supply agreements dominate.

How Do Companies Compete in the DRAM Industry?

Suppliers compete on cost per bit, product timing and qualification at the largest buyers. Samsung Electronics, SK hynix and Micron Technology hold the largest wafer capacity and the broadest portfolios, while Nanya Technology, Winbond Electronics and Etron Technology focus on specialty and legacy products. Pricing is negotiated quarterly for standard parts and under long term agreements for High Bandwidth Memory, which rewards suppliers able to commit capacity early.

Which Supplier Archetypes Dominate the Dynamic Random Access Memory (DRAM) Market?

Three archetypes stand out. Integrated leaders combine advanced wafer technology with stacking and packaging scale. Regional champions such as ChangXin Memory Technologies and Fujian Jinhua Integrated Circuit pursue domestic supply security and local customers. Specialty and fabless suppliers, including GigaDevice, Shanghai Dosilicon, AP Memory, Alliance Memory and Zentel, differentiate through niche density, low power and longevity commitments for industrial and embedded buyers.

What Innovation and Differentiation Strategies Matter Most?

Differentiation now centers on stack height, base die logic, speed per pin and power efficiency. Samsung reported commercial HBM4 shipments at 11.7 Gbps, and SK hynix described adopting its fifth generation 10 nanometer class process for HBM4. Our findings suggest that suppliers able to pair advanced nodes with reliable packaging yields will secure the multi year contracts that anchor premium revenue.

How Active Is M&A in the DRAM Industry?

Consolidation is constrained because regulators scrutinize memory transactions closely, so suppliers expand through greenfield capacity and selective portfolio moves. Micron's exit from the Crucial consumer business in December 2025 is a recent example of portfolio focus, and its New York fab shows capacity added through construction. Geographic expansion follows public funding, with new sites in the U.S., Korea and Japan and rising investment in China.

Key Market Players

NMSC's analysis indicates that the competitive set below spans integrated leaders, regional champions and specialty suppliers, ranked in the order used throughout this assessment for company profiling.

Samsung Electronics Co., Ltd. SK hynix Inc. Micron Technology, Inc. ChangXin Memory Technologies, Inc. (CXMT) Nanya Technology Corporation Winbond Electronics Corporation Powerchip Semiconductor Manufacturing Corp. (PSMC) GigaDevice Semiconductor Inc. Elite Semiconductor Microelectronics Technology Inc. (ESMT) Etron Technology, Inc. Integrated Silicon Solution Inc. (ISSI) Alliance Memory, Inc. Zentel Electronics Corp. Shanghai Dosilicon Co., Ltd. AP Memory Technology Corporation AMIC Technology Corporation Fujian Jinhua Integrated Circuit Co., Ltd. (JHICC) Chiplus Semiconductor Corp. Utron Technology Inc. JSC Mikron

Latest Developments

Our findings suggest that recent announcements concentrate on next generation High Bandwidth Memory, new interface standards, portfolio refocusing and fab construction, all of which point toward the AI driven reallocation of capacity.

Date Event
December 2025 Winbond introduced an 8Gb DDR4 DRAM manufactured using its in-house 16nm process. The product targets televisions, servers, networking equipment, industrial PCs, and embedded applications, offering improved power efficiency, die size, and wafer productivity while supporting customers that continue to require DDR4 memory

Investment Opportunities

Where Is Capital Flowing in the Dynamic Random Access Memory (DRAM) Market?

Capital is flowing toward High Bandwidth Memory capacity, advanced packaging and leading edge fabs. We observed that suppliers are redirecting spending from consumer products to data center products, as Micron's consumer exit shows, and that public funding programs reduce the cost of new sites. Investors should weigh premium margins on stacked products against the cyclical exposure created by rising industry capital spending.

How Is Infrastructure Investment Reshaping Dynamic Random Access Memory (DRAM) Market Capacity?

New fabs, packaging lines and cleanroom space are the main infrastructure categories. Micron's New York site is planned for up to four fabs, and the 10 K filing states that federal direct funding of up to USD 6.1 Billion supports planned fabs in Idaho and New York. Our estimates suggest that these projects expand supply mainly after the middle of the forecast period, which shapes pricing and investment timing.

What ESG Considerations Matter for Dynamic Random Access Memory (DRAM) Market Investors?

Fabs consume large volumes of electricity, ultra pure water and process chemicals, so energy sourcing, water recycling and chemical safety are central ESG issues. Customers increasingly ask suppliers for emissions data, and regulators in several regions tighten reporting rules. Industry derived estimates indicate that memory suppliers able to document lower energy per bit gain an advantage with hyperscale buyers that hold public climate targets.

Key Benefits for Stakeholders

How Does This Report Help Enterprise and Industry Leaders?

Enterprise buyers and industry leaders gain a segment level forecast of memory demand through 2035, including architecture transitions from DDR4 to DDR5 and from HBM3E to HBM4. The analysis helps procurement teams time contracts, qualify second sources and plan capacity commitments. It also quantifies how server and data center demand, at 11.53% CAGR, will compete with other uses for limited supply.

What Value Does the Report Offer Investors and Financial Analysts?

Investors receive reconciled 2025, 2026 and 2035 values for every segment and region, with CAGR calculated from 2026. The report identifies where growth is concentrated, such as High Bandwidth Memory at 15.92% and Above 32 Gb dies at 22.87%, and where cyclical risk sits. It also supports valuation work on suppliers, module assemblers and distributors, including supply chain management risks in allocation periods.

How Does the Report Support Technology Vendors and Product Teams?

Memory suppliers, module makers, accelerator vendors and system designers can use the forecast to align roadmaps with adoption timing for LPDDR6, GDDR7 and HBM4. The competitive assessment identifies supplier archetypes and differentiation themes, while the regional and country analysis highlights where qualification and local assembly create openings. Product teams can also compare density and interface trends when planning platform specifications.

Key Market Segments Evaluated

By Product Architecture

  • DDR SDRAM 
    • DDR5 and newer
    • DDR4
    • DDR3 and earlier
  • LPDDR SDRAM 
    • LPDDR6 and newer
    • LPDDR5 and LPDDR5X
    • LPDDR4 and earlier
  • GDDR SDRAM 
    • GDDR7 and newer
    • GDDR6 and GDDR6X
    • GDDR5 and earlier
  • High Bandwidth Memory 
    • HBM4 and newer
    • HBM3 and HBM3E
    • HBM2E and earlier
  • Other DRAM Interfaces 
    • Single Data Rate SDRAM
    • RLDRAM
    • Other Legacy and Proprietary DRAM

By Die Density

  • Up to 4 Gb
  • Above 4.1 Gb to 8 Gb
  • Above 8.1 Gb to 16 Gb
  • Above 16.1 Gb to 32 Gb
  • Above 32 Gb

By Immediate Contracting Counterparty

  • System OEM
  • ODM and EMS
  • Semiconductor and Accelerator Vendor
  • Memory Module Assembler
  • Authorized Distributor
  • Other Commercial Buyer

By Sales Channel

  • Direct Sales
  • Distributor Sales
  • Representative-Led Sales

By End-User

  • Server and Data Center Systems
  • Personal Computing Systems
  • Mobile Devices
  • Graphics and Accelerator Hardware
  • Gaming Consoles
  • Automotive Systems
  • Consumer Electronics
  • Networking and Communications Systems
  • Industrial and Embedded Systems
  • Healthcare Systems

By Region

  • North America 
    • U.S.
    • Canada
    • Mexico.
  • Europe 
    • UK
    • Germany
    • France
    • Italy
    • Spain
    • Sweden
    • Denmark
    • Finland
    • Netherlands
    • Rest of Europe.
  • Asia-Pacific 
    • China
    • India
    • Japan
    • South Korea
    • Taiwan
    • Indonesia
    • Vietnam
    • Australia
    • Philippines
    • Malaysia
    • Rest of APAC.
  • Middle East & Africa 
    • Saudi Arabia
    • UAE
    • Egypt
    • Israel
    • Turkey
    • Nigeria
    • South Africa
    • Rest of MEA.
  • Latin America 
    • Brazil
    • Argentina
    • Chile
    • Colombia
    • Rest of LATAM.

Conclusion & Recommendations

The market is forecast to grow from USD 184.13 Billion in 2026 to USD 434.97 Billion by 2035, with revenue mix shifting toward stacked, low power and high density products. NMSC's analysis indicates that growth stays above the long run semiconductor average because memory content per AI system keeps rising. The outlook depends on accelerator deployment, successful HBM4 ramps and disciplined capacity additions.

What Strategic Positioning Recommendations Does NMSC Offer?

Suppliers should prioritize High Bandwidth Memory qualification, DDR5 server portfolios and LPDDR6 readiness, while keeping legacy lines for industrial and automotive customers. Buyers should secure multi year allocations and qualify more than one source. Our assessment indicates that module assemblers and distributors should build value through inventory services and technical support, since direct contracting is expanding for the largest accounts.

How Attractive Is the Dynamic Random Access Memory (DRAM) Market for Investment?

Attractiveness is high for exposure to High Bandwidth Memory, high density dies and server memory, which grow faster than the market average of 10.02%. It is more moderate for commodity and legacy segments, which face price pressure and declining volumes. Investors should favor suppliers with scale, packaging capability and long term contracts, and should watch capital spending levels for early signs of oversupply.

What Are the Key Market Shifts and Risks in the Dynamic Random Access Memory (DRAM) Market?

Key shifts include the move from DDR4 to DDR5, the rise of HBM4 and the spread of on device AI. The main risks are cyclical oversupply as new fabs open, export control changes, customer concentration among AI accelerator buyers and construction delays. We found that these risks cluster after 2028, when announced capacity additions are expected to reach volume.

What Are the Primary Growth Pathways Through 2035?

Growth pathways include server and accelerator memory, mobile and edge AI devices, automotive compute and emerging regional demand in India, the Middle East and Latin America. Our findings suggest that the Semiconductor and Accelerator Vendor counterparty, at 13.94% CAGR, and Automotive Systems, at 15.33%, offer the most distinct paths beyond the core data center market.

FAQs

Sources & References

1.

Samsung Electronics Newsroom: HBM4 mass production and shipment (Feb 12, 2026)

news.samsung.com
2.

JEDEC Solid State Technology Association: LPDDR6 JESD209-6 release (Jul 9, 2025)

jedec.org/node/9557
3.

Micron Technology Investor Relations: Exit from Crucial consumer business (Dec 3, 2025)

investors.micron.com
4.

Micron Technology Form 10 K for fiscal 2026 (U.S. SEC)

sec.gov
5.

Micron Technology Form 8 K, fiscal Q4 and full year 2026 results (U.S. SEC)

sec.gov
6.

SK hynix Newsroom: 2Q26 financial results (Jul 29, 2026)

news.skhynix.com
7.

SK hynix press release: HBM4 development completed (Sep 2025)

prnewswire.com

About the Author

Liza Phukan

Liza Phukan

Liza Phukan is Research Associate at Next Move Strategy Consulting, where she has covered emerging industries and market research across sectors for 3.5 years. Her work includes analyzing industry developments, validating market data, and developing structured business content from research findings. She uses secondary research and data-validation practices to turn complex market information into clear decision-useful market analysis for business audiences and support report development and B2B.

About the Reviewer

Supradip Baul

Supradip Baul

Supradip Baul is an accomplished business consultant and strategist with over a decade of rich experience in market intelligence, strategy, technology, and business transformation. His work has included rigorous qualitative and quantitative analysis across multiple industries, helping clients shape investment decisions and long-term roadmaps. Earlier in his career, he was associated with Gartner, where he contributed to industry-leading reports and market share analyses. He has worked with leading global companies and holds an MBA with a dual specialization in Marketing and Finance.

Download Free Sample

Kishu Kanda

KISHU KANDA

Strategy Analyst

Accenture

We purchased the AI Consumer Market Report from this company. Not only did they customize the report to meet our specific requirements, but they also showed great flexibility in accommodating our budget. The report we received fully met our expectations. Additionally, they provided prompt and thorough responses to both our pre-purchase and follow-up questions. We look forward to working with this company again in the future.

Rishabh Jogani

RISHABH JOGANI

Strategy Analyst

Accenture Japan

We are incredibly impressed with the market report on the real estate market in India provided by Next Move Strategy Consulting. The report was thorough, insightful, and well-structured, offering deep analysis and actionable recommendations. It not only captured the current trends and dynamics but also provided a forward-looking perspective that has been invaluable for our strategic planning. Their team demonstrated exceptional professionalism, attention to detail, and a profound understanding of the industry. The data-driven insights and clarity of presentation exceeded our expectations, making complex market trends easy to understand. We highly recommend Next Move Strategy Consulting to anyone looking for reliable and comprehensive market research services. Their expertise has given us the confidence to navigate the complexities of the Indian real estate market with clarity and foresight.

Robert Sean Trevino

ROBERT SEAN TREVINO

Sr. Director, Head of Strategic Insights & Analytics

Foundation Medicine

I realized that it was a reliable source of information. These days, there are many people who are looking for authentic data, and this is one of the only sources that can offer them with what they need;

Gaurav Jaiswal

GAURAV JAISWAL

Founder & CEO

Yano Charge Private Limited

The EV Charging market research report provided by the NextMSC was exceptionally detailed and insightful. It offered a comprehensive analysis that proved to be a game-changer for our strategic planning. Truly a testament to the NextMSC’s expertise and thoroughness in EV market landscape & analysis.

Henri Knyphausen

HENRI KNYPHAUSEN

Partner at Singulier [Ex-BCG]

Singulier

I recently engaged NEXTMSC.com for a commercial due diligence project within the intralogistics sector, and I am pleased to provide a reference based on my experience. In utilizing NEXTMSC.com's services, I found their report to offer valuable insights into market dynamics and key industry players. The initial report provided a solid foundation for our analysis. However, as we were investigating a smaller target in the market, and I had specific customization requests requiring additional research. These requests included detailed information on product portfolios of various players and sub-market sizes, both inclusive and exclusive of certain product categories. NEXTMSC.com demonstrated commendable responsiveness and agility in accommodating these customization requests. Within a timeframe of 1-2 weeks, they delivered a revised report that met our specific needs. Furthermore, they were receptive to my follow-up inquiries, ensuring clarity and understanding of the data provided. The final deliverable significantly contributed to our due diligence efforts. One of NEXTMSC.com's notable strengths lies in their qualitative research capabilities. However, for future engagements, I would recommend the inclusion of a quantified market model in Excel format. Such a model would offer the ability to conduct in-depth analyses and explore various market segments, including country-specific data and subcomponent breakdowns. Based on my positive experience, I would not hesitate to work with NEXTMSC.com again. Their responsiveness, willingness to accommodate customization requests, and commitment to delivering actionable insights make them a reliable partner for commercial research projects.

Custom Market Research Services

We will customize the research for you if the listed report does not fully match your requirements.

Get 30% Free Customization

Select License

This website uses cookies to ensure you get the best experience on our website. Learn more

✖