ERP Software Market by Component (Software and Service), by Deployment (On-premise, Cloud, and Hybrid), by Business Function (Finance, Human Resource (HR), Supply Chain, Customer Management, inventory Management, Manufacturing Module, and Others), by Industry Vertical (Manufacturing, BFSI, Healthcare, Retail & Distribution, Government & Utilities, IT & Telecom, Construction, Aerospace and Defense, and Others), by End User (Large Enterprises, Medium Enterprises, and Small Enterprises) - Global Opportunity Analysis and Industry Forecast, 2020 – 2030

ERP Software Market

Industry:  ICT & Media | Publish Date: Feb 2021 | No of Pages:  480 | No. Tables:  281 | No. Figures:  241

Market Definition

The global ERP Software Market size was valued at USD 37.53 billion in 2019 and is predicted to reach USD 68.34 billion by 2030 with a CAGR of 5.6% from 2020-2030.

Enterprise Resource Planning (ERP) software integrates and automates the entire business ecosystem, by providing quality business management, enhanced traceability, increased production capacity, and greater tax support.

ERP software proficiently handles Human Resource (HR) management, inventory management, customer management, product planning, manufacturing, sales, and marketing. ERP software assists in monitoring the entire supply chain from a single user interface, with reduced errors and higher operational efficiency.

Market Dynamics and Trends:

The global market is proliferating due to growing demand from manufacturing industry, small & medium scale enterprises, and corporate sector. Moreover, increasing demand for Human Resource module, is projected to create ample opportunities for the ERP software market growth.

Furthermore, factors such as increasing penetration of AI, API, IoT, automation, and robotics technologies, growing preferences to digitize entire business ecosystem, and upsurge in cloud computing, are anticipated to supplement the growth of market in coming future.

However, availability of open source applications and high maintenance cost are expected to negatively impact the growth of market. Moreover, emergence of large enterprises and proliferating BFSI sector raises the demand for efficient ERP solutions, thereby propelling the growth of ERP software market throughout the forecast period.


Market Segmentations and Scope of the Study

The global ERP software market report has been analyzed based on component, deployment, business function, industry vertical, end user and geography. Based on component type, the market is divided into software and service based. Based on deployment, the market is fragmented into cloud, hybrid, and on-premise. Based on business function, the market is segmented into finance, Human Resource (HR), supply chain, customer management, inventory management, manufacturing module, and others.

Based on industry vertical, the global market is bifurcated into manufacturing, retail & distribution, BFSI, healthcare, government & utilities, IT & telecom, aerospace & defense, construction, and others. Based on end user, the market is divided into large enterprises, medium enterprises, and small enterprises. Geographic breakdown and analysis of each of the previously mentioned segments include regions comprising North America, Europe, Asia-Pacific, and RoW.


Geographical Analysis

North America dominated the global ERP software market in the past and is expected to maintain this trend throughout the forecast period, owing to presence of ERP software traders in large numbers. Moreover, factors such as higher adoption of cloud computing for business orientation, higher economic standards, and increased penetration of new markets, are projected to propel the growth of the market throughout the forecast period.

Asia Pacific is expected to witness a substantial market growth accounting for the highest CAGR values in the global ERP software market, throughout the forecast period. This is attributed to presence of emerging economies especially India and China, evolution of small business enterprises, and growing awareness regarding the benefits offered by ERP software in managing the overall business ecosystem.


Competitive Landscape

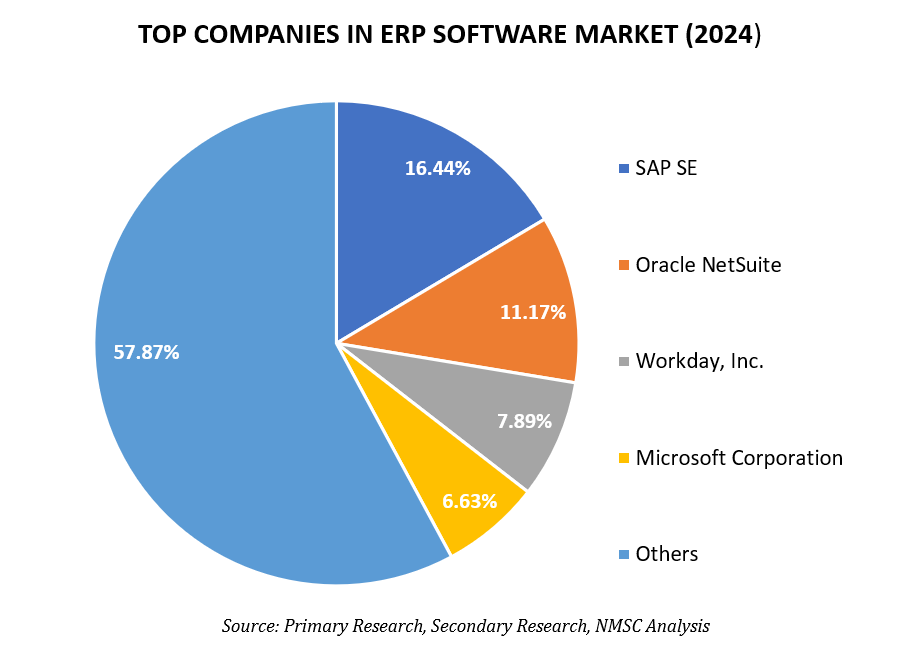
The ERP software industry is highly competitive and consists of various market players. Some of the major market players include Oracle Corporation, SAP SE, Sage Software Solutions Pvt. Ltd., Infor, Workday, Inc., Epicor Software Corporation, Microsoft Corporation, SYSPRO, Deskera, and IFS among others. The key players are employing strategies such as product launches, technical collaboration, and acquisition in-order to gain stronger position in the market.

For instance, in September 2019, Oracle Corporation, one of the major players in the global market, announced the availability of Oracle Analytics, a Fusion ERP product. This is the first-ever application umbrella service, delivered under Oracle Analytics Cloud, that consolidates more than 18 Oracle BI and analytics products under a single brand value.

In April 2020, SYSPRO, the pioneer in industrial-built ERP software, announced its latest ERP product with enhanced features, that enables the manufacturers and distributors to securely integrate and automate the entire business ecosystem.

In June 2020, Infor, a leading business cloud software specialized industry in the ERP software market, announced that De Menken Keuken has chosen the Infor M3 ERP solution, to enhance its operational efficacy, assist in providing business continuity, and support its business growth. Along with this, Infor M3 ERP solution promises to enhance the quality management, increase tracing capabilities, and ensure quality business management of the entire manufacturing, warehousing, distribution, and supply chain.

Key Benefits

  • The ERP software market report provides the quantitative analysis of the current market and estimations through 2020-2030 that assists in identifying the prevailing market opportunities to capitalize on.

  • The study comprises a deep dive analysis of the ERP software market including the current and future trends for depicting the prevalent investment pockets in the market.

  • The report provides detailed information related to key drivers, restraints, opportunities, and their impact on the market.

  • The report incorporates competitive analysis of the market players along with their market share in the global market.

  • The SWOT analysis and Porters Five Forces model is elaborated in the study of the market.

  • Value chain analysis in the global market study provides a clear picture of the stakeholders’ roles.

ERP Software Market Key Segments

By Component

  • Software

  • Service

By Deployment

  • On-premise

  • Hybrid

  • Cloud

By Business Function

  • Finance

  • Human Resource (HR)

  • Supply Chain

  • Customer Management

  • Inventory Management

  • Manufacturing Module

  • Others

By Industry Vertical

  • Manufacturing

  • BFSI

  • Healthcare

  • Retail & Distribution

  • Government & Utilities

  • IT & Telecom

  • Construction

  • Aerospace and Defense

  • Others

By End User

  • Large Enterprises

  • Medium Enterprises

  • Small Enterprises

By Geography

  • North America

    • U.S.

    • Canada

  • Europe

    • UK

    • Germany

    • France

    • Italy

    • Spain

    • Rest of Europe

  • Asia-Pacific

    • China

    • India

    • Japan

    • Australia

    • South Korea

    • Rest of Asia-Pacific

  • RoW

    • Latin America

    • Middle East

    • Africa

Report Scope and Segmentation

Parameters

Details

Analysis Period

2019–2030

Base Year Considered

2020

Forecast Period

2020–2030

Market Size Estimation

Billion (USD)

Market Segmentation

By Component (Software, Service) By Deployment Model (On-premise, Cloud, Hybrid) By Business Function (Finance, Human Resource (HR), Supply Chain, Customer Management, Inventory Management, Manufacturing Module, Other Business Function) By End User (Large Enterprises, Medium Enterprises, Small Enterprises) By Industry Vertical (Manufacturing, BFSI, Healthcare, Retail & Distribution, Government & Utilities, IT & Telecom, Construction, Aerospace & Defense)

Geographical Segmentation

North America (U.S., Canada) Europe (UK, Germany, Italy, France, Spain, Rest of Europe), Asia-Pacific (China, Japan, India, Australia, South Korea, Rest of APAC), Rest of the World (Latin America, Middle East, Africa)

Companies Profiled

Oracle Corporation, SAP SE, Sage Software Solutions Pvt. Ltd., Infor, Workday, Inc., Epicor Software Corporation, Microsoft Corporation, SYSPRO, Deskera, and IFS.

column chart pie chart

Test

1.  INTRODUCTION

1.1.           REPORT DESCRIPTION

1.2.           Research Methodology

1.2.1               Secondary Research

1.2.2               Data Analysis Framework

1.2.3               Market size estimation

1.2.4               Forecasting

1.2.5               Primary Research and Data Validation

2.   MARKET SNAPSHOT, 2019-2030 Million USD

2.1.           MARKET SNAPSHOT

3.   PORTER’S FIVE FORCE MODEL ANALYSIS

4.   Market Share ANALYSIS

4.1.           Market share analysis of top 10 ERP providers, 2019

5.   MARKET DYNAMICS

5.1.           GROWTH DRIVERS

5.1.1               DRIVER 1

5.1.2               DRIVER 2

5.1.3               DRIVER 3

5.1.4               DRIVER 4

5.2.           CHALLENGES

5.2.1               CHALLENGE 1

5.2.2               CHALLENGE 2

5.3.           OPPORTUNITIES

5.3.1               OPPORTUNITY 1

5.3.2               OPPORTUNITY 2

6.  Global  ERP Software Market, By Component

6.1.           Overview

6.2.           Software

6.2.1               Software market, By Region

6.2.1.1          North America Software market, By Country

6.2.1.2          Europe Software market, By Country

6.2.1.3          Asia-Pacific Software market, By Country

6.2.1.4          Rest of World Software market, By Country

6.3.           Service

6.3.1               Service Market, By Region

6.3.1.1          North America Service Market, By Country

6.3.1.2          Europe Service Market, By Country

6.3.1.3          Asia-Pacific Service Market, By Country

6.3.1.4          Rest of World Service Market, By Country

7.   Global  ERP Software Market, By Deployment Model

7.1.           Overview

7.2.           On-premise

7.2.1               On-premise Market, By Region

7.2.1.1          North America On-premise Market, By Country

7.2.1.2          Europe On-premise Market, By Country

7.2.1.3          Asia-Pacific On-premise Market, By Country

7.2.1.4          Rest of World On-premise Market, By Country

7.3.           Cloud

7.3.1               Cloud Market, By Region

7.3.1.1          North America Cloud Market, By Country

7.3.1.2          Europe Cloud Market, By Country

7.3.1.3          Asia-Pacific Cloud Market, By Country

7.3.1.4          Rest of World Cloud Market, By Country

7.4.           Hybrid

7.4.1               Hybrid Market, By Region

7.4.1.1          North America Hybrid Market, By Country

7.4.1.2          Europe Hybrid Market, By Country

7.4.1.3          Asia-Pacific Hybrid Market, By Country

7.4.1.4          Rest of World Hybrid Market, By Country

8.   Global  ERP Software Market, By Business Function

8.1.           Overview

8.2.           Finance

8.2.1               Finance Market, By Region

8.2.1.1          North America Finance Market, By Country

8.2.1.2          Europe Finance Market, By Country

8.2.1.3          Asia-Pacific Finance Market, By Country

8.2.1.4          Rest of World Finance Market, By Country

8.3.           Human Resource (HR)

8.3.1               Human Resource (HR) Market, By Region

8.3.1.1          North America Human Resource (HR) Market, By Country

8.3.1.2          Europe Human Resource (HR) Market, By Country

8.3.1.3          Asia-Pacific Human Resource (HR) Market, By Country

8.3.1.4          Rest of World Human Resource (HR) Market, By Country

8.4.           Supply Chain

8.4.1               Supply Chain Market, By Region

8.4.1.1          North America Supply Chain Market, By Country

8.4.1.2          Europe Supply Chain Market, By Country

8.4.1.3          Asia-Pacific Supply Chain Market, By Country

8.4.1.4          Rest of World Supply Chain Market, By Country

8.5.           Customer Management

8.5.1               Customer Management Market, By Region

8.5.1.1          North America Customer Management Market, By Country

8.5.1.2          Europe Customer Management Market, By Country

8.5.1.3          Asia-Pacific Customer Management Market, By Country

8.5.1.4          Rest of World Customer Management Market, By Country

8.6.           Inventory Management

8.6.1               Inventory Management Market, By Region

8.6.1.1          North America Inventory Management Market, By Country

8.6.1.2          Europe Inventory Management Market, By Country

8.6.1.3          Asia-Pacific Inventory Management Market, By Country

8.6.1.4          Rest of World Inventory Management Market, By Country

8.7.           Manufacturing Module

8.7.1               Manufacturing Module Market, By Region

8.7.1.1          North America Manufacturing Module Market, By Country

8.7.1.2          Europe Manufacturing Module Market, By Country

8.7.1.3          Asia-Pacific Manufacturing Module Market, By Country

8.7.1.4          Rest of World Manufacturing Module Market, By Country

8.8.           Other Business Function

8.8.1               Other Business Function Market, By Region

8.8.1.1          North America Other Business Function Market, By Country

8.8.1.2          Europe Other Business Function Market, By Country

8.8.1.3          Asia-Pacific Other Business Function Market, By Country

8.8.1.4          Rest of World Other Business Function Market, By Country

9.   Global  ERP Software Market, By End User

9.1.           Overview

9.2.           Large Enterprises

9.2.1               Large Enterprises Market, By Region

9.2.1.1          North America Large Enterprises Market, By Country

9.2.1.2          Europe Large Enterprises Market, By Country

9.2.1.3          Asia-Pacific Large Enterprises Market, By Country

9.2.1.4          Rest of World Large Enterprises Market, By Country

9.3.           Medium Enterprises

9.3.1               Medium Enterprises Market, By Region

9.3.1.1          North America Medium Enterprises Market, By Country

9.3.1.2          Europe Medium Enterprises Market, By Country

9.3.1.3          Asia-Pacific Medium Enterprises Market, By Country

9.3.1.4          Rest of World Medium Enterprises Market, By Country

9.4.           Small Enterprises

9.4.1               Small Enterprises Market, By Region

9.4.1.1          North America Small Enterprises Market, By Country

9.4.1.2          Europe Small Enterprises Market, By Country

9.4.1.3          Asia-Pacific Small Enterprises Market, By Country

9.4.1.4          Rest of World Small Enterprises Market, By Country

10. Global  ERP Software Market, By Industry Vertical

10.1.         Overview

10.2.         Manufacturing

10.2.1             Manufacturing Market, By Region

10.2.1.1       North America Manufacturing Market, By Country

10.2.1.2       Europe Manufacturing Market, By Country

10.2.1.3       Asia-Pacific Manufacturing Market, By Country

10.2.1.4       Rest of World Manufacturing Market, By Country

10.3.         BFSI

10.3.1             BFSI Market, By Region

10.3.1.1       North America BFSI Market, By Country

10.3.1.2       Europe BFSI Market, By Country

10.3.1.3       Asia-Pacific BFSI Market, By Country

10.3.1.4       Rest of World BFSI Market, By Country

10.4.         Healthcare

10.4.1             Healthcare Market, By Region

10.4.1.1       North America Healthcare Market, By Country

10.4.1.2       Europe Healthcare Market, By Country

10.4.1.3       Asia-Pacific Healthcare Market, By Country

10.4.1.4       Rest of World Healthcare Market, By Country

10.5.         Retail & Distribution

10.5.1             Retail & Distribution Market, By Region

10.5.1.1       North America Retail & Distribution Market, By Country

10.5.1.2       Europe Retail & Distribution Market, By Country

10.5.1.3       Asia-Pacific Retail & Distribution Market, By Country

10.5.1.4       Rest of World Retail & Distribution Market, By Country

10.6.         Government & Utilities

10.6.1             Government & Utilities Market, By Region

10.6.1.1       North America Government & Utilities Market, By Country

10.6.1.2       Europe Government & Utilities Market, By Country

10.6.1.3       Asia-Pacific Government & Utilities Market, By Country

10.6.1.4       Rest of World Government & Utilities Market, By Country

10.7.         IT & Telecom

10.7.1             IT & Telecom Market, By Region

10.7.1.1       North America IT & Telecom Market, By Country

10.7.1.2       Europe IT & Telecom Market, By Country

10.7.1.3       Asia-Pacific IT & Telecom Market, By Country

10.7.1.4       Rest of World IT & Telecom Market, By Country

10.8.         Construction

10.8.1             Construction Market, By Region

10.8.1.1       North America Construction Market, By Country

10.8.1.2       Europe Construction Market, By Country

10.8.1.3       Asia-Pacific Construction Market, By Country

10.8.1.4       Rest of World Construction Market, By Country

10.9.         Aerospace & Defense

10.9.1             Aerospace & Defense Market, By Region

10.9.1.1       North America Aerospace & Defense Market, By Country

10.9.1.2       Europe Aerospace & Defense Market, By Country

10.9.1.3       Asia-Pacific Aerospace & Defense Market, By Country

10.9.1.4       Rest of World Aerospace & Defense Market, By Country

10.9.2             Aerospace & Defense Market, By Region

10.9.2.1       North America Aerospace & Defense Market, By Country

10.9.2.2       Europe Aerospace & Defense Market, By Country

10.9.2.3       Asia-Pacific Aerospace & Defense Market, By Country

10.9.2.4       Rest of World Aerospace & Defense Market, By Country

11.  Global  ERP Software Market, By Region

11.1.         Overview

11.2.         North America

11.2.1             North America ERP Software Market, By Component

11.2.2             North America ERP Software Market, By Deployment Model

11.2.3             North America ERP Software Market, By Business Function

11.2.4             North America ERP Software Market, By End User

11.2.5             North America ERP Software Market, By Industry Vertical

11.2.6             North America ERP Software, Market By Country

11.2.6.1       U.S

11.2.6.1.1        U.S ERP Software Market, By Component

11.2.6.1.2        U.S ERP Software Market, By Deployment Model

11.2.6.1.3        U.S ERP Software Market, By Business Function

11.2.6.1.4        U.S ERP Software Market, By End User

11.2.6.1.5        U.S ERP Software Market, By Industry Vertical

11.2.6.2       Canada

11.2.6.2.1        Canada ERP Software Market, By Component

11.2.6.2.2        Canada ERP Software Market, By Deployment Model

11.2.6.2.3        Canada ERP Software Market, By Business Function

11.2.6.2.4        Canada ERP Software Market, By End User

11.2.6.2.5        Canada ERP Software Market, By Industry Vertical

11.3.         Europe

11.3.1             Europe ERP Software Market, By Component

11.3.2             Europe ERP Software Market, By Deployment Model

11.3.3             Europe ERP Software Market, By Business Function

11.3.4             Europe ERP Software Market, By End User

11.3.5             Europe ERP Software Market, By Industry Vertical

11.3.6             Europe ERP Software, Market By Country

11.3.6.1       UK

11.3.6.1.1        UK ERP Software Market, By Component

11.3.6.1.2        UK ERP Software Market, By Deployment Model

11.3.6.1.3        UK ERP Software Market, By Business Function

11.3.6.1.4        UK ERP Software Market, By End User

11.3.6.1.5        UK ERP Software Market, By Industry Vertical

11.3.6.2       Germany

11.3.6.2.1        Germany ERP Software Market, By Component

11.3.6.2.2        Germany ERP Software Market, By Deployment Model

11.3.6.2.3        Germany ERP Software Market, By Business Function

11.3.6.2.4        Germany ERP Software Market, By End User

11.3.6.2.5        Germany ERP Software Market, By Industry Vertical

11.3.6.3       France

11.3.6.3.1        France ERP Software Market, By Component

11.3.6.3.2        France ERP Software Market, By Deployment Model

11.3.6.3.3        France ERP Software Market, By Business Function

11.3.6.3.4        France ERP Software Market, By End User

11.3.6.3.5        France ERP Software Market, By Industry Vertical

11.3.6.4       Italy

11.3.6.4.1        Italy ERP Software Market, By Component

11.3.6.4.2        Italy ERP Software Market, By Deployment Model

11.3.6.4.3        Italy ERP Software Market, By Business Function

11.3.6.4.4        Italy ERP Software Market, By End User

11.3.6.4.5        Italy ERP Software Market, By Industry Vertical

11.3.6.5       Spain

11.3.6.5.1        Spain ERP Software Market, By Component

11.3.6.5.2        Spain ERP Software Market, By Deployment Model

11.3.6.5.3        Spain ERP Software Market, By Business Function

11.3.6.5.4        Spain ERP Software Market, By End User

11.3.6.5.5        Spain ERP Software Market, By Industry Vertical

11.3.6.6       Rest of Europe

11.3.6.6.1        Rest of Europe ERP Software Market, By Component

11.3.6.6.2        Rest of Europe ERP Software Market, By Deployment Model

11.3.6.6.3        Rest of Europe ERP Software Market, By Business Function

11.3.6.6.4        Rest of Europe ERP Software Market, By End User

11.3.6.6.5        Rest of Europe ERP Software Market, By Industry Vertical

11.4.         Asia-Pacific

11.4.1             Asia-Pacific ERP Software Market, By Component

11.4.2             Asia-Pacific ERP Software Market, By Deployment Model

11.4.3             Asia-Pacific ERP Software Market, By Business Function

11.4.4             Asia-Pacific ERP Software Market, By End User

11.4.5             Asia-Pacific ERP Software Market, By Industry Vertical

11.4.6             Asia-Pacific ERP Software, Market By Country

11.4.6.1       China

11.4.6.1.1        China ERP Software Market, By Component

11.4.6.1.2        China ERP Software Market, By Deployment Model

11.4.6.1.3        China ERP Software Market, By Business Function

11.4.6.1.4        China ERP Software Market, By End User

11.4.6.1.5        China ERP Software Market, By Industry Vertical

11.4.6.2       Japan

11.4.6.2.1        Japan ERP Software Market, By Component

11.4.6.2.2        Japan ERP Software Market, By Deployment Model

11.4.6.2.3        Japan ERP Software Market, By Business Function

11.4.6.2.4        Japan ERP Software Market, By End User

11.4.6.2.5        Japan ERP Software Market, By Industry Vertical

11.4.6.3       India

11.4.6.3.1        India ERP Software Market, By Component

11.4.6.3.2        India ERP Software Market, By Deployment Model

11.4.6.3.3        India ERP Software Market, By Business Function

11.4.6.3.4        India ERP Software Market, By End User

11.4.6.3.5        India ERP Software Market, By Industry Vertical

11.4.6.4       South Korea

11.4.6.4.1        South Korea ERP Software Market, By Component

11.4.6.4.2        South Korea ERP Software Market, By Deployment Model

11.4.6.4.3        South Korea ERP Software Market, By Business Function

11.4.6.4.4        South Korea ERP Software Market, By End User

11.4.6.4.5        South Korea ERP Software Market, By Industry Vertical

11.4.6.5       Australia

11.4.6.5.1        Australia ERP Software Market, By Component

11.4.6.5.2        Australia ERP Software Market, By Deployment Model

11.4.6.5.3        Australia ERP Software Market, By Business Function

11.4.6.5.4        Australia ERP Software Market, By End User

11.4.6.5.5        Australia ERP Software Market, By Industry Vertical

11.4.6.6       Rest of Asia-Pacific

11.4.6.6.1        Rest of Asia-Pacific ERP Software Market, By Component

11.4.6.6.2        Rest of Asia-Pacific ERP Software Market, By Deployment Model

11.4.6.6.3        Rest of Asia-Pacific ERP Software Market, By Business Function

11.4.6.6.4        Rest of Asia-Pacific ERP Software Market, By End User

11.4.6.6.5        Rest of Asia-Pacific ERP Software Market, By Industry Vertical

11.5.         Rest of World

11.5.1             Rest of World ERP Software Market, By Component

11.5.2             Rest of World ERP Software Market, By Deployment Model

11.5.3             Rest of World ERP Software Market, By Business Function

11.5.4             Rest of World ERP Software Market, By End User

11.5.5             Rest of World ERP Software Market, By Industry Vertical

11.5.6             Rest of World ERP Software, Market By Country

11.5.6.1       Latin America

11.5.6.1.1        Latin America ERP Software Market, By Component

11.5.6.1.2        Latin America ERP Software Market, By Deployment Model

11.5.6.1.3        Latin America ERP Software Market, By Business Function

11.5.6.1.4        Latin America ERP Software Market, By End User

11.5.6.1.5        Latin America ERP Software Market, By Industry Vertical

11.5.6.2       Middle East

11.5.6.2.1        Middle East  ERP Software Market, By Component

11.5.6.2.2        Middle East  ERP Software Market, By Deployment Model

11.5.6.2.3        Middle East  ERP Software Market, By Business Function

11.5.6.2.4        Middle East  ERP Software Market, By End User

11.5.6.2.5        Middle East  ERP Software Market, By Industry Vertical

11.5.6.3       Africa

11.5.6.3.1        Africa ERP Software Market, By Component

11.5.6.3.2        Africa ERP Software Market, By Deployment Model

11.5.6.3.3        Africa ERP Software Market, By Business Function

11.5.6.3.4        Africa ERP Software Market, By End User

11.5.6.3.5        Africa ERP Software Market, By Industry Vertical

12.  COMPANY PROFILES

12.1.         Deskera

12.1.1             COMPANY OVERVIEW

12.1.2             COMPANY SNAPSHOT

12.1.3             OPERATING BUSINESS SEGMENTS

12.1.4             PRODUCT PORTFOLIO

12.1.5             BUSINESS PERFORMANCE

12.1.6             Deskera Revenue Breakdown by ERP Subsegments (2017-2020)

12.1.7             KEY STRATEGIC MOVES AND DEVELOPMENT

12.2.         Epicor Software Corporation

12.2.1             COMPANY OVERVIEW

12.2.2             COMPANY SNAPSHOT

12.2.3             OPERATING BUSINESS SEGMENTS

12.2.4             PRODUCT PORTFOLIO

12.2.5             BUSINESS PERFORMANCE

12.2.6             Epicor Revenue Breakdown by ERP Subsegments (2017-2020)

12.2.7             KEY STRATEGIC MOVES AND DEVELOPMENT

12.3.         IFS AB

12.3.1             COMPANY OVERVIEW

12.3.2             COMPANY SNAPSHOT

12.3.3             OPERATING BUSINESS SEGMENTS

12.3.4             PRODUCT PORTFOLIO

12.3.5             BUSINESS PERFORMANCE

12.3.6             IFS Revenue Breakdown by ERP Subsegments (2017-2020)

12.3.7             KEY STRATEGIC MOVES AND DEVELOPMENT

12.4.         Infor

12.4.1             COMPANY OVERVIEW

12.4.2             COMPANY SNAPSHOT

12.4.3             OPERATING BUSINESS SEGMENTS

12.4.4             PRODUCT PORTFOLIO

12.4.5             BUSINESS PERFORMANCE

12.4.6             INFOR Revenue Breakdown by ERP Subsegments (2017-2020)

12.4.7             KEY STRATEGIC MOVES AND DEVELOPMENT

12.5.         Microsoft Corporation

12.5.1             COMPANY OVERVIEW

12.5.2             COMPANY SNAPSHOT

12.5.3             OPERATING BUSINESS SEGMENTS

12.5.4             PRODUCT PORTFOLIO

12.5.5             BUSINESS PERFORMANCE

12.5.6             Microsoft Revenue Breakdown by ERP Subsegments (2017-2020)

12.5.7             KEY STRATEGIC MOVES AND DEVELOPMENT

12.6.         Oracle Corporation

12.6.1             COMPANY OVERVIEW

12.6.2             COMPANY SNAPSHOT

12.6.3             OPERATING BUSINESS SEGMENTS

12.6.4             PRODUCT PORTFOLIO

12.6.5             BUSINESS PERFORMANCE

12.6.6             Oracle Revenue Breakdown by ERP Subsegments (2017-2020)

12.6.7             KEY STRATEGIC MOVES AND DEVELOPMENT

12.7.         Sage Software Solutions Pvt. Ltd.

12.7.1             COMPANY OVERVIEW

12.7.2             COMPANY SNAPSHOT

12.7.3             OPERATING BUSINESS SEGMENTS

12.7.4             PRODUCT PORTFOLIO

12.7.5             BUSINESS PERFORMANCE

12.7.6             Sage Revenue Breakdown by ERP Subsegments (2017-2020)

12.7.7             KEY STRATEGIC MOVES AND DEVELOPMENT

12.8.         SAP SE

12.8.1             COMPANY OVERVIEW

12.8.2             COMPANY SNAPSHOT

12.8.3             OPERATING BUSINESS SEGMENTS

12.8.4             PRODUCT PORTFOLIO

12.8.5             BUSINESS PERFORMANCE

12.8.6             SAP Revenue Breakdown by ERP Subsegments (2017-2020)

12.8.7             KEY STRATEGIC MOVES AND DEVELOPMENT

12.9.         SYSPRO

12.9.1             COMPANY OVERVIEW

12.9.2             COMPANY SNAPSHOT

12.9.3             OPERATING BUSINESS SEGMENTS

12.9.4             PRODUCT PORTFOLIO

12.9.5             BUSINESS PERFORMANCE

12.9.6             Deskera Revenue Breakdown by ERP Subsegments (2017-2020)

12.9.7             KEY STRATEGIC MOVES AND DEVELOPMENT

12.10.      Workday, Inc.

12.10.1          COMPANY OVERVIEW

12.10.2          COMPANY SNAPSHOT

12.10.3          OPERATING BUSINESS SEGMENTS

12.10.4          PRODUCT PORTFOLIO

12.10.5          BUSINESS PERFORMANCE

12.10.6          Workday Revenue Breakdown by ERP Subsegments (2017-2020)

12.10.7          KEY STRATEGIC MOVES AND DEVELOPMENT

LIST OF TABLE

TABLE 1.    Global  ERP Software Market Value, By Component, 2019-2030, Billion USD

TABLE 2.    Software market Value, By Region, 2019-2030, Billion USD

TABLE 3.    North America Software market Value, By Country, 2019-2030, Billion USD

TABLE 4.    Europe Software market Value, By Country, 2019-2030, Billion USD

TABLE 5.    Asia-Pacific Software market Value, By Country, 2019-2030, Billion USD

TABLE 6.    Rest of World Software market Value, By Country, 2019-2030, Billion USD

TABLE 7.    Service Market Value, By Region, 2019-2030, Billion USD

TABLE 8.    North America Service Market Value, By Country, 2019-2030, Billion USD

TABLE 9.    Europe Service Market Value, By Country, 2019-2030, Billion USD

TABLE 10.    Asia-Pacific Service Market Value, By Country, 2019-2030, Billion USD

TABLE 11.    Rest of World Service Market Value, By Country, 2019-2030, Billion USD

TABLE 12.    Global  ERP Software Market Value, By Deployment Model, 2019-2030, Billion USD

TABLE 13.    On-premise Market Value, By Region, 2019-2030, Billion USD

TABLE 14.    North America On-premise Market Value, By Country, 2019-2030, Billion USD

TABLE 15.    Europe On-premise Market Value, By Country, 2019-2030, Billion USD

TABLE 16.    Asia-Pacific On-premise Market Value, By Country, 2019-2030, Billion USD

TABLE 17.       Rest of World On-premise Market Value, By Country, 2019-2030, Billion USD

TABLE 18.    Cloud Market Value, By Region, 2019-2030, Billion USD

TABLE 19.    North America Cloud Market Value, By Country, 2019-2030, Billion USD

TABLE 20.    Europe Cloud Market Value, By Country, 2019-2030, Billion USD

TABLE 21.    Asia-Pacific Cloud Market Value, By Country, 2019-2030, Billion USD

TABLE 22.       Rest of World Cloud Market Value, By Country, 2019-2030, Billion USD

TABLE 23.       Hybrid Market Value, By Region, 2019-2030, Billion USD

TABLE 24.       North America Hybrid Market Value, By Country, 2019-2030, Billion USD

TABLE 25.       Europe Hybrid Market Value, By Country, 2019-2030, Billion USD

TABLE 26.    Asia-Pacific Hybrid Market Value, By Country, 2019-2030, Billion USD

TABLE 27.       Rest of World Hybrid Market Value, By Country, 2019-2030, Billion USD

TABLE 28.       Global  ERP Software Market Value, By Business Function, 2019-2030, Billion USD

TABLE 29.       Finance Market Value, By Region, 2019-2030, Billion USD

TABLE 30.    North America Finance Market Value, By Country, 2019-2030, Billion USD

TABLE 31.    Europe Finance Market Value, By Country, 2019-2030, Billion USD

TABLE 32.    Asia-Pacific Finance Market Value, By Country, 2019-2030, Billion USD

TABLE 33.    Rest of World Finance Market Value, By Country, 2019-2030, Billion USD

TABLE 34.    Human Resource (HR) Market Value, By Region, 2019-2030, Billion USD

TABLE 35.    North America Human Resource (HR) Market Value, By Country, 2019-2030, Billion USD

TABLE 36.       Europe Human Resource (HR) Market Value, By Country, 2019-2030, Billion USD

TABLE 37.       Asia-Pacific Human Resource (HR) Market Value, By Country, 2019-2030, Billion USD

TABLE 38.    Rest of World Human Resource (HR) Market Value, By Country, 2019-2030, Billion USD

TABLE 39.    Supply Chain Market Value, By Region, 2019-2030, Billion USD

TABLE 40.    North America Supply Chain Market Value, By Country, 2019-2030, Billion USD

TABLE 41.    Europe Supply Chain Market Value, By Country, 2019-2030, Billion USD

TABLE 42.       Asia-Pacific Supply Chain Market Value, By Country, 2019-2030, Billion USD

TABLE 43.       Rest of World Supply Chain Market Value, By Country, 2019-2030, Billion USD

TABLE 44.       Customer Management Market Value, By Region, 2019-2030, Billion USD

TABLE 45.    North America Customer Management Market Value, By Country, 2019-2030, Billion USD

TABLE 46.    Europe Customer Management Market Value, By Country, 2019-2030, Billion USD

TABLE 47.    Asia-Pacific Customer Management Market Value, By Country, 2019-2030, Billion USD

TABLE 48.    Rest of World Customer Management Market Value, By Country, 2019-2030, Billion USD

TABLE 49.       Inventory Management Market Value, By Region, 2019-2030, Billion USD

TABLE 50.    North America Inventory Management Market Value, By Country, 2019-2030, Billion USD

TABLE 51.    Europe Inventory Management Market Value, By Country, 2019-2030, Billion USD

TABLE 52.    Asia-Pacific Inventory Management Market Value, By Country, 2019-2030, Billion USD

TABLE 53.    Rest of World Inventory Management Market Value, By Country, 2019-2030, Billion USD

TABLE 54.       Manufacturing Module Market Value, By Region, 2019-2030, Billion USD

TABLE 55.    North America Manufacturing Module Market Value, By Country, 2019-2030, Billion USD

TABLE 56.    Europe Manufacturing Module Market Value, By Country, 2019-2030, Billion USD

TABLE 57.    Asia-Pacific Manufacturing Module Market Value, By Country, 2019-2030, Billion USD

TABLE 58.    Rest of World Manufacturing Module Market Value, By Country, 2019-2030, Billion USD

TABLE 59.    Other Business Function Market Value, By Region, 2019-2030, Billion USD

TABLE 60.    North America Other Business Function Market Value, By Country, 2019-2030, Billion USD

TABLE 61.    Europe Other Business Function Market Value, By Country, 2019-2030, Billion USD

TABLE 62.    Asia-Pacific Other Business Function Market Value, By Country, 2019-2030, Billion USD

TABLE 63.    Rest of World Other Business Function Market Value, By Country, 2019-2030, Billion USD

TABLE 64.    Global  ERP Software Market Value, By End User, 2019-2030, Billion USD

TABLE 65.    Large Enterprises Market Value, By Region, 2019-2030, Billion USD

TABLE 66.    North America Large Enterprises Market Value, By Country, 2019-2030, Billion USD

TABLE 67.    Europe Large Enterprises Market Value, By Country, 2019-2030, Billion USD

TABLE 68.    Asia-Pacific Large Enterprises Market Value, By Country, 2019-2030, Billion USD

TABLE 69.    Rest of World Large Enterprises Market Value, By Country, 2019-2030, Billion USD

TABLE 70.       Medium Enterprises Market Value, By Region, 2019-2030, Billion USD

TABLE 71.    North America Medium Enterprises Market Value, By Country, 2019-2030, Billion USD

TABLE 72.    Europe Medium Enterprises Market Value, By Country, 2019-2030, Billion USD

TABLE 73.       Asia-Pacific Medium Enterprises Market Value, By Country, 2019-2030, Billion USD

TABLE 74.    Rest of World Medium Enterprises Market Value, By Country, 2019-2030, Billion USD

TABLE 75.    Small Enterprises Market Value, By Region, 2019-2030, Billion USD

TABLE 76.    North America Small Enterprises Market Value, By Country, 2019-2030, Billion USD

TABLE 77.       Europe Small Enterprises Market Value, By Country, 2019-2030, Billion USD

TABLE 78.    Asia-Pacific Small Enterprises Market Value, By Country, 2019-2030, Billion USD

TABLE 79.    Rest of World Small Enterprises Market Value, By Country, 2019-2030, Billion USD

TABLE 80.       Global  ERP Software Market Value, By Industry Vertical, 2019-2030, Billion USD

TABLE 81.     Manufacturing Market Value, By Region, 2019-2030, Billion USD

TABLE 82.    North America Manufacturing Market Value, By Country, 2019-2030, Billion USD

TABLE 83.       Europe Manufacturing Market Value, By Country, 2019-2030, Billion USD

TABLE 84.       Asia-Pacific Manufacturing Market Value, By Country, 2019-2030, Billion USD

TABLE 85.       Rest of World Manufacturing Market Value, By Country, 2019-2030, Billion USD

TABLE 86.       BFSI Market Value, By Region, 2019-2030, Billion USD

TABLE 87.    North America BFSI Market Value, By Country, 2019-2030, Billion USD

TABLE 88.    Europe BFSI Market Value, By Country, 2019-2030, Billion USD

TABLE 89.    Asia-Pacific BFSI Market Value, By Country, 2019-2030, Billion USD

TABLE 90.    Rest of World BFSI Market Value, By Country, 2019-2030, Billion USD

TABLE 91.       Healthcare Market Value, By Region, 2019-2030, Billion USD

TABLE 92.       North America Healthcare Market Value, By Country, 2019-2030, Billion USD

TABLE 93.     Europe Healthcare Market Value, By Country, 2019-2030, Billion USD

TABLE 94.    Asia-Pacific Healthcare Market Value, By Country, 2019-2030, Billion USD

TABLE 95.       Rest of World Healthcare Market Value, By Country, 2019-2030, Billion USD

TABLE 96.       Retail & Distribution Market Value, By Region, 2019-2030, Billion USD

TABLE 97.    North America Retail & Distribution Market Value, By Country, 2019-2030, Billion USD

TABLE 98.    Europe Retail & Distribution Market Value, By Country, 2019-2030, Billion USD

TABLE 99.       Asia-Pacific Retail & Distribution Market Value, By Country, 2019-2030, Billion USD

TABLE 100.    Rest of World Retail & Distribution Market Value, By Country, 2019-2030, Billion USD

TABLE 101.    Government & Utilities Market Value, By Region, 2019-2030, Billion USD

TABLE 102.    North America Government & Utilities Market Value, By Country, 2019-2030, Billion USD

TABLE 103.    Europe Government & Utilities Market Value, By Country, 2019-2030, Billion USD

TABLE 104.    Asia-Pacific Government & Utilities Market Value, By Country, 2019-2030, Billion USD

TABLE 105.    Rest of World Government & Utilities Market Value, By Country, 2019-2030, Billion USD

TABLE 106.    IT & Telecom Market Value, By Region, 2019-2030, Billion USD

TABLE 107.    North America IT & Telecom Market Value, By Country, 2019-2030, Billion USD

TABLE 108.    Europe IT & Telecom Market Value, By Country, 2019-2030, Billion USD

TABLE 109.    Asia-Pacific IT & Telecom Market Value, By Country, 2019-2030, Billion USD

TABLE 110.    Rest of World IT & Telecom Market Value, By Country, 2019-2030, Billion USD

TABLE 111.    Construction Market Value, By Region, 2019-2030, Billion USD

TABLE 112.    North America Construction Market Value, By Country, 2019-2030, Billion USD

TABLE 113.    Europe Construction Market Value, By Country, 2019-2030, Billion USD

TABLE 114.    Asia-Pacific Construction Market Value, By Country, 2019-2030, Billion USD

TABLE 115.    Rest of World Construction Market Value, By Country, 2019-2030, Billion USD

TABLE 116.    Aerospace & Defense Market Value, By Region, 2019-2030, Billion USD

TABLE 117.    North America Aerospace & Defense Market Value, By Country, 2019-2030, Billion USD

TABLE 118.    Europe Aerospace & Defense Market Value, By Country, 2019-2030, Billion USD

TABLE 119.    Asia-Pacific Aerospace & Defense Market Value, By Country, 2019-2030, Billion USD

TABLE 120.    Rest of World Aerospace & Defense Market Value, By Country, 2019-2030, Billion USD

TABLE 121.    Aerospace & Defense Market Value, By Region, 2019-2030, Billion USD

TABLE 122.    North America Aerospace & Defense Market Value, By Country, 2019-2030, Billion USD

TABLE 123.    Europe Aerospace & Defense Market Value, By Country, 2019-2030, Billion USD

TABLE 124.    Asia-Pacific Aerospace & Defense Market Value, By Country, 2019-2030, Billion USD

TABLE 125.    Rest of World Aerospace & Defense Market Value, By Country, 2019-2030, Billion USD

TABLE 126.    Global  ERP Software Market Value, By Region, 2019-2030, Billion USD

TABLE 127.    North America ERP Software Market Value, By Component, 2019-2030, Billion USD

TABLE 128.    North America ERP Software Market Value, By Deployment Model, 2019-2030, Billion USD

TABLE 129.    North America ERP Software Market Value, By Business Function, 2019-2030, Billion USD

TABLE 130.    North America ERP Software Market Value, By End User, 2019-2030, Billion USD

TABLE 131.    North America ERP Software Market Value, By Industry Vertical, 2019-2030, Billion USD

TABLE 132.    U.S ERP Software Market Value, By Component, 2019-2030, Billion USD

TABLE 133.    U.S ERP Software Market Value, By Deployment Model, 2019-2030, Billion USD

TABLE 134.    U.S ERP Software Market Value, By Business Function, 2019-2030, Billion USD

TABLE 135.    U.S ERP Software Market Value, By End User, 2019-2030, Billion USD

TABLE 136.    U.S ERP Software Market Value, By Industry Vertical, 2019-2030, Billion USD

TABLE 137.    Canada ERP Software Market Value, By Component, 2019-2030, Billion USD

TABLE 138.    Canada ERP Software Market Value, By Deployment Model, 2019-2030, Billion USD

TABLE 139.    Canada ERP Software Market Value, By Business Function, 2019-2030, Billion USD

TABLE 140.    Canada ERP Software Market Value, By End User, 2019-2030, Billion USD

TABLE 141.    Canada ERP Software Market Value, By Industry Vertical, 2019-2030, Billion USD

TABLE 142.    Europe ERP Software Market Value, By Component, 2019-2030, Billion USD

TABLE 143.    Europe ERP Software Market Value, By Deployment Model, 2019-2030, Billion USD

TABLE 144.    Europe ERP Software Market Value, By Business Function, 2019-2030, Billion USD

TABLE 145.    Europe ERP Software Market Value, By End User, 2019-2030, Billion USD

TABLE 146.    Europe ERP Software Market Value, By Industry Vertical, 2019-2030, Billion USD

TABLE 147.    UK ERP Software Market Value, By Component, 2019-2030, Billion USD

TABLE 148.    UK ERP Software Market Value, By Deployment Model, 2019-2030, Billion USD

TABLE 149.    UK ERP Software Market Value, By Business Function, 2019-2030, Billion USD

TABLE 150.    UK ERP Software Market Value, By End User, 2019-2030, Billion USD

TABLE 151.    UK ERP Software Market Value, By Industry Vertical, 2019-2030, Billion USD

TABLE 152.    Germany ERP Software Market Value, By Component, 2019-2030, Billion USD

TABLE 153.    Germany ERP Software Market Value, By Deployment Model, 2019-2030, Billion USD

TABLE 154.    Germany ERP Software Market Value, By Business Function, 2019-2030, Billion USD

TABLE 155.    Germany ERP Software Market Value, By End User, 2019-2030, Billion USD

TABLE 156.    Germany ERP Software Market Value, By Industry Vertical, 2019-2030, Billion USD

TABLE 157.    France ERP Software Market Value, By Component, 2019-2030, Billion USD

TABLE 158.    France ERP Software Market Value, By Deployment Model, 2019-2030, Billion USD

TABLE 159.    France ERP Software Market Value, By Business Function, 2019-2030, Billion USD

TABLE 160.    France ERP Software Market Value, By End User, 2019-2030, Billion USD

TABLE 161.    France ERP Software Market Value, By Industry Vertical, 2019-2030, Billion USD

TABLE 162.    Italy ERP Software Market Value, By Component, 2019-2030, Billion USD

TABLE 163.    Italy ERP Software Market Value, By Deployment Model, 2019-2030, Billion USD

TABLE 164.    Italy ERP Software Market Value, By Business Function, 2019-2030, Billion USD

TABLE 165.    Italy ERP Software Market Value, By End User, 2019-2030, Billion USD

TABLE 166.    Italy ERP Software Market Value, By Industry Vertical, 2019-2030, Billion USD

TABLE 167.    Spain ERP Software Market Value, By Component, 2019-2030, Billion USD

TABLE 168.    Spain ERP Software Market Value, By Deployment Model, 2019-2030, Billion USD

TABLE 169.    Spain ERP Software Market Value, By Business Function, 2019-2030, Billion USD

TABLE 170.    Spain ERP Software Market Value, By End User, 2019-2030, Billion USD

TABLE 171.    Spain ERP Software Market Value, By Industry Vertical, 2019-2030, Billion USD

TABLE 172.    Rest of Europe ERP Software Market Value, By Component, 2019-2030, Billion USD

TABLE 173.    Rest of Europe ERP Software Market Value, By Deployment Model, 2019-2030, Billion USD

TABLE 174.    Rest of Europe ERP Software Market Value, By Business Function, 2019-2030, Billion USD

TABLE 175.    Rest of Europe ERP Software Market Value, By End User, 2019-2030, Billion USD

TABLE 176.    Rest of Europe ERP Software Market Value, By Industry Vertical, 2019-2030, Billion USD

TABLE 177.    Asia-Pacific ERP Software Market Value, By Component, 2019-2030, Billion USD

TABLE 178.    Asia-Pacific ERP Software Market Value, By Deployment Model, 2019-2030, Billion USD

TABLE 179.    Asia-Pacific ERP Software Market Value, By Business Function, 2019-2030, Billion USD

TABLE 180.    Asia-Pacific ERP Software Market Value, By End User, 2019-2030, Billion USD

TABLE 181.    Asia-Pacific ERP Software Market Value, By Industry Vertical, 2019-2030, Billion USD

TABLE 182.    China ERP Software Market Value, By Component, 2019-2030, Billion USD

TABLE 183.    China ERP Software Market Value, By Deployment Model, 2019-2030, Billion USD

TABLE 184.    China ERP Software Market Value, By Business Function, 2019-2030, Billion USD

TABLE 185.    China ERP Software Market Value, By End User, 2019-2030, Billion USD

TABLE 186.    China ERP Software Market Value, By Industry Vertical, 2019-2030, Billion USD

TABLE 187.    Japan ERP Software Market Value, By Component, 2019-2030, Billion USD

TABLE 188.    Japan ERP Software Market Value, By Deployment Model, 2019-2030, Billion USD

TABLE 189.    Japan ERP Software Market Value, By Business Function, 2019-2030, Billion USD

TABLE 190.    Japan ERP Software Market Value, By End User, 2019-2030, Billion USD

TABLE 191.    Japan ERP Software Market Value, By Industry Vertical, 2019-2030, Billion USD

TABLE 192.    India ERP Software Market Value, By Component, 2019-2030, Billion USD

TABLE 193.    India ERP Software Market Value, By Deployment Model, 2019-2030, Billion USD

TABLE 194.    India ERP Software Market Value, By Business Function, 2019-2030, Billion USD

TABLE 195.    India ERP Software Market Value, By End User, 2019-2030, Billion USD

TABLE 196.    India ERP Software Market Value, By Industry Vertical, 2019-2030, Billion USD

TABLE 197.    South Korea ERP Software Market Value, By Component, 2019-2030, Billion USD

TABLE 198.    South Korea ERP Software Market Value, By Deployment Model, 2019-2030, Billion USD

TABLE 199.    South Korea ERP Software Market Value, By Business Function, 2019-2030, Billion USD

TABLE 200.    South Korea ERP Software Market Value, By End User, 2019-2030, Billion USD

TABLE 201.    South Korea ERP Software Market Value, By Industry Vertical, 2019-2030, Billion USD

TABLE 202.    Australia ERP Software Market Value, By Component, 2019-2030, Billion USD

TABLE 203.    Australia ERP Software Market Value, By Deployment Model, 2019-2030, Billion USD

TABLE 204.    Australia ERP Software Market Value, By Business Function, 2019-2030, Billion USD

TABLE 205.    Australia ERP Software Market Value, By End User, 2019-2030, Billion USD

TABLE 206.    Australia ERP Software Market Value, By Industry Vertical, 2019-2030, Billion USD

TABLE 207.    Rest of Asia-Pacific ERP Software Market Value, By Component, 2019-2030, Billion USD

TABLE 208.    Rest of Asia-Pacific ERP Software Market Value, By Deployment Model, 2019-2030, Billion USD

TABLE 209.    Rest of Asia-Pacific ERP Software Market Value, By Business Function, 2019-2030, Billion USD

TABLE 210.    Rest of Asia-Pacific ERP Software Market Value, By End User, 2019-2030, Billion USD

TABLE 211.    Rest of Asia-Pacific ERP Software Market Value, By Industry Vertical, 2019-2030, Billion USD

TABLE 212.    Rest of World ERP Software Market Value, By Component, 2019-2030, Billion USD

TABLE 213.    Rest of World ERP Software Market Value, By Deployment Model, 2019-2030, Billion USD

TABLE 214.    Rest of World ERP Software Market Value, By Business Function, 2019-2030, Billion USD

TABLE 215.    Rest of World ERP Software Market Value, By End User, 2019-2030, Billion USD

TABLE 216.    Rest of World ERP Software Market Value, By Industry Vertical, 2019-2030, Billion USD

TABLE 217.    Latin America ERP Software Market Value, By Component, 2019-2030, Billion USD

TABLE 218.    Latin America ERP Software Market Value, By Deployment Model, 2019-2030, Billion USD

TABLE 219.    Latin America ERP Software Market Value, By Business Function, 2019-2030, Billion USD

TABLE 220.    Latin America ERP Software Market Value, By End User, 2019-2030, Billion USD

TABLE 221.    Latin America ERP Software Market Value, By Industry Vertical, 2019-2030, Billion USD

TABLE 222.    Middle East  ERP Software Market Value, By Component, 2019-2030, Billion USD

TABLE 223.    Middle East  ERP Software Market Value, By Deployment Model, 2019-2030, Billion USD

TABLE 224.    Middle East  ERP Software Market Value, By Business Function, 2019-2030, Billion USD

TABLE 225.    Middle East  ERP Software Market Value, By End User, 2019-2030, Billion USD

TABLE 226.    Middle East  ERP Software Market Value, By Industry Vertical, 2019-2030, Billion USD

TABLE 227.    Africa ERP Software Market Value, By Component, 2019-2030, Billion USD

TABLE 228.    Africa ERP Software Market Value, By Deployment Model, 2019-2030, Billion USD

TABLE 229.    Africa ERP Software Market Value, By Business Function, 2019-2030, Billion USD

TABLE 230.    Africa ERP Software Market Value, By End User, 2019-2030, Billion USD

TABLE 231.    Africa ERP Software Market Value, By Industry Vertical, 2019-2030, Billion USD

TABLE 232.    Deskera: COMPANY SNAPSHOT

TABLE 233.    Deskera: OPERATING SEGMENTS

TABLE 234.    Deskera: PRODUCT PORTFOLIO

TABLE 235.    Revenue by ERP Sub-Segments (2017-2020)

TABLE 236.    Deskera: KEY STRATERGY

TABLE 237.    Epicor Software Corporation: COMPANY SNAPSHOT

TABLE 238.    Epicor Software Corporation: OPERATING SEGMENTS

TABLE 239.    Epicor Software Corporation: PRODUCT PORTFOLIO

TABLE 240.    Revenue by ERP Sub-Segments (2017-2020)

TABLE 241.    Epicor Software Corporation: KEY STRATERGY

TABLE 242.    IFS AB: COMPANY SNAPSHOT

TABLE 243.    IFS AB: OPERATING SEGMENTS

TABLE 244.    IFS AB: PRODUCT PORTFOLIO

TABLE 245.    Revenue by ERP Sub-Segments (2017-2020)

TABLE 246.    IFS AB: KEY STRATERGY

TABLE 247.    Infor: COMPANY SNAPSHOT

TABLE 248.    Infor: OPERATING SEGMENTS

TABLE 249.    Infor: PRODUCT PORTFOLIO

TABLE 250.    Revenue by ERP Sub-Segments (2017-2020)

TABLE 251.    Infor: KEY STRATERGY

TABLE 252.    Microsoft Corporation: COMPANY SNAPSHOT

TABLE 253.    Microsoft Corporation: OPERATING SEGMENTS

TABLE 254.    Microsoft Corporation: PRODUCT PORTFOLIO

TABLE 255.    Revenue by ERP Sub-Segments (2017-2020)

TABLE 256.    Microsoft Corporation: KEY STRATERGY

TABLE 257.    Oracle Corporation: COMPANY SNAPSHOT

TABLE 258.    Oracle Corporation: OPERATING SEGMENTS

TABLE 259.    Oracle Corporation: PRODUCT PORTFOLIO

TABLE 260.    Revenue by ERP Sub-Segments (2017-2020)

TABLE 261.    Oracle Corporation: KEY STRATERGY

TABLE 262.    Sage Software Solutions Pvt. Ltd.: COMPANY SNAPSHOT

TABLE 263.    Sage Software Solutions Pvt. Ltd.: OPERATING SEGMENTS

TABLE 264.    Sage Software Solutions Pvt. Ltd.: PRODUCT PORTFOLIO

TABLE 265.    Revenue by ERP Sub-Segments (2017-2020)

TABLE 266.    Sage Software Solutions Pvt. Ltd.: KEY STRATERGY

TABLE 267.    SAP SE: COMPANY SNAPSHOT

TABLE 268.    SAP SE: OPERATING SEGMENTS

TABLE 269.    SAP SE: PRODUCT PORTFOLIO

TABLE 270.    Revenue by ERP Sub-Segments (2017-2020)

TABLE 271.    SAP SE: KEY STRATERGY

TABLE 272.    SYSPRO: COMPANY SNAPSHOT

TABLE 273.    SYSPRO: OPERATING SEGMENTS

TABLE 274.    SYSPRO: PRODUCT PORTFOLIO

TABLE 275.    Revenue by ERP Sub-Segments (2017-2020)

TABLE 276.    SYSPRO: KEY STRATERGY

TABLE 277.    Workday, Inc.: COMPANY SNAPSHOT

TABLE 278.    Workday, Inc.: OPERATING SEGMENTS

TABLE 279.    Workday, Inc.: PRODUCT PORTFOLIO

TABLE 280.    Revenue by ERP Sub-Segments (2017-2020)

TABLE 281.    Workday, Inc.: KEY STRATERGY


LIST OF FIGURES

FIGURE 1.       Global  ERP Software Market Value, By Component, 2019-2030, Billion USD

FIGURE 2.       Software market Value, By Region, 2019-2030, Billion USD

FIGURE 3.       North America Software market Value, By Country, 2019-2030, Billion USD

FIGURE 4.       Europe Software market Value, By Country, 2019-2030, Billion USD

FIGURE 5.       Asia-Pacific Software market Value, By Country, 2019-2030, Billion USD

FIGURE 6.       Rest of World Software market Value, By Country, 2019-2030, Billion USD

FIGURE 7.       Service Market Value, By Region, 2019-2030, Billion USD

FIGURE 8.       North America Service Market Value, By Country, 2019-2030, Billion USD

FIGURE 9.       Europe Service Market Value, By Country, 2019-2030, Billion USD

FIGURE 10.    Asia-Pacific Service Market Value, By Country, 2019-2030, Billion USD

FIGURE 11.    Rest of World Service Market Value, By Country, 2019-2030, Billion USD

FIGURE 12.    Global  ERP Software Market Value, By Deployment Model, 2019-2030, Billion USD

FIGURE 13.    On-premise Market Value, By Region, 2019-2030, Billion USD

FIGURE 14.    North America On-premise Market Value, By Country, 2019-2030, Billion USD

FIGURE 15.    Europe On-premise Market Value, By Country, 2019-2030, Billion USD

FIGURE 16.    Asia-Pacific On-premise Market Value, By Country, 2019-2030, Billion USD

FIGURE 17.    Rest of World On-premise Market Value, By Country, 2019-2030, Billion USD

FIGURE 18.    Cloud Market Value, By Region, 2019-2030, Billion USD

FIGURE 19.    North America Cloud Market Value, By Country, 2019-2030, Billion USD

FIGURE 20.    Europe Cloud Market Value, By Country, 2019-2030, Billion USD

FIGURE 21.    Asia-Pacific Cloud Market Value, By Country, 2019-2030, Billion USD

FIGURE 22.    Rest of World Cloud Market Value, By Country, 2019-2030, Billion USD

FIGURE 23.    Hybrid Market Value, By Region, 2019-2030, Billion USD

FIGURE 24.    North America Hybrid Market Value, By Country, 2019-2030, Billion USD

FIGURE 25.    Europe Hybrid Market Value, By Country, 2019-2030, Billion USD

FIGURE 26.    Asia-Pacific Hybrid Market Value, By Country, 2019-2030, Billion USD

FIGURE 27.    Rest of World Hybrid Market Value, By Country, 2019-2030, Billion USD

FIGURE 28.    Global  ERP Software Market Value, By Business Function, 2019-2030, Billion USD

FIGURE 29.    Finance Market Value, By Region, 2019-2030, Billion USD

FIGURE 30.    North America Finance Market Value, By Country, 2019-2030, Billion USD

FIGURE 31.    Europe Finance Market Value, By Country, 2019-2030, Billion USD

FIGURE 32.    Asia-Pacific Finance Market Value, By Country, 2019-2030, Billion USD

FIGURE 33.    Rest of World Finance Market Value, By Country, 2019-2030, Billion USD

FIGURE 34.    Human Resource (HR) Market Value, By Region, 2019-2030, Billion USD

FIGURE 35.    North America Human Resource (HR) Market Value, By Country, 2019-2030, Billion USD

FIGURE 36.    Europe Human Resource (HR) Market Value, By Country, 2019-2030, Billion USD

FIGURE 37.    Asia-Pacific Human Resource (HR) Market Value, By Country, 2019-2030, Billion USD

FIGURE 38.    Rest of World Human Resource (HR) Market Value, By Country, 2019-2030, Billion USD

FIGURE 39.    Supply Chain Market Value, By Region, 2019-2030, Billion USD

FIGURE 40.    North America Supply Chain Market Value, By Country, 2019-2030, Billion USD

FIGURE 41.    Europe Supply Chain Market Value, By Country, 2019-2030, Billion USD

FIGURE 42.    Asia-Pacific Supply Chain Market Value, By Country, 2019-2030, Billion USD

FIGURE 43.    Rest of World Supply Chain Market Value, By Country, 2019-2030, Billion USD

FIGURE 44.    Customer Management Market Value, By Region, 2019-2030, Billion USD

FIGURE 45.    North America Customer Management Market Value, By Country, 2019-2030, Billion USD

FIGURE 46.    Europe Customer Management Market Value, By Country, 2019-2030, Billion USD

FIGURE 47.    Asia-Pacific Customer Management Market Value, By Country, 2019-2030, Billion USD

FIGURE 48.    Rest of World Customer Management Market Value, By Country, 2019-2030, Billion USD

FIGURE 49.    Inventory Management Market Value, By Region, 2019-2030, Billion USD

FIGURE 50.    North America Inventory Management Market Value, By Country, 2019-2030, Billion USD

FIGURE 51.    Europe Inventory Management Market Value, By Country, 2019-2030, Billion USD

FIGURE 52.    Asia-Pacific Inventory Management Market Value, By Country, 2019-2030, Billion USD

FIGURE 53.    Rest of World Inventory Management Market Value, By Country, 2019-2030, Billion USD

FIGURE 54.    Manufacturing Module Market Value, By Region, 2019-2030, Billion USD

FIGURE 55.    North America Manufacturing Module Market Value, By Country, 2019-2030, Billion USD

FIGURE 56.    Europe Manufacturing Module Market Value, By Country, 2019-2030, Billion USD

FIGURE 57.    Asia-Pacific Manufacturing Module Market Value, By Country, 2019-2030, Billion USD

FIGURE 58.    Rest of World Manufacturing Module Market Value, By Country, 2019-2030, Billion USD

FIGURE 59.    Other Business Function Market Value, By Region, 2019-2030, Billion USD

FIGURE 60.    North America Other Business Function Market Value, By Country, 2019-2030, Billion USD

FIGURE 61.    Europe Other Business Function Market Value, By Country, 2019-2030, Billion USD

FIGURE 62.    Asia-Pacific Other Business Function Market Value, By Country, 2019-2030, Billion USD

FIGURE 63.    Rest of World Other Business Function Market Value, By Country, 2019-2030, Billion USD

FIGURE 64.    Global  ERP Software Market Value, By End User, 2019-2030, Billion USD

FIGURE 65.    Large Enterprises Market Value, By Region, 2019-2030, Billion USD

FIGURE 66.    North America Large Enterprises Market Value, By Country, 2019-2030, Billion USD

FIGURE 67.    Europe Large Enterprises Market Value, By Country, 2019-2030, Billion USD

FIGURE 68.    Asia-Pacific Large Enterprises Market Value, By Country, 2019-2030, Billion USD

FIGURE 69.    Rest of World Large Enterprises Market Value, By Country, 2019-2030, Billion USD

FIGURE 70.    Medium Enterprises Market Value, By Region, 2019-2030, Billion USD

FIGURE 71.    North America Medium Enterprises Market Value, By Country, 2019-2030, Billion USD

FIGURE 72.    Europe Medium Enterprises Market Value, By Country, 2019-2030, Billion USD

FIGURE 73.    Asia-Pacific Medium Enterprises Market Value, By Country, 2019-2030, Billion USD

FIGURE 74.    Rest of World Medium Enterprises Market Value, By Country, 2019-2030, Billion USD

FIGURE 75.    Small Enterprises Market Value, By Region, 2019-2030, Billion USD

FIGURE 76.    North America Small Enterprises Market Value, By Country, 2019-2030, Billion USD

FIGURE 77.    Europe Small Enterprises Market Value, By Country, 2019-2030, Billion USD

FIGURE 78.    Asia-Pacific Small Enterprises Market Value, By Country, 2019-2030, Billion USD

FIGURE 79.    Rest of World Small Enterprises Market Value, By Country, 2019-2030, Billion USD

FIGURE 80.    Global  ERP Software Market Value, By Industry Vertical, 2019-2030, Billion USD

FIGURE 81.    Manufacturing Market Value, By Region, 2019-2030, Billion USD

FIGURE 82.    North America Manufacturing Market Value, By Country, 2019-2030, Billion USD

FIGURE 83.    Europe Manufacturing Market Value, By Country, 2019-2030, Billion USD

FIGURE 84.    Asia-Pacific Manufacturing Market Value, By Country, 2019-2030, Billion USD

FIGURE 85.    Rest of World Manufacturing Market Value, By Country, 2019-2030, Billion USD

FIGURE 86.    BFSI Market Value, By Region, 2019-2030, Billion USD

FIGURE 87.    North America BFSI Market Value, By Country, 2019-2030, Billion USD

FIGURE 88.    Europe BFSI Market Value, By Country, 2019-2030, Billion USD

FIGURE 89.    Asia-Pacific BFSI Market Value, By Country, 2019-2030, Billion USD

FIGURE 90.    Rest of World BFSI Market Value, By Country, 2019-2030, Billion USD

FIGURE 91.    Healthcare Market Value, By Region, 2019-2030, Billion USD

FIGURE 92.    North America Healthcare Market Value, By Country, 2019-2030, Billion USD

FIGURE 93.    Europe Healthcare Market Value, By Country, 2019-2030, Billion USD

FIGURE 94.    Asia-Pacific Healthcare Market Value, By Country, 2019-2030, Billion USD

FIGURE 95.    Rest of World Healthcare Market Value, By Country, 2019-2030, Billion USD

FIGURE 96.    Retail & Distribution Market Value, By Region, 2019-2030, Billion USD

FIGURE 97.    North America Retail & Distribution Market Value, By Country, 2019-2030, Billion USD

FIGURE 98.    Europe Retail & Distribution Market Value, By Country, 2019-2030, Billion USD

FIGURE 99.    Asia-Pacific Retail & Distribution Market Value, By Country, 2019-2030, Billion USD

FIGURE 100. Rest of World Retail & Distribution Market Value, By Country, 2019-2030, Billion USD

FIGURE 101. Government & Utilities Market Value, By Region, 2019-2030, Billion USD

FIGURE 102. North America Government & Utilities Market Value, By Country, 2019-2030, Billion USD

FIGURE 103. Europe Government & Utilities Market Value, By Country, 2019-2030, Billion USD

FIGURE 104. Asia-Pacific Government & Utilities Market Value, By Country, 2019-2030, Billion USD

FIGURE 105. Rest of World Government & Utilities Market Value, By Country, 2019-2030, Billion USD

FIGURE 106. IT & Telecom Market Value, By Region, 2019-2030, Billion USD

FIGURE 107. North America IT & Telecom Market Value, By Country, 2019-2030, Billion USD

FIGURE 108. Europe IT & Telecom Market Value, By Country, 2019-2030, Billion USD

FIGURE 109. Asia-Pacific IT & Telecom Market Value, By Country, 2019-2030, Billion USD

FIGURE 110. Rest of World IT & Telecom Market Value, By Country, 2019-2030, Billion USD

FIGURE 111. Construction Market Value, By Region, 2019-2030, Billion USD

FIGURE 112. North America Construction Market Value, By Country, 2019-2030, Billion USD

FIGURE 113. Europe Construction Market Value, By Country, 2019-2030, Billion USD

FIGURE 114. Asia-Pacific Construction Market Value, By Country, 2019-2030, Billion USD

FIGURE 115. Rest of World Construction Market Value, By Country, 2019-2030, Billion USD

FIGURE 116. Aerospace & Defense Market Value, By Region, 2019-2030, Billion USD

FIGURE 117. North America Aerospace & Defense Market Value, By Country, 2019-2030, Billion USD

FIGURE 118.    Europe Aerospace & Defense Market Value, By Country, 2019-2030, Billion USD

FIGURE 119.    Asia-Pacific Aerospace & Defense Market Value, By Country, 2019-2030, Billion USD

FIGURE 120. Rest of World Aerospace & Defense Market Value, By Country, 2019-2030, Billion USD

FIGURE 121. Aerospace & Defense Market Value, By Region, 2019-2030, Billion USD

FIGURE 122. North America Aerospace & Defense Market Value, By Country, 2019-2030, Billion USD

FIGURE 123. Europe Aerospace & Defense Market Value, By Country, 2019-2030, Billion USD

FIGURE 124. Asia-Pacific Aerospace & Defense Market Value, By Country, 2019-2030, Billion USD

FIGURE 125. Rest of World Aerospace & Defense Market Value, By Country, 2019-2030, Billion USD

FIGURE 126. Global  ERP Software Market Value, By Region, 2019-2030, Billion USD

FIGURE 127. North America ERP Software Market Value, By Component, 2019-2030, Billion USD

FIGURE 128. North America ERP Software Market Value, By Deployment Model, 2019-2030, Billion USD

FIGURE 129. North America ERP Software Market Value, By Business Function, 2019-2030, Billion USD

FIGURE 130. North America ERP Software Market Value, By End User, 2019-2030, Billion USD

FIGURE 131. North America ERP Software Market Value, By Industry Vertical, 2019-2030, Billion USD

FIGURE 132. U.S ERP Software Market Value, By Component, 2019-2030, Billion USD

FIGURE 133. U.S ERP Software Market Value, By Deployment Model, 2019-2030, Billion USD

FIGURE 134. U.S ERP Software Market Value, By Business Function, 2019-2030, Billion USD

FIGURE 135. U.S ERP Software Market Value, By End User, 2019-2030, Billion USD

FIGURE 136. U.S ERP Software Market Value, By Industry Vertical, 2019-2030, Billion USD

FIGURE 137. Canada ERP Software Market Value, By Component, 2019-2030, Billion USD

FIGURE 138. Canada ERP Software Market Value, By Deployment Model, 2019-2030, Billion USD

FIGURE 139. Canada ERP Software Market Value, By Business Function, 2019-2030, Billion USD

FIGURE 140. Canada ERP Software Market Value, By End User, 2019-2030, Billion USD

FIGURE 141. Canada ERP Software Market Value, By Industry Vertical, 2019-2030, Billion USD

FIGURE 142. Europe ERP Software Market Value, By Component, 2019-2030, Billion USD

FIGURE 143. Europe ERP Software Market Value, By Deployment Model, 2019-2030, Billion USD

FIGURE 144. Europe ERP Software Market Value, By Business Function, 2019-2030, Billion USD

FIGURE 145. Europe ERP Software Market Value, By End User, 2019-2030, Billion USD

FIGURE 146. Europe ERP Software Market Value, By Industry Vertical, 2019-2030, Billion USD

FIGURE 147. UK ERP Software Market Value, By Component, 2019-2030, Billion USD

FIGURE 148. UK ERP Software Market Value, By Deployment Model, 2019-2030, Billion USD

FIGURE 149. UK ERP Software Market Value, By Business Function, 2019-2030, Billion USD

FIGURE 150. UK ERP Software Market Value, By End User, 2019-2030, Billion USD

FIGURE 151. UK ERP Software Market Value, By Industry Vertical, 2019-2030, Billion USD

FIGURE 152. Germany ERP Software Market Value, By Component, 2019-2030, Billion USD

FIGURE 153. Germany ERP Software Market Value, By Deployment Model, 2019-2030, Billion USD

FIGURE 154. Germany ERP Software Market Value, By Business Function, 2019-2030, Billion USD

FIGURE 155. Germany ERP Software Market Value, By End User, 2019-2030, Billion USD

FIGURE 156. Germany ERP Software Market Value, By Industry Vertical, 2019-2030, Billion USD

FIGURE 157. France ERP Software Market Value, By Component, 2019-2030, Billion USD

FIGURE 158. France ERP Software Market Value, By Deployment Model, 2019-2030, Billion USD

FIGURE 159. France ERP Software Market Value, By Business Function, 2019-2030, Billion USD

FIGURE 160. France ERP Software Market Value, By End User, 2019-2030, Billion USD

FIGURE 161. France ERP Software Market Value, By Industry Vertical, 2019-2030, Billion USD

FIGURE 162. Italy ERP Software Market Value, By Component, 2019-2030, Billion USD

FIGURE 163. Italy ERP Software Market Value, By Deployment Model, 2019-2030, Billion USD

FIGURE 164. Italy ERP Software Market Value, By Business Function, 2019-2030, Billion USD

FIGURE 165. Italy ERP Software Market Value, By End User, 2019-2030, Billion USD

FIGURE 166. Italy ERP Software Market Value, By Industry Vertical, 2019-2030, Billion USD

FIGURE 167. Spain ERP Software Market Value, By Component, 2019-2030, Billion USD

FIGURE 168. Spain ERP Software Market Value, By Deployment Model, 2019-2030, Billion USD

FIGURE 169. Spain ERP Software Market Value, By Business Function, 2019-2030, Billion USD

FIGURE 170. Spain ERP Software Market Value, By End User, 2019-2030, Billion USD

FIGURE 171. Spain ERP Software Market Value, By Industry Vertical, 2019-2030, Billion USD

FIGURE 172. Rest of Europe ERP Software Market Value, By Component, 2019-2030, Billion USD

FIGURE 173. Rest of Europe ERP Software Market Value, By Deployment Model, 2019-2030, Billion USD

FIGURE 174. Rest of Europe ERP Software Market Value, By Business Function, 2019-2030, Billion USD

FIGURE 175. Rest of Europe ERP Software Market Value, By End User, 2019-2030, Billion USD

FIGURE 176. Rest of Europe ERP Software Market Value, By Industry Vertical, 2019-2030, Billion USD

FIGURE 177. Asia-Pacific ERP Software Market Value, By Component, 2019-2030, Billion USD

FIGURE 178. Asia-Pacific ERP Software Market Value, By Deployment Model, 2019-2030, Billion USD

FIGURE 179. Asia-Pacific ERP Software Market Value, By Business Function, 2019-2030, Billion USD

FIGURE 180. Asia-Pacific ERP Software Market Value, By End User, 2019-2030, Billion USD

FIGURE 181. Asia-Pacific ERP Software Market Value, By Industry Vertical, 2019-2030, Billion USD

FIGURE 182. China ERP Software Market Value, By Component, 2019-2030, Billion USD

FIGURE 183. China ERP Software Market Value, By Deployment Model, 2019-2030, Billion USD

FIGURE 184. China ERP Software Market Value, By Business Function, 2019-2030, Billion USD

FIGURE 185. China ERP Software Market Value, By End User, 2019-2030, Billion USD

FIGURE 186. China ERP Software Market Value, By Industry Vertical, 2019-2030, Billion USD

FIGURE 187. Japan ERP Software Market Value, By Component, 2019-2030, Billion USD

FIGURE 188. Japan ERP Software Market Value, By Deployment Model, 2019-2030, Billion USD

FIGURE 189. Japan ERP Software Market Value, By Business Function, 2019-2030, Billion USD

FIGURE 190. Japan ERP Software Market Value, By End User, 2019-2030, Billion USD

FIGURE 191. Japan ERP Software Market Value, By Industry Vertical, 2019-2030, Billion USD

FIGURE 192. India ERP Software Market Value, By Component, 2019-2030, Billion USD

FIGURE 193. India ERP Software Market Value, By Deployment Model, 2019-2030, Billion USD

FIGURE 194. India ERP Software Market Value, By Business Function, 2019-2030, Billion USD

FIGURE 195. India ERP Software Market Value, By End User, 2019-2030, Billion USD

FIGURE 196. India ERP Software Market Value, By Industry Vertical, 2019-2030, Billion USD

FIGURE 197. South Korea ERP Software Market Value, By Component, 2019-2030, Billion USD

FIGURE 198. South Korea ERP Software Market Value, By Deployment Model, 2019-2030, Billion USD

FIGURE 199. South Korea ERP Software Market Value, By Business Function, 2019-2030, Billion USD

FIGURE 200. South Korea ERP Software Market Value, By End User, 2019-2030, Billion USD

FIGURE 201. South Korea ERP Software Market Value, By Industry Vertical, 2019-2030, Billion USD

FIGURE 202. Australia ERP Software Market Value, By Component, 2019-2030, Billion USD

FIGURE 203. Australia ERP Software Market Value, By Deployment Model, 2019-2030, Billion USD

FIGURE 204. Australia ERP Software Market Value, By Business Function, 2019-2030, Billion USD

FIGURE 205. Australia ERP Software Market Value, By End User, 2019-2030, Billion USD

FIGURE 206. Australia ERP Software Market Value, By Industry Vertical, 2019-2030, Billion USD

FIGURE 207. Rest of Asia-Pacific ERP Software Market Value, By Component, 2019-2030, Billion USD

FIGURE 208. Rest of Asia-Pacific ERP Software Market Value, By Deployment Model, 2019-2030, Billion USD

FIGURE 209. Rest of Asia-Pacific ERP Software Market Value, By Business Function, 2019-2030, Billion USD

FIGURE 210. Rest of Asia-Pacific ERP Software Market Value, By End User, 2019-2030, Billion USD

FIGURE 211. Rest of Asia-Pacific ERP Software Market Value, By Industry Vertical, 2019-2030, Billion USD

FIGURE 212. Rest of World ERP Software Market Value, By Component, 2019-2030, Billion USD

FIGURE 213. Rest of World ERP Software Market Value, By Deployment Model, 2019-2030, Billion USD

FIGURE 214. Rest of World ERP Software Market Value, By Business Function, 2019-2030, Billion USD

FIGURE 215. Rest of World ERP Software Market Value, By End User, 2019-2030, Billion USD

FIGURE 216. Rest of World ERP Software Market Value, By Industry Vertical, 2019-2030, Billion USD

FIGURE 217. Latin America ERP Software Market Value, By Component, 2019-2030, Billion USD

FIGURE 218. Latin America ERP Software Market Value, By Deployment Model, 2019-2030, Billion USD

FIGURE 219. Latin America ERP Software Market Value, By Business Function, 2019-2030, Billion USD

FIGURE 220. Latin America ERP Software Market Value, By End User, 2019-2030, Billion USD

FIGURE 221. Latin America ERP Software Market Value, By Industry Vertical, 2019-2030, Billion USD

FIGURE 222. Middle East  ERP Software Market Value, By Component, 2019-2030, Billion USD

FIGURE 223. Middle East  ERP Software Market Value, By Deployment Model, 2019-2030, Billion USD

FIGURE 224. Middle East  ERP Software Market Value, By Business Function, 2019-2030, Billion USD

FIGURE 225. Middle East  ERP Software Market Value, By End User, 2019-2030, Billion USD

FIGURE 226. Middle East  ERP Software Market Value, By Industry Vertical, 2019-2030, Billion USD

FIGURE 227. Africa ERP Software Market Value, By Component, 2019-2030, Billion USD

FIGURE 228. Africa ERP Software Market Value, By Deployment Model, 2019-2030, Billion USD

FIGURE 229. Africa ERP Software Market Value, By Business Function, 2019-2030, Billion USD

FIGURE 230. Africa ERP Software Market Value, By End User, 2019-2030, Billion USD

FIGURE 231. Africa ERP Software Market Value, By Industry Vertical, 2019-2030, Billion USD

FIGURE 232. Deskera: NET SALES,2017-2019

FIGURE 233. Epicor Software Corporation: NET SALES,2017-2019

FIGURE 234. IFS AB: NET SALES,2017-2019

FIGURE 235. Infor: NET SALES,2017-2019

FIGURE 236. Microsoft Corporation: NET SALES,2017-2019

FIGURE 237. Oracle Corporation: NET SALES,2017-2019

FIGURE 238. Sage Software Solutions Pvt. Ltd.: NET SALES,2017-2019

FIGURE 239. SAP SE: NET SALES,2017-2019

FIGURE 240. SYSPRO: NET SALES,2017-2019

FIGURE 241.    Workday, Inc.: NET SALES,2017-2019

KEY PLAYERS

  • Oracle Corporation

  • SAP SE

  • Sage Software Solutions Pvt. Ltd.

  • Infor

  • Workday, Inc.

  • Epicor Software Corporation

  • Microsoft Corporation

  • SYSPRO

  • Deskera

  • IFS


Frequently Asked Questions
What will be the worth of global erp software market by the end of 2030?

According to the report published by Next Move Strategy Consulting, the erp software market business is expected to hit at USD 68.34 billion by 2030.

Which region is expected to hold the highest market share in the erp software market?

North America is expected to hold the highest market share in the global market. The region is expected to witness remarkable growth as it houses the major key players in the market.

Which are the top companies in the erp software market?

Oracle Corporation, SAP SE, Sage Software Solutions Pvt. Ltd., Infor, Workday, Inc., Epicor Software Corporation, Microsoft Corporation, SYSPRO, Deskera, and IFS

What are the market segmentations and scope of the study?

The global erp software market share analysis is based on Component, Business Function, Industry Vertical, End User.

How big is the erp software market?

In 2019, the market value stands at USD 37.5 billion and it is anticipated to reach USD 68.34 billion by 2030.