Intelligent Capacity Planning Market Size, Share, Growth Trends and Segmentation Analysis, By Offering (Software, Vendor Services, Support), By Planning Domain (Supply Chain, Manufacturing, Workforce, Project Resource, IT Capacity Planning), By Deployment Model, By Organization Size, By Pricing Model, By Buyer Function, By Sales Channel, By End-User Industry, and By Region - Global Industry Report and Forecast, 2026–2035
Industry: ICT & Media | Publishing Date: July 22, 2026 | Last Updated: September 30, 2026 | No of Pages: N/A | No. of Tables: N/A | No. of Figures: N/A | Format: PDF | Report Code: IC5298
What Is the Intelligent Capacity Planning Market Size?
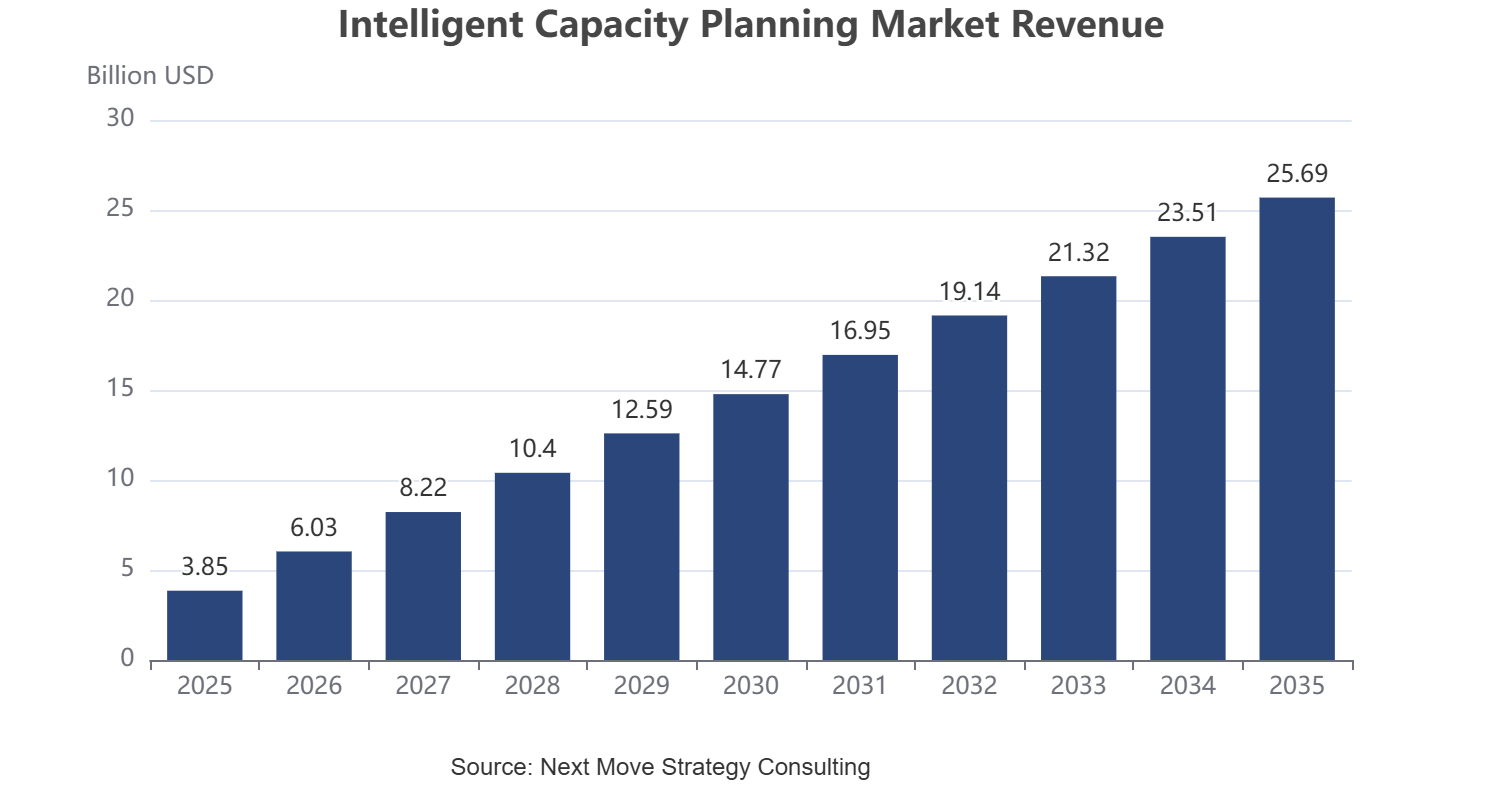
The global Intelligent Capacity Planning Market size was valued at USD 3.85 billion in 2025 and is estimated at USD 4.65 billion in 2026, forecast to reach USD 25.69 billion by 2035, expanding at a 20.9% CAGR between 2026 and 2035. North America leads with approximately 38% share, while Software dominates all other offerings with approximately 62% share.
We observed that growth is broad-based across every segmentation axis, with cloud-native deployment and AI-enabled forecasting driving the dominant structural shifts through 2035.
|
Key Takeaways |
|
By Offering: Software held the largest share of approximately 62% (USD 2.39 Billion) in 2025; Vendor Services is the fastest-growing sub-segment at 19.4% CAGR from 2026-2035. |
|
By Planning Domain: Supply Chain Capacity Planning held the largest share of approximately 27% (USD 1.04 Billion) in 2025; IT Capacity Planning is the fastest-growing sub-segment at 23.2% CAGR from 2026-2035. |
|
By Deployment Model: Cloud held the largest share of approximately 48% (USD 1.85 Billion) in 2025; Cloud is also the fastest-growing sub-segment at 24.2% CAGR from 2026-2035. |
|
By Organization Size: Large Enterprise held the largest share of approximately 54% (USD 2.08 Billion) in 2025; Small and Medium Business is the fastest-growing sub-segment at 24.7% CAGR from 2026-2035. |
|
By Pricing Model: Subscription held the largest share of approximately 58% (USD 2.23 Billion) in 2025; Consumption-Based is the fastest-growing sub-segment at 25.8% CAGR from 2026-2035. |
|
By Buyer Function: Supply Chain held the largest share of approximately 29% (USD 1.12 Billion) in 2025; Information Technology is the fastest-growing sub-segment at 24.2% CAGR from 2026-2035. |
|
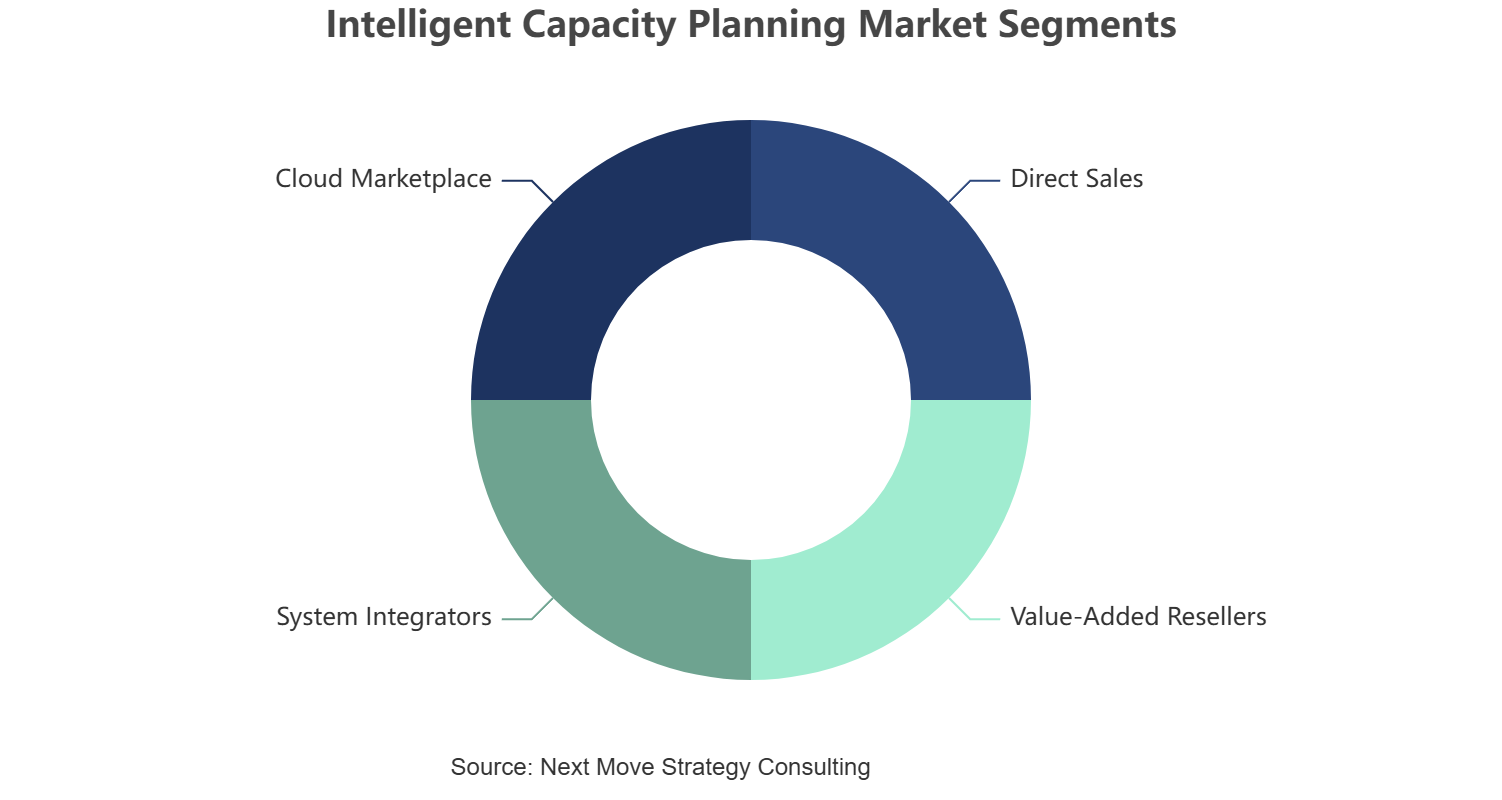
By Sales Channel: Direct Sales held the largest share of approximately 52% (USD 2.00 Billion) in 2025; Cloud Marketplace is the fastest-growing sub-segment at 28.5% CAGR from 2026-2035. |
|
By End-User Industry: Manufacturing held the largest share of approximately 36% (USD 1.39 Billion) in 2025; Technology is the fastest-growing sub-segment at 25.4% CAGR from 2026-2035. |
|
Dominant Region: North America dominated with approximately 38% revenue share (USD 1.46 Billion) in 2025. |
|
Fastest-Growing Region: Asia-Pacific is expected to register the highest CAGR of 24.8% during 2026-2035. |
|
Dominant Country: U.S. led with approximately USD 0.93 Billion in 2025. |
|
Fastest-Growing Country: India is the fastest-growing country at approximately 27.7% CAGR from 2026-2035. |
Market Opportunity: The Intelligent Capacity Planning Market is expected to create an absolute dollar opportunity of USD 21.04 billion between 2026 and 2035, presenting significant investment potential across the enterprise supply chain, manufacturing, and IT capacity planning software value chain.
According to Next Move Strategy Consulting analysis, cloud-native deployment and AI-enabled scenario simulation are structurally reshaping vendor roadmaps, with capacity planning increasingly converging with broader supply chain and workforce planning suites rather than operating as a standalone category.
What does the Intelligent Capacity Planning Market Encompass?
The Intelligent Capacity Planning Market covers software platforms, vendor services, and support offerings that help enterprises forecast, allocate, and optimize capacity across supply chain, manufacturing, workforce, project resource, and IT domains. We observed that the market has evolved from static spreadsheet-based planning toward AI-enabled, scenario-driven platforms that integrate real-time demand signals, constraint modeling, and predictive analytics, enabling organizations to respond faster to volatility in demand, labor availability, and infrastructure utilization.
Regulatory influence remains moderate and industry-specific, with data residency and export-control rules shaping cloud deployment choices in regulated sectors such as aerospace, defense, and pharmaceuticals. Our analysis shows that adoption of machine learning-based forecasting, digital twin simulation, and API-first architectures is accelerating vendor differentiation, while consumption-based pricing and cloud marketplace distribution are lowering the entry barrier for mid-market and small business buyers previously excluded from enterprise-grade capacity planning tools.
|
Parameter |
Details |
|
Market Size in 2025 |
USD 3.85 Billion |
|
Market Size in 2026 |
USD 4.65 Billion |
|
Revenue Forecast in 2035 |
USD 25.69 Billion |
|
Growth Rate |
CAGR of 20.9% from 2026 to 2035 |
|
Analysis Period |
2025-2035 |
|
Base Year Considered |
2025 |
|
Forecast Period |
2026-2035 |
|
Market Size Estimation |
USD Billion |
|
Companies Profiled |
20 |
|
Countries Covered |
38 |
|
Market Share |
Available for Top 10 Companies |
Key Emerging Trends
Our findings suggest that four structural trends are redefining how enterprises plan, deploy, and govern capacity across supply chain, manufacturing, workforce, and IT functions.
How Is AI-Driven Scenario Simulation Transforming Capacity Decisions in the Intelligent Capacity Planning Market?
AI-driven scenario simulation is replacing manual what-if analysis, letting planners model thousands of demand and resource permutations in minutes rather than days. We observed that vendors such as Kinaxis and o9 Solutions embed machine learning forecasting engines directly into planning workflows, improving forecast accuracy for supply chain and manufacturing capacity teams and reducing planning cycle time from weeks to days for large enterprise adopters.
Why Is Cloud-Native Architecture Becoming the Default Deployment Choice?
Cloud-native architecture is becoming the default deployment path as enterprises retire on-premises licenses in favor of subscription-based access. During our market evaluation, we noticed that cloud computing infrastructure enables faster scenario recalculation and multi-site visibility, with SAP SE and Oracle Corporation both prioritizing cloud-first releases for new capacity planning modules launched since 2025.
How Are Digital Twins Reshaping Manufacturing and IT Capacity Planning?
Digital twin simulation is extending beyond design into operational capacity planning, letting manufacturing and IT teams model machine, plant, and infrastructure constraints virtually before committing capital. We found that Siemens AG and Dassault Systemes SE have integrated digital twin modules into their industrial software suites, giving production planners a continuous feedback loop between shop-floor telemetry and finite capacity models used for constraint resolution.
What Role Is Workforce Analytics Playing in Capacity Convergence in the Intelligent Capacity Planning Market?
Workforce analytics is converging with traditional supply chain planning as labor shortages push HR and operations teams toward shared platforms. Our assessment indicates that human capital management data feeds are increasingly integrated with shift and skills capacity models, with Workday, Inc. extending its planning suite to unify labor capacity forecasting with financial and operational planning for enterprise customers.
Growth Drivers and Restraints
Growth Catalyst and Risk Assessment Matrix
|
Factors |
Type |
(+/-) % Impact on CAGR |
Geographic Relevance |
Impact Timeline |
|
Rising demand for AI-enabled forecasting accuracy |
Driver |
+3.2% |
Global |
2026-2035 |
|
Enterprise shift to cloud subscription models |
Driver |
+2.8% |
North America, Europe |
2026-2032 |
|
Persistent labor and skills shortages in manufacturing |
Driver |
+2.1% |
North America, Europe, APAC |
2026-2035 |
|
Growth of consumption-based and cloud marketplace pricing |
Driver |
+1.9% |
Global |
2026-2033 |
|
Rapid industrial digitization in Asia-Pacific |
Driver |
+2.4% |
Asia-Pacific |
2026-2035 |
|
High integration complexity with legacy ERP systems |
Restraint |
-1.6% |
Global |
2026-2030 |
|
Data privacy and residency constraints on cloud adoption |
Restraint |
-1.2% |
Europe, Middle East & Africa |
2026-2031 |
|
Budget constraints among small and mid-market enterprises |
Restraint |
-1.4% |
Latin America, MEA |
2026-2029 |
|
Shortage of skilled implementation and analytics talent |
Restraint |
-1.1% |
Global |
2026-2032 |
What Is the Primary Growth Driver for the Intelligent Capacity Planning Market?
The primary growth driver is enterprise demand for AI-enabled forecasting accuracy across volatile demand and supply environments. We observed that generative AI and predictive modeling capabilities are becoming baseline expectations in RFPs, with U.S. Bureau of Economic Analysis data showing enterprise software investment rising steadily since 2024, reinforcing budget availability for advanced planning tools.
How Is Cloud Migration Driving Market Growth?
Cloud migration is driving market growth by lowering deployment costs and accelerating time-to-value for mid-market buyers previously priced out of enterprise planning suites. Based on research conducted by NMSC, we found that consumption-based pricing models are expanding the addressable buyer base among Small and Medium Business organizations, a segment projected to grow at a 24.7% CAGR between 2026 and 2035, faster than any other organization-size tier.
What Is Restraining the Intelligent Capacity Planning Market?
Integration complexity with legacy Enterprise Resource Planning and manufacturing execution systems remains the primary restraint, particularly for large enterprises with decades-old infrastructure. Our analysis shows that data residency requirements under frameworks such as the European Union's General Data Protection Regulation add further friction for cloud deployment in Europe, slowing full-scale adoption among conservative buyers in regulated industries such as pharmaceuticals and financial services.
PESTEL Analysis of the Intelligent Capacity Planning Industry
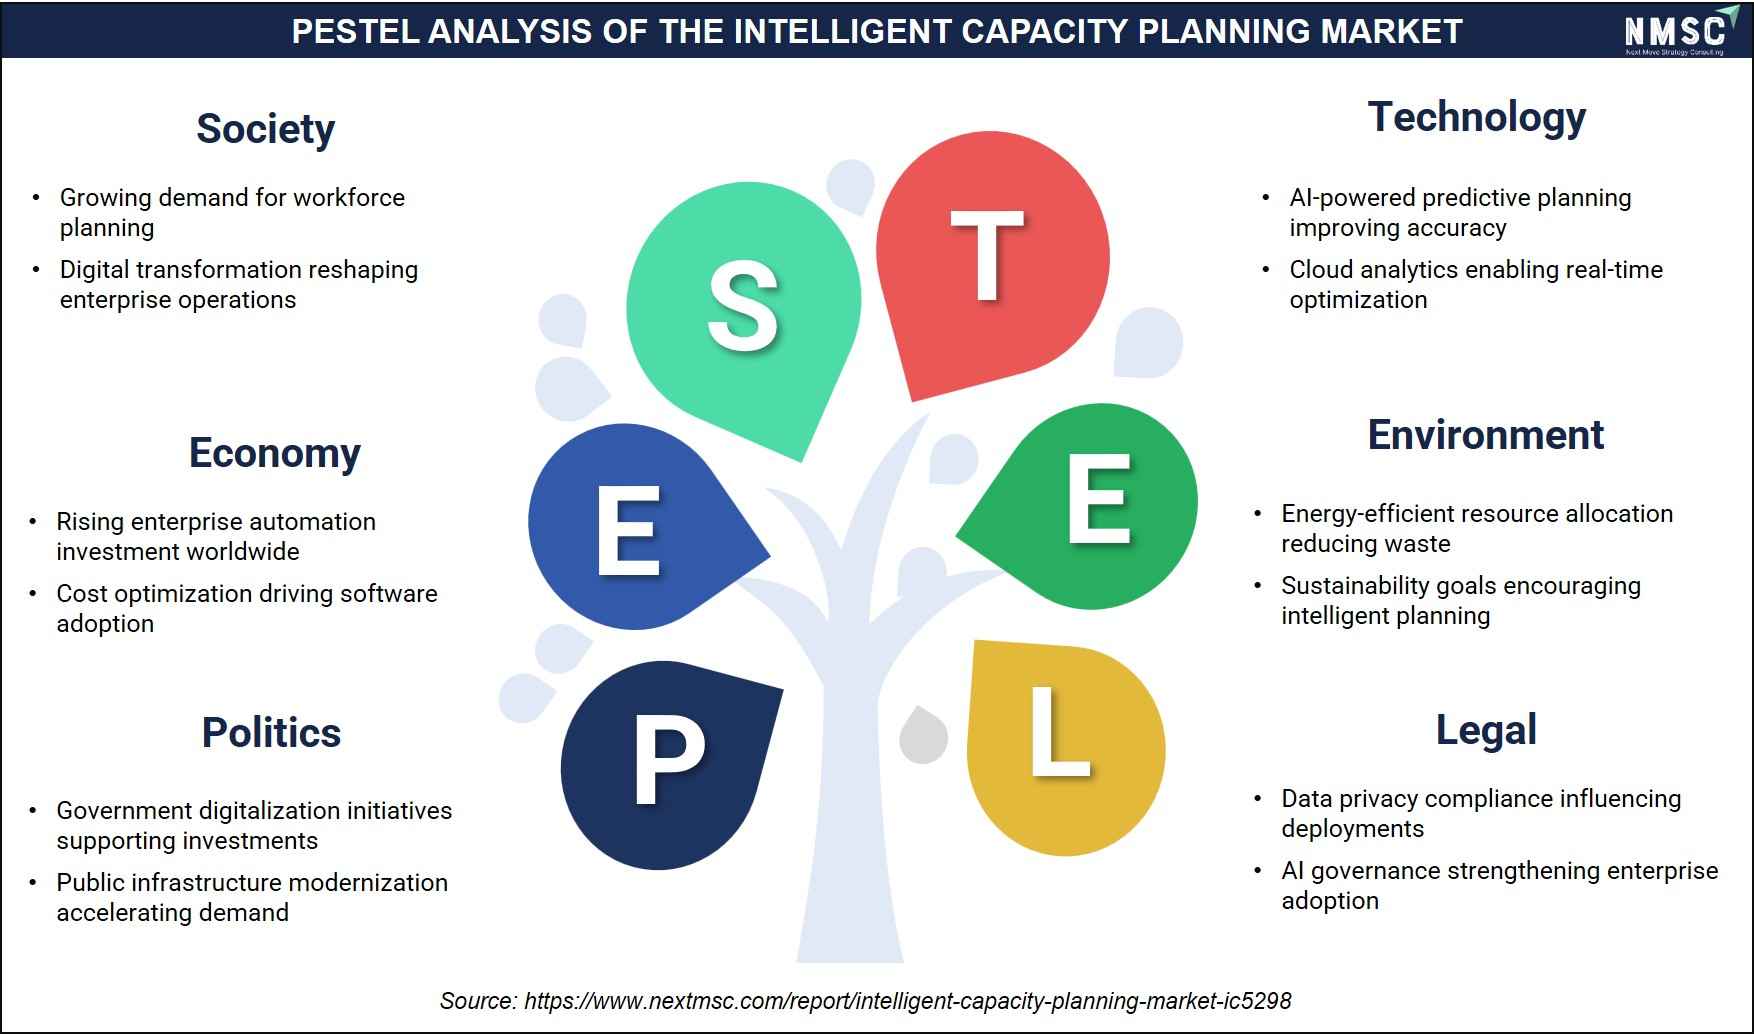
The above infographic presents a PESTEL analysis of the intelligent capacity planning market, where government digitalization and infrastructure modernization are accelerating demand, while cost optimization and rising investments are driving software adoption. Growing workforce planning needs and digital transformation are reshaping operations, supported by AI-powered predictive planning and cloud analytics that improve forecasting accuracy. Environmental benefits such as reduced waste and sustainability goals further encourage adoption, all within a legal framework of data privacy and AI governance. Looking ahead, we observed that these interconnected factors collectively shape the market's evolution across the sector.
Segmentation Analysis
Segment Sizing: By Offering
|
Segment |
2025 (USD) |
2035 (USD) |
CAGR% (2026-2035) |
|
Software |
USD 2.39 Billion |
USD 16.96 Billion |
21.8% |
|
Vendor Services |
USD 1.08 Billion |
USD 6.42 Billion |
19.4% |
|
Support |
USD 0.38 Billion |
USD 2.31 Billion |
19.4% |
|
Total |
USD 3.85 Billion |
USD 25.69 Billion |
20.9% |
Which Offering Sub-Segment Dominates the Intelligent Capacity Planning Market?
Software dominates the offering axis, contributing USD 2.39 billion in 2025 and projected to reach USD 16.96 billion by 2035. We found that cloud subscription licensing within Software is displacing on-premises deployments as vendors, including ERP software providers such as SAP SE, bundle capacity planning modules into broader cloud suites, while Vendor Services grows fastest as enterprises require deeper configuration support for AI-driven modules.
Segment Sizing: By Planning Domain
|
Segment |
2025 (USD) |
2035 (USD) |
CAGR% (2026-2035) |
|
Supply Chain Capacity Planning |
USD 1.04 Billion |
USD 6.68 Billion |
20.4% |
|
Manufacturing Capacity Planning |
USD 0.92 Billion |
USD 5.91 Billion |
20.3% |
|
Workforce Capacity Planning |
USD 0.62 Billion |
USD 3.85 Billion |
20.1% |
|
Project Resource Capacity Planning |
USD 0.46 Billion |
USD 2.83 Billion |
19.7% |
|
IT Capacity Planning |
USD 0.81 Billion |
USD 6.42 Billion |
23.2% |
|
Total |
USD 3.85 Billion |
USD 25.69 Billion |
20.9% |
Which Planning Domain Is Growing Fastest in the Intelligent Capacity Planning Market?
Supply Chain Capacity Planning remains the largest planning domain at USD 1.04 billion in 2025, while IT Capacity Planning is the fastest-growing at a 23.2% CAGR through 2035. Our findings suggest that expanding data centers footprints and cloud resource elasticity are pushing enterprises to apply capacity planning discipline to compute, storage, and network capacity with the same rigor traditionally reserved for physical supply chains.
Segment Sizing: By Deployment Model
|
Segment |
2025 (USD) |
2035 (USD) |
CAGR% (2026-2035) |
|
Cloud |
USD 1.85 Billion |
USD 15.67 Billion |
24.2% |
|
Hybrid |
USD 1.27 Billion |
USD 7.19 Billion |
18.8% |
|
On-Premises |
USD 0.73 Billion |
USD 2.83 Billion |
13.9% |
|
Total |
USD 3.85 Billion |
USD 25.69 Billion |
20.9% |
Why Does Cloud Deployment Lead the Intelligent Capacity Planning Market?
Cloud deployment leads with USD 1.85 billion in 2025 and the fastest CAGR of 24.2% through 2035, as enterprises prioritize elastic scaling and faster upgrade cycles over on-premises control. We observed that On-Premises License deployment, while still relevant for defense and highly regulated manufacturers, is contracting in relative share as vendors deprecate perpetual license roadmaps in favor of subscription-first product strategies.
Growth Opportunities
Beyond the core drivers outlined above, three forward-looking whitespace opportunities stand out for vendors and investors positioning ahead of the 2026-2035 forecast window.
Can Embedded Capacity Planning Within ERP Suites Unlock Mid-Market Growth?
Embedding capacity planning natively within core ERP suites rather than selling it as a bolt-on module creates a mechanism to reach mid-market enterprises without a standalone procurement cycle. Infor Inc. and QAD Inc. stand to benefit by cross-selling planning modules into their existing ERP customer base, converting adjacent workflow spend into incremental planning software revenue.
Does Vertical-Specific Capacity Modeling Create Differentiation for Manufacturing Buyers?
Vertical-specific capacity modeling, tuned to aerospace, automotive, or pharmaceutical constraints, creates defensible differentiation against horizontal platforms. We observed that smart manufacturing adopters in Manufacturing benefit most, as Dassault Systèmes SE and Siemens AG extend industry-specific finite capacity templates to reduce implementation time for specialized production environments.
Can Cloud Marketplace Distribution Accelerate Small Business Adoption in the Intelligent Capacity Planning Market?
Cloud marketplace distribution through hyperscaler storefronts lowers procurement friction for Small and Medium Business buyers who lack dedicated software evaluation teams. This channel benefits vendors such as ToolsGroup Holding Ltd. and Planview, Inc. by shortening sales cycles and enabling self-service trials, directly supporting the 28.5% CAGR projected for the Cloud Marketplace sales channel through 2035.
Regional Outlook
|
Region |
2025 (USD) |
2035 (USD) |
CAGR% (2026-2035) |
Key Driver |
|
North America |
USD 1.46 Billion |
USD 8.48 Billion |
19.0% |
Enterprise cloud modernization |
|
Europe |
USD 1.04 Billion |
USD 6.17 Billion |
19.3% |
Regulatory-driven supply chain resilience |
|
Asia-Pacific |
USD 0.92 Billion |
USD 8.22 Billion |
24.8% |
Manufacturing digitization |
|
Middle East & Africa |
USD 0.23 Billion |
USD 1.54 Billion |
20.9% |
Infrastructure diversification investment |
|
Latin America |
USD 0.20 Billion |
USD 1.28 Billion |
21.0% |
Logistics network expansion |
|
Total |
USD 3.85 Billion |
USD 25.69 Billion |
20.9% |
— |
North America Intelligent Capacity Planning Market
North America remains the most mature market, anchored by early cloud adoption and a dense concentration of headquarters for vendors such as IBM, Microsoft Corporation, and Manhattan Associates, Inc. Regulatory influence is moderate, centered on data privacy compliance rather than sector-specific mandates. We observed that AI-enabled scenario planning adoption is highest here, with enterprises pursuing consolidation of capacity planning with financial planning platforms as a strategic priority through 2035.
Europe Intelligent Capacity Planning Market
Europe's market is shaped by regulatory emphasis on supply chain resilience following recent geopolitical disruptions, pushing manufacturers toward diversified supplier capacity models. Our analysis shows that data residency rules under the General Data Protection Regulation moderate the cloud adoption pace relative to North America, favoring hybrid deployment. Technology adoption is strong in Germany's automotive and industrial equipment sectors, supporting steady long-term demand growth.
Asia-Pacific Intelligent Capacity Planning Market
Asia-Pacific is the fastest-growing region at a 24.8% CAGR, driven by rapid manufacturing digitization across China, India, and South Korea. We found that Industry 4.0 initiatives backed by national industrial policy are accelerating finite capacity and machine capacity planning adoption, with competitive intensity rising as domestic software vendors challenge established multinational players for mid-market accounts.
Middle East & Africa Intelligent Capacity Planning Market
Middle East & Africa shows early-stage but accelerating adoption, led by infrastructure diversification investment in the UAE and Saudi Arabia under national economic transformation programs. Regulatory influence remains light, and technology adoption is concentrated among large enterprises in energy, construction, and logistics. Strategic outlook favors continued cloud-first deployment as regional data center capacity expands to support local hosting requirements.
Latin America Intelligent Capacity Planning Market
Latin America's market remains nascent relative to other regions, with Brazil accounting for the largest share amid growing logistics network expansion. Regulatory influence is limited, and technology adoption is concentrated among large enterprises in manufacturing and wholesale distribution. Competitive intensity is moderate, with global vendors relying primarily on system integrator partnerships to reach the regional buyer base through 2035.
U.S. Intelligent Capacity Planning Market
Based on our estimates, the U.S. Intelligent Capacity Planning Market was valued at approximately USD 0.93 billion in 2025 and is projected to reach USD 5.09 billion by 2035, growing at an 18.3% CAGR. Demand is concentrated among large enterprises in manufacturing and technology, with high cloud adoption and strong competitive intensity among domestic vendors, including IBM, Microsoft, and Manhattan Associates, shaping a mature, innovation-led strategic outlook.
Canada Intelligent Capacity Planning Market
The market in Canada was valued at roughly USD 0.35 billion in 2025 and is projected to reach USD 2.20 billion by 2035, expanding at a 20.2% CAGR. Demand structure favors mid-market manufacturing and logistics buyers, with moderate regulatory influence tied to federal data governance guidelines. Technology adoption is steady, and strategic outlook favors partnerships between global vendors and regional system integrators.
UK Intelligent Capacity Planning Market
The market in the UK Intelligent Capacity Planning Market stood near USD 0.27 billion in 2025 and is forecast to reach USD 1.54 billion by 2035, at an 18.7% CAGR. Adoption is concentrated in financial services and professional services buyer functions, with regulatory influence from UK data protection law shaping hybrid deployment preference. Competitive intensity is high given dense vendor presence across London's enterprise software corridor.
Germany Intelligent Capacity Planning Market
Germany's market was valued at approximately USD 0.25 billion in 2025, projected to reach USD 1.48 billion by 2035, growing at a 19.4% CAGR. Demand is led by automotive and industrial equipment manufacturers applying finite and machine capacity planning. Regulatory influence from German data protection authorities favors on-premises and hybrid models, while technology adoption remains strong among large industrial conglomerates such as Siemens AG.
France Intelligent Capacity Planning Market
As per our estimate, the France Intelligent Capacity Planning Market was valued near USD 0.18 billion in 2025 and is projected to reach USD 1.05 billion by 2035, at a 19.6% CAGR. Aerospace and defense manufacturing drives demand structure, with Dassault Systèmes SE maintaining a strong domestic presence. Regulatory influence remains moderate, and strategic outlook favors continued adoption of digital twin-integrated manufacturing capacity planning tools.
China Intelligent Capacity Planning Market
China's market was valued at approximately USD 0.31 billion in 2025 and is projected to reach USD 2.63 billion by 2035, growing at a 24.0% CAGR. Demand structure is dominated by electronics and industrial equipment manufacturers scaling production capacity, planning under national industrial policy. Regulatory influence includes data localization requirements shaping deployment choices, while competitive intensity is rising as domestic software vendors expand into enterprise accounts.
India Intelligent Capacity Planning Market
According to our analysis, India is the fastest-growing country covered, valued at roughly USD 0.17 billion in 2025 and projected to reach USD 1.89 billion by 2035, at a 27.7% CAGR. Demand is led by IT services and manufacturing buyers adopting cloud-first capacity planning to support rapid workforce and project resource scaling. Regulatory influence is light, and strategic outlook favors continued growth through system integrator and cloud marketplace channels.
Japan Intelligent Capacity Planning Market
Japan's market stood near USD 0.17 billion in 2025 and is forecast to reach USD 1.23 billion by 2035, at a 22.4% CAGR. Demand structure centers on automotive and electronics manufacturing capacity planning, with strong technology adoption among established industrial conglomerates. Regulatory influence remains moderate, and competitive intensity favors vendors offering deep integration with existing manufacturing execution infrastructure.
South Korea Intelligent Capacity Planning Market
Based on our estimates, South Korea's Intelligent Capacity Planning Market was valued at approximately USD 0.11 billion in 2025 and is projected to reach USD 1.07 billion by 2035, growing at a 26.4% CAGR. Electronics and semiconductor manufacturing drives demand, with high technology adoption and strong regulatory support for industrial digitization. Strategic outlook favors continued investment in machine and finite capacity planning tools among leading conglomerates.
Australia Intelligent Capacity Planning Market
Australia's market was valued near USD 0.08 billion in 2025 and is projected to reach USD 0.66 billion by 2035, at a 23.3% CAGR. Demand structure favors mining, logistics, and construction buyer functions, with moderate regulatory influence and growing cloud adoption. Competitive intensity remains moderate, with global vendors relying on regional system integrator partnerships to serve mid-market enterprises.
UAE Intelligent Capacity Planning Market
The market in the UAE Intelligent Capacity Planning Market was valued at approximately USD 0.07 billion in 2025 and is projected to reach USD 0.46 billion by 2035, at a 19.9% CAGR. Demand is concentrated in logistics, construction, and energy sectors under national economic diversification programs. Regulatory influence is light, and technology adoption is accelerating as regional cloud infrastructure investment expands.
Saudi Arabia Intelligent Capacity Planning Market
Saudi Arabia's market stood near USD 0.06 billion in 2025 and is forecast to reach USD 0.45 billion by 2035, at a 21.2% CAGR. Demand structure is led by energy and construction sector capacity planning tied to national industrial transformation initiatives. Regulatory influence is moderate, with data localization preferences shaping deployment choices, while strategic outlook favors continued large enterprise adoption.
South Africa Intelligent Capacity Planning Market
As per our estimate, South Africa's market was valued at approximately USD 0.04 billion in 2025 and is projected to reach USD 0.26 billion by 2035, at a 20.1% CAGR. Demand is concentrated among large enterprises in mining, manufacturing, and logistics. Regulatory influence remains light, and technology adoption is gradual, with a strategic outlook favoring partnerships between global vendors and regional resellers.
Brazil Intelligent Capacity Planning Market
Brazil's market was valued near USD 0.09 billion in 2025 and is projected to reach USD 0.54 billion by 2035, growing at a 20.6% CAGR. Demand structure favors manufacturing and wholesale distribution buyers expanding distribution capacity planning amid logistics network growth. Regulatory influence is moderate under national data protection law, and competitive intensity is increasing as global vendors deepen local partnerships.
Argentina Intelligent Capacity Planning Market
According to our analysis, Argentina's market stood at approximately USD 0.04 billion in 2025 and is forecast to reach USD 0.29 billion by 2035, at a 21.6% CAGR. Demand is concentrated among large agribusiness and manufacturing enterprises. Regulatory influence remains light, and technology adoption is gradual, with a strategic outlook favoring cloud-based deployment to reduce upfront infrastructure investment.
Strategic Framework Analysis of the Intelligent Capacity Planning Industry
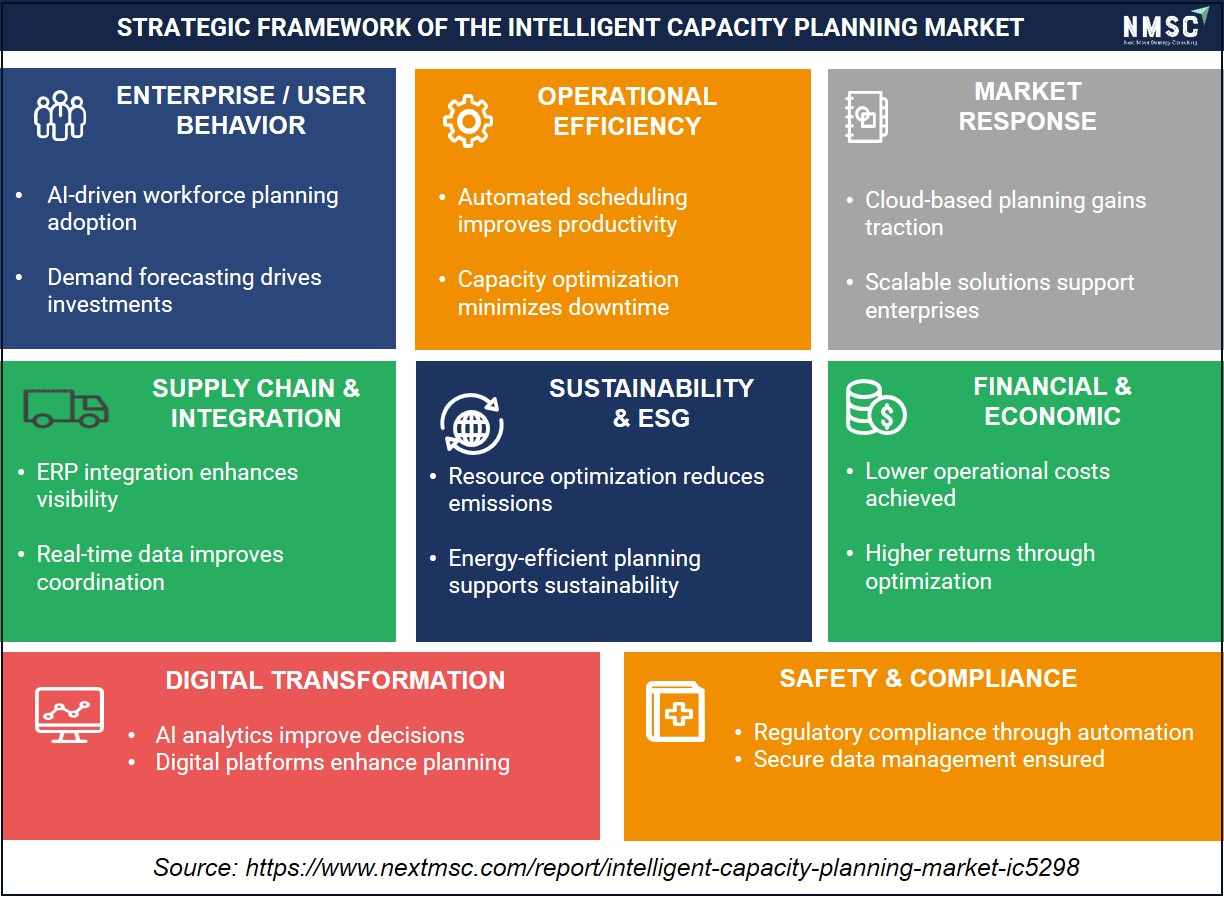
The above infographic presents a strategic framework of the intelligent capacity planning market, covering enterprise behavior, supply chain, operational efficiency, sustainability, market response, finance, digital transformation, and compliance. AI-driven workforce planning and demand forecasting are driving investments, supported by ERP integration and real-time data that enhance visibility and coordination. Automated scheduling and capacity optimization are improving productivity and minimizing downtime, while resource and energy efficiency are supporting sustainability goals. Cloud-based solutions are gaining traction, and lower operational costs are delivering higher returns. Looking ahead, we observed that AI analytics and digital platforms are enhancing decision-making, with regulatory compliance and secure data management ensuring responsible deployment across the market.
Competitive Landscape
Our assessment indicates that the competitive landscape spans diversified enterprise software conglomerates and specialized capacity planning vendors, each pursuing distinct differentiation strategies across the 2026-2035 forecast window.
|
Dimension |
Assessment |
|
Market Structure |
Moderately fragmented, with the top ten companies holding a meaningful but non-dominant combined share |
|
Innovation Focus |
AI-enabled forecasting, digital twin simulation, and cloud-native scenario modeling |
|
M&A Activity |
Selective acquisitions of niche AI and analytics vendors to accelerate product roadmaps |
How Do Companies Compete in the Intelligent Capacity Planning Market?
Companies compete primarily on forecasting accuracy, breadth of planning domain coverage, and depth of integration with existing ERP and supply chain systems. We observed that diversified vendors such as SAP SE and Oracle Corporation compete on platform breadth, while specialists such as Kinaxis Inc. and o9 Solutions, Inc. compete on planning-specific depth, forcing continuous investment in AI differentiation to defend account share.
Which Competitive Archetypes Dominate the Market?
Two archetypes dominate: platform incumbents bundling capacity planning within broader ERP or supply chain suites, and pure-play specialists offering deeper domain-specific modeling. Our findings suggest bundling appeals to large enterprises seeking single-vendor consolidation, while specialists such as ToolsGroup Holding Ltd. and ProxSee-style focused vendors win on superior forecast accuracy and faster time-to-value for mid-market buyers prioritizing quick deployment.
What Innovation and Differentiation Strategies Are Vendors Pursuing?
Vendors are pursuing differentiation through embedded robotic process automation for planning workflow execution, alongside AI copilots that translate natural-language queries into capacity scenarios. We found that pricing strategy is shifting toward consumption-based models to reduce adoption friction, while geographic expansion is prioritizing Asia-Pacific given its 24.8% regional CAGR through 2035.
How Active Is M&A in the Competitive Landscape?
M&A activity remains selective but consistent, concentrated on acquiring niche AI, analytics, and vertical-specific capacity modeling firms rather than on large horizontal consolidation. Based on research conducted by NMSC, we found that acquirers prioritize targets with proprietary forecasting algorithms or deep vertical domain expertise, using acquisitions to compress product development timelines rather than to eliminate direct competitors from the market.
Key Market Players
We observed that the following twenty companies represent the core competitive set shaping product innovation, geographic expansion, and pricing strategy across the Intelligent Capacity Planning Market.
-
Blue Yonder Holding, Inc.
-
Kinaxis Inc.
-
o9 Solutions, Inc.
-
Infor Inc.
-
Dassault Systemes SE
-
Siemens AG
-
International Business Machines Corporation
-
Microsoft Corporation
-
Anaplan, Inc.
-
Manhattan Associates, Inc.
-
OMP NV
-
ToolsGroup Holding Ltd.
-
Aptean, Inc.
-
QAD Inc.
-
Workday, Inc.
-
Planview, Inc.
-
Deltek, Inc.
-
WiseTech Global Limited
Latest Developments
We found that recent product and partnership announcements underscore accelerating vendor investment in AI-enabled and cloud-native capacity planning capabilities.
|
Date |
Event |
|
October 2025 |
SAP announced AI-driven enhancements to SAP Integrated Business Planning (IBP), including unified scenario simulations, embedded AI, and characteristic-based supply planning to optimize stock and capacity matching. |
Investment Opportunities
Where Are Capital Inflows Concentrated in the Market?
Capital inflows are concentrated in AI and machine learning-native planning startups, with venture and private equity investors targeting firms offering vertical-specific forecasting accuracy. Our analysis shows that established players are increasingly funding internal AI research divisions, reflecting confidence in the segment's 20.9% CAGR through 2035 as a durable, fundamentals-supported growth trajectory rather than a short-term cyclical uptick.
How Significant Is Infrastructure Investment Supporting Market Growth?
Infrastructure investment supporting cloud and edge computing capacity underpins the market's Cloud deployment growth, projected at a 24.2% CAGR through 2035. We observed that hyperscale data center expansion across Asia-Pacific and the Middle East is directly enabling faster regional adoption of cloud-native capacity planning platforms among enterprise and mid-market buyers alike.
What ESG Considerations Are Shaping Investment Decisions?
Environmental, Social, and Governance considerations increasingly factor into vendor and buyer decisions, as capacity optimization directly reduces energy waste in manufacturing and IT operations. Our assessment indicates that investors favor vendors demonstrating measurable energy efficiency gains from optimized machine and compute capacity utilization, aligning capacity planning software adoption with broader corporate sustainability reporting requirements across large enterprise customers.
Key Benefits for Stakeholders
How Does This Report Benefit Enterprise and Industry Leaders?
Enterprise and industry leaders gain access to segment-level revenue forecasts across offering, planning domain, and deployment axes, enabling informed prioritization of internal capacity planning investment. Our analysis shows that benchmarking against the 20.9% market CAGR through 2035 helps operations and IT leaders justify budget allocation relative to peers, while regional data supports geographic expansion and vendor selection decisions.
How Does This Report Benefit Investors and Financial Analysts?
Investors and financial analysts benefit from reconciled market sizing across twenty companies and thirty-eight countries, supporting due diligence on competitive positioning and growth trajectory. NMSC's analysis indicates that the report's segment-level CAGR data, including the 24.7% growth rate for Small and Medium Business adoption, helps identify underappreciated growth pockets ahead of broader market recognition.
How Does This Report Benefit Technology Vendors and Product Teams?
Technology vendors and product teams gain visibility into which planning domains and deployment models are growing fastest, directly informing product roadmap and go-to-market prioritization. Our findings suggest that the report's competitive landscape and latest developments sections help product teams benchmark feature investment against direct competitors, reducing the risk of misallocating R&D spend toward slower-growing segments.
Key Market Segments
By Offering
-
Software
-
Cloud Subscription
-
Public Cloud
-
Private Cloud
-
-
On-Premises License
-
-
Vendor Services
-
Implementation
-
Integration
-
Configuration
-
Data Migration
-
Training
-
Optimization
-
-
Support
-
Maintenance
-
Technical Support
-
By Planning Domain
-
Supply Chain Capacity Planning
-
Supplier Capacity
-
Production Capacity
-
Inventory Capacity
-
Distribution Capacity
-
-
Manufacturing Capacity Planning
-
Finite Capacity
-
Plant Capacity
-
Machine Capacity
-
Production Constraint
-
-
Workforce Capacity Planning
-
Labor Capacity
-
Shift Capacity
-
Skills Capacity
-
-
Project Resource Capacity Planning
-
Professional Services Capacity
-
Engineering Capacity
-
Construction Capacity
-
-
IT Capacity Planning
-
Compute Capacity
-
Storage Capacity
-
Network Capacity
-
Cloud Resource Capacity
-
By Deployment Model
-
Cloud
-
Hybrid
-
On-Premises
By Organization Size
-
Large Enterprise
-
Mid-Market Enterprise
-
Small and Medium Business
By Pricing Model
-
Subscription
-
Perpetual License
-
Consumption-Based
-
Professional Services Fees
By Buyer Function
-
Supply Chain
-
Manufacturing Operations
-
Project Management Office
-
Human Resources
-
Finance
-
Information Technology
-
Executive Management
By Sales Channel
-
Direct Sales
-
Value-Added Resellers
-
System Integrators
-
Cloud Marketplace
By End-User Industry
-
Manufacturing
-
Automotive
-
Aerospace and Defense
-
Electronics
-
Industrial Equipment
-
Chemicals
-
Food and Beverage
-
Pharmaceuticals
-
Consumer Goods
-
Other Manufacturing
-
-
Retail
-
Wholesale Distribution
-
Logistics and Transportation
-
Healthcare
-
Life Sciences
-
Energy and Utilities
-
Financial Services
-
Technology
-
Telecommunications
-
Public Sector
-
Construction
-
Professional Services
-
Other Industries
By Region
-
North America: U.S., Canada, Mexico
-
Europe: UK, Germany, France, Italy, Spain, Sweden, Denmark, Finland, Netherlands, Rest of Europe
-
Asia-Pacific: China, India, Japan, South Korea, Taiwan, Indonesia, Vietnam, Australia,Philippines, Malaysia, Rest of APAC
-
Middle East & Africa: Saudi Arabia, UAE, Egypt, Israel, Turkey, Nigeria, South Africa, Rest of MEA
-
Latin America: Brazil, Argentina, Chile, Colombia, Rest of LATAM
Conclusion & Recommendations
What Is the Long-Term Outlook for the Market?
The long-term outlook remains firmly positive, with the market projected to grow from USD 4.65 billion in 2026 to USD 25.69 billion by 2035 at a 20.9% CAGR. We observed that this trajectory is underpinned by structural enterprise demand for AI-enabled planning rather than short-term cyclical spending, suggesting durable growth continuing well beyond the current forecast window as digitization deepens across manufacturing and services industries.
What Strategic Positioning Should Vendors Pursue?
Vendors should prioritize cloud-native architecture and AI-embedded forecasting as baseline requirements, while pursuing vertical-specific differentiation for manufacturing and IT capacity domains. Our assessment indicates that mid-sized vendors without hyperscaler cloud partnerships face a competitive disadvantage, making strategic alliances with cloud marketplace platforms an increasingly important positioning lever heading into the later years of the forecast period.
How Attractive Is the Market for New Investment?
Investment attractiveness is high given the market's 20.9% blended CAGR and the even faster 24.7% growth projected for Small and Medium Business adoption. NMSC's analysis indicates that investors seeking exposure to enterprise AI adoption without direct infrastructure risk find capacity planning software an efficient proxy, given its cross-industry applicability across manufacturing, IT, and workforce planning use cases.
What Market Shifts and Key Risks Should Stakeholders Monitor?
Key risks include integration complexity with legacy systems and data residency constraints that could slow cloud migration in regulated markets. Our findings suggest stakeholders should monitor consolidation activity among mid-tier vendors, as continued M&A could concentrate market share among fewer, larger platforms, potentially compressing differentiation opportunities for smaller specialized providers over the remainder of the forecast period.
What Are the Clearest Growth Pathways Through 2035?
The clearest growth pathways run through IT Capacity Planning, Cloud deployment, and Small and Medium Business adoption, the three fastest-growing classifications identified in this analysis. Based on research conducted by NMSC, we found that vendors aligning product investment with these three vectors are best positioned to outpace the market's blended 20.9% CAGR and capture a disproportionate share of the USD 21.04 billion absolute opportunity through 2035.
About the Author
 Mayurima Roy
— Mayurima Roy is Research Analyst at Next Move Strategy Consulting, where she has spent 4 years working across the firm's full industry coverage rather than a single fixed vertical. Her work centers on structured research, ongoing trend tracking, competitive assessment, and insight-led content development, translating complex market data into clear, decision-ready narratives that support informed client decision-making across diverse global industries, market sectors, and world regions every day.
Mayurima Roy
— Mayurima Roy is Research Analyst at Next Move Strategy Consulting, where she has spent 4 years working across the firm's full industry coverage rather than a single fixed vertical. Her work centers on structured research, ongoing trend tracking, competitive assessment, and insight-led content development, translating complex market data into clear, decision-ready narratives that support informed client decision-making across diverse global industries, market sectors, and world regions every day.
About the Reviewer
 Supradip Baul
— Supradip Baul is an accomplished business consultant and strategist with over a decade of rich experience in market intelligence, strategy, technology, and business transformation. His work has included rigorous qualitative and quantitative analysis across multiple industries, helping clients shape investment decisions and long-term roadmaps. Earlier in his career, he was associated with Gartner, where he contributed to industry-leading reports and market share analyses. He has worked with leading global companies and holds an MBA with a dual specialization in Marketing and Finance.
Supradip Baul
— Supradip Baul is an accomplished business consultant and strategist with over a decade of rich experience in market intelligence, strategy, technology, and business transformation. His work has included rigorous qualitative and quantitative analysis across multiple industries, helping clients shape investment decisions and long-term roadmaps. Earlier in his career, he was associated with Gartner, where he contributed to industry-leading reports and market share analyses. He has worked with leading global companies and holds an MBA with a dual specialization in Marketing and Finance.
At Next Move Strategy Consulting, we understand that insightful market research is the cornerstone of successful business decisions. That's why we employ a robust and multifaceted approach, combining various methodologies to deliver the most accurate and actionable data for our clients.

Research Landscape
We navigate the world of research with two primary approaches:
Qualitative Approach
Our qualitative research methodologies involve immersive techniques such as in-depth interviews, focus groups, and observational studies. By engaging directly with individuals and stakeholders, we uncover valuable insights that quantitative data alone may overlook.

Quantitative Research
In tandem with qualitative methodologies, NMSC leverages the power of Quantitative Research to provide a robust foundation of numerical insights. Through systematic data collection and analysis, we quantify patterns, preferences, and market trends, offering a comprehensive view of the business landscape.
Our quantitative research approach employs diverse tools, including surveys, experiments, and statistical modelling. These methodologies enable us to gather data from a large and representative sample, ensuring the statistical significance of our findings. By employing structured questionnaires and standardized data collection methods, we guarantee the reliability and validity of the information we present to our clients.
Quantitative research is particularly effective in measuring the prevalence of trends, assessing market size, and gauging the impact of various factors on consumer behavior. The numerical precision attained through this approach equips our clients with actionable insights, facilitating data-driven decision-making and strategy formulation.


Our Specialized Toolbox for Industry-Specific Market Research
We deploy a specialized arsenal of techniques tailored to meet your unique requirements. Here's a glimpse into our comprehensive toolbox:

Information Procurement
The stage entails acquiring market data or relevant information through various sources and methodologies.


Market Research Approach
We utilize both top-down and bottom-up approaches in market research analysis to achieve a comprehensive understanding of the market dynamics, leveraging the broad perspective of industry trends and macroeconomic factors alongside detailed insights from specific segments and individual companies.

Porters Five Forces Analysis
We conduct Porter's Five Forces analysis to evaluate the competitive landscape of an industry, providing us with insights into factors that affect profitability and strategic positioning.

SWOT Analysis

Forecasting
We utilize a forecasting model to predict future consumption by considering parameters like population, economics, regulations, market competition, drivers, constraints, technology, and pricing. We also employ statistical techniques such as multilinear regression, exponential smoothing, moving average, ARIMA, and Monte Carlo simulations for accurate predictions. In econometric forecasting, we analyzed short-term and long-term event impacts, attributing values based on regulatory frameworks, economic factors, and market events.





 Speak to Our Analyst