Maritime Reconnaissance and Surveillance Technology Market by Component (Hardware (Radar, Sensors, AIS Receiver, Camera, SONOBUOYS/Sonar, and Others), Software, Services (Manage Services/Maintenance, Integration and Implementation, Training and Consulting)), by Platform (Airborne (Unmanned Aerial Vehicle, Maritime Patrol Aircraft (MPA), and Aerostat), Surface Ships, Under Water Vehicle (Submarine and Underwater Drones)): Global Opportunity Analysis and Industry Forecast, 2020 – 2030
Industry: Aerospace & Defense | Publish Date: 05-Dec-2024 | No of Pages: 437 | No. of Tables: 250 | No. of Figures: 220 | Format: PDF | Report Code : AD376
Market Definition:
At an estimated value of over USD 29.46 billion in 2019, the Global Maritime Reconnaissance and Surveillance Technology Market is predicted to thrive at a CAGR of 5.5% and valued at over USD 48.93 billion over the forecast year 2020-2030. The maritime reconnaissance and surveillance technology is a feedback system which consists of deployment of surveillance assets. The information collected from these assets is compiled into a Recognized Maritime Picture (RMP). Hence, the reconnaissance and surveillance technologies have become the key to develop accurate and clear maritime situational awareness. The rapid technological advancements has led to the shift in the way maritime forces manage and utilize Intelligence, Surveillance and Reconnaissance (ISR) capabilities.
Market Dynamics and Trends:
Factors such as the increased prevalence of piracy & terrorism, maritime conflicts amongst the countries, and the presence of high-value commercial assets in oceans drive maritime reconnaissance and surveillance technology market. In addition to this, rise in international trade through sea along with the increased security concerns propels the growth of the market. However, significant decrease in military spending in several countries owing to the economic slowdown caused by COVID-19 pandemic hampers the market growth. On the other hand, growth in adoption of advanced patrol boats, Unmanned Aerial Vehicles (UAVs), and Maritime Patrol Aircraft (MPAs) to improve maritime security by numerous countries around the globe creates lucrative opportunities for the market growth.
Market Segmentations and Scope of the Study:
The global maritime reconnaissance and surveillance technology market share is segmented on the basis of component, platform, and geography. On the basis of component, the market is categorized into hardware (radar, sensors, AIS receiver, camera, SONOBUOYS/sonar, and others), software, and services (manage services/maintenance, integration and implementation, training and consulting). According to the platform, the market is divided into airborne (unmanned aerial vehicle, maritime patrol aircraft (MPA), and aerostat), surface ships, and under water vehicle (submarine and underwater drones. Geographic fragmentation and analysis of each segment includes regions comprising North America, Europe, Asia Pacific and RoW.
Geographical Analysis:
In terms of geography, North America held major share of the market in 2019. This is attributed to the increasing deployment of advanced maritime surveillance systems along with the high government spending on defense sector. In addition to this, Canada has the longest coastline of about 202,080 kilometers; hence, the maritime industry of Canada would exhibit huge demand for maritime reconnaissance and surveillance technology. However, Asia pacific is expected to witness highest growth rate as the sea-borne terrorism has emerged as one of the major security threats across littoral-Asia.
Competitive Landscape:
Lucrative growth opportunities make the maritime reconnaissance and surveillance technology market highly competitive. Some of the major players in the market are Boeing, Kongsberg Gruppen, SAAB, Thales SA, Raytheon Technologies, Indra Sistemas, Rheinmetall Air Defence, Kawasaki Heavy Industries, Ltd., Terma, and Elbit Systems and many more. A number of developmental strategies have been adopted by companies in the past few years. For instance, in February 2020, Boeing signed an agreement with Air Works, the Indian aviation service provider for the repair, maintenance, and overhaul (MRO) of Boeing’s key defense platforms in India. Under this agreement, Boeing initiated maintenance project for P-8I Aircraft, a multimission maritime patrol aircraft of Indian Navy.
Moreover, in October 2019, Raytheon Company collaborated with Korean Air to pursue the Intelligence Surveillance Target Acquisition and Reconnaissance program of Republic of Korea’s Air Force. Under the program, Raytheon is projected to be the prime contractor to provide multiple-intelligence, or Multi-INT technologies for the aircraft.
Key Benefits:
-
The maritime reconnaissance and surveillance technology market report provides the quantitative analysis of the current market and estimations through 2020-2030 that assists in identifying the prevailing market opportunities to capitalize on.
-
The study comprises an extensive analysis of the maritime reconnaissance and surveillance technology market trend including the current and future trends for depicting the prevalent investment pockets in the market
-
The information related to key drivers, restraints and opportunities and their impact on the maritime reconnaissance and surveillance technology market is provided in the report.
-
The market share of the players in the global maritime reconnaissance and surveillance technology market along with their competitive analysis.
-
Value chain analysis in the market study provides a clear picture of the stakeholders’ roles.
Key Market Segments:
By Component
-
Hardware
-
Radar
-
Sensors
-
AIS Receiver
-
Camera
-
SONOBUOYS/Sonar
-
Others
-
-
Software
-
Services
-
Manage Services/Maintenance
-
Integration and Implementation
-
Training and Consulting
-
By Platform
-
Airborne
-
Unmanned Aerial Vehicle
-
Maritime Patrol Aircraft (MPA)
-
Aerostat
-
-
Surface Ships
-
Under Water Vehicle
-
Submarine
-
Underwater Drones
-
By Geography
-
North America
-
U.S
-
Canada
-
Mexico
-
-
Europe
-
UK
-
Germany
-
France
-
Spain
-
Italy
-
Netherlands
-
Denmark
-
Finland
-
Norway
-
Sweden
-
Russia
-
Rest of Europe
-
-
Asia-Pacific
-
China
-
Japan
-
India
-
South Korea
-
Australia
-
Indonesia
-
Singapore
-
Taiwan
-
Thailand
-
Rest of Asia-Pacific
-
-
RoW
-
Latin America
-
Middle East
-
Africa
-
Key Players:
-
Boeing
-
Kongsberg Gruppen
-
SAAB
-
Thales SA
-
Raytheon Technologies
-
Indra Sistemas
-
Rheinmetall Air Defence
-
Kawasaki Heavy Industries, Ltd.
-
Terma
-
Elbit Systems
REPORT SCOPE AND SEGMENTATION:
|
Parameters |
Details |
|
Analysis Period |
2019–2030 |
|
Base Year Considered |
2020 |
|
Forecast Period |
2020–2030 |
|
Market Size Estimation |
Billion (USD) |
|
Market Segmentation |
By Component (Hardware, Software, Services) By Platform (Airborne, Surface Ships) |
|
Countries Covered |
28 |
|
Companies Profiled |
Boeing, Kongsberg Gruppen, SAAB, Thales SA, Raytheon Technologies, Indra Sistemas, Rheinmetall Air Defence, Kawasaki Heavy Industries, Ltd., Terma, and Elbit Systems |
")


About the Author
 Jayanta Das is an industry analyst and writer with a keen focus on emerging technologies and sustainable business practices. With a background in engineering and market research, he brings analytical depth to topics like renewable energy, green manufacturing, and industrial transformation. Jayanta is passionate about translating complex data into actionable insights for businesses navigating the shift toward eco-conscious operations.
About the Reviewer
 Supradip Baul is an accomplished business consultant and strategist with over a decade of rich experience in market intelligence, strategy, technology and business transformation. His work has included rigorous qualitative and quantitative analysis across multiple industries, helping clients shape investment decisions and long-term roadmaps. Earlier in his career, he was associated with Gartner, where he contributed to industry-leading reports and market share analyses. He has worked with leading global companies and holds an MBA with a dual specialization in Marketing and Finance.
At Next Move Strategy Consulting, we understand that insightful market research is the cornerstone of successful business decisions. That's why we employ a robust and multifaceted approach, combining various methodologies to deliver the most accurate and actionable data for our clients.
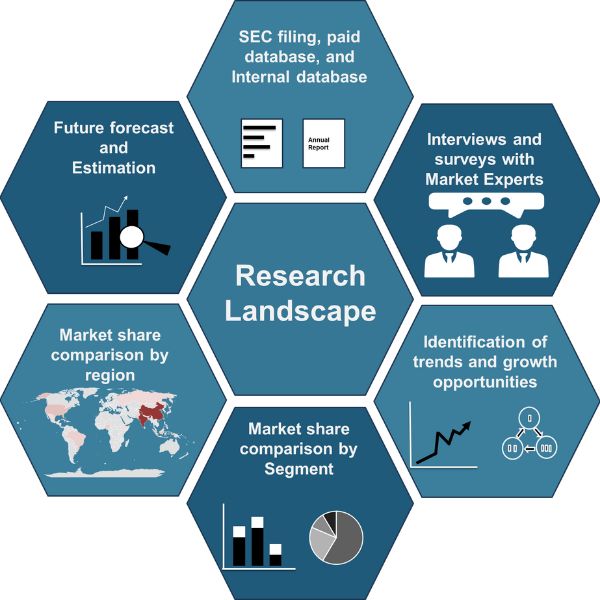
Research Landscape
We navigate the world of research with two primary approaches:
Qualitative Approach
Our qualitative research methodologies involve immersive techniques such as in-depth interviews, focus groups, and observational studies. By engaging directly with individuals and stakeholders, we uncover valuable insights that quantitative data alone may overlook.
Quantitative Research
In tandem with qualitative methodologies, NMSC leverages the power of Quantitative Research to provide a robust foundation of numerical insights. Through systematic data collection and analysis, we quantify patterns, preferences, and market trends, offering a comprehensive view of the business landscape.
Our quantitative research approach employs diverse tools, including surveys, experiments, and statistical modelling. These methodologies enable us to gather data from a large and representative sample, ensuring the statistical significance of our findings. By employing structured questionnaires and standardized data collection methods, we guarantee the reliability and validity of the information we present to our clients.
Quantitative research is particularly effective in measuring the prevalence of trends, assessing market size, and gauging the impact of various factors on consumer behavior. The numerical precision attained through this approach equips our clients with actionable insights, facilitating data-driven decision-making and strategy formulation.
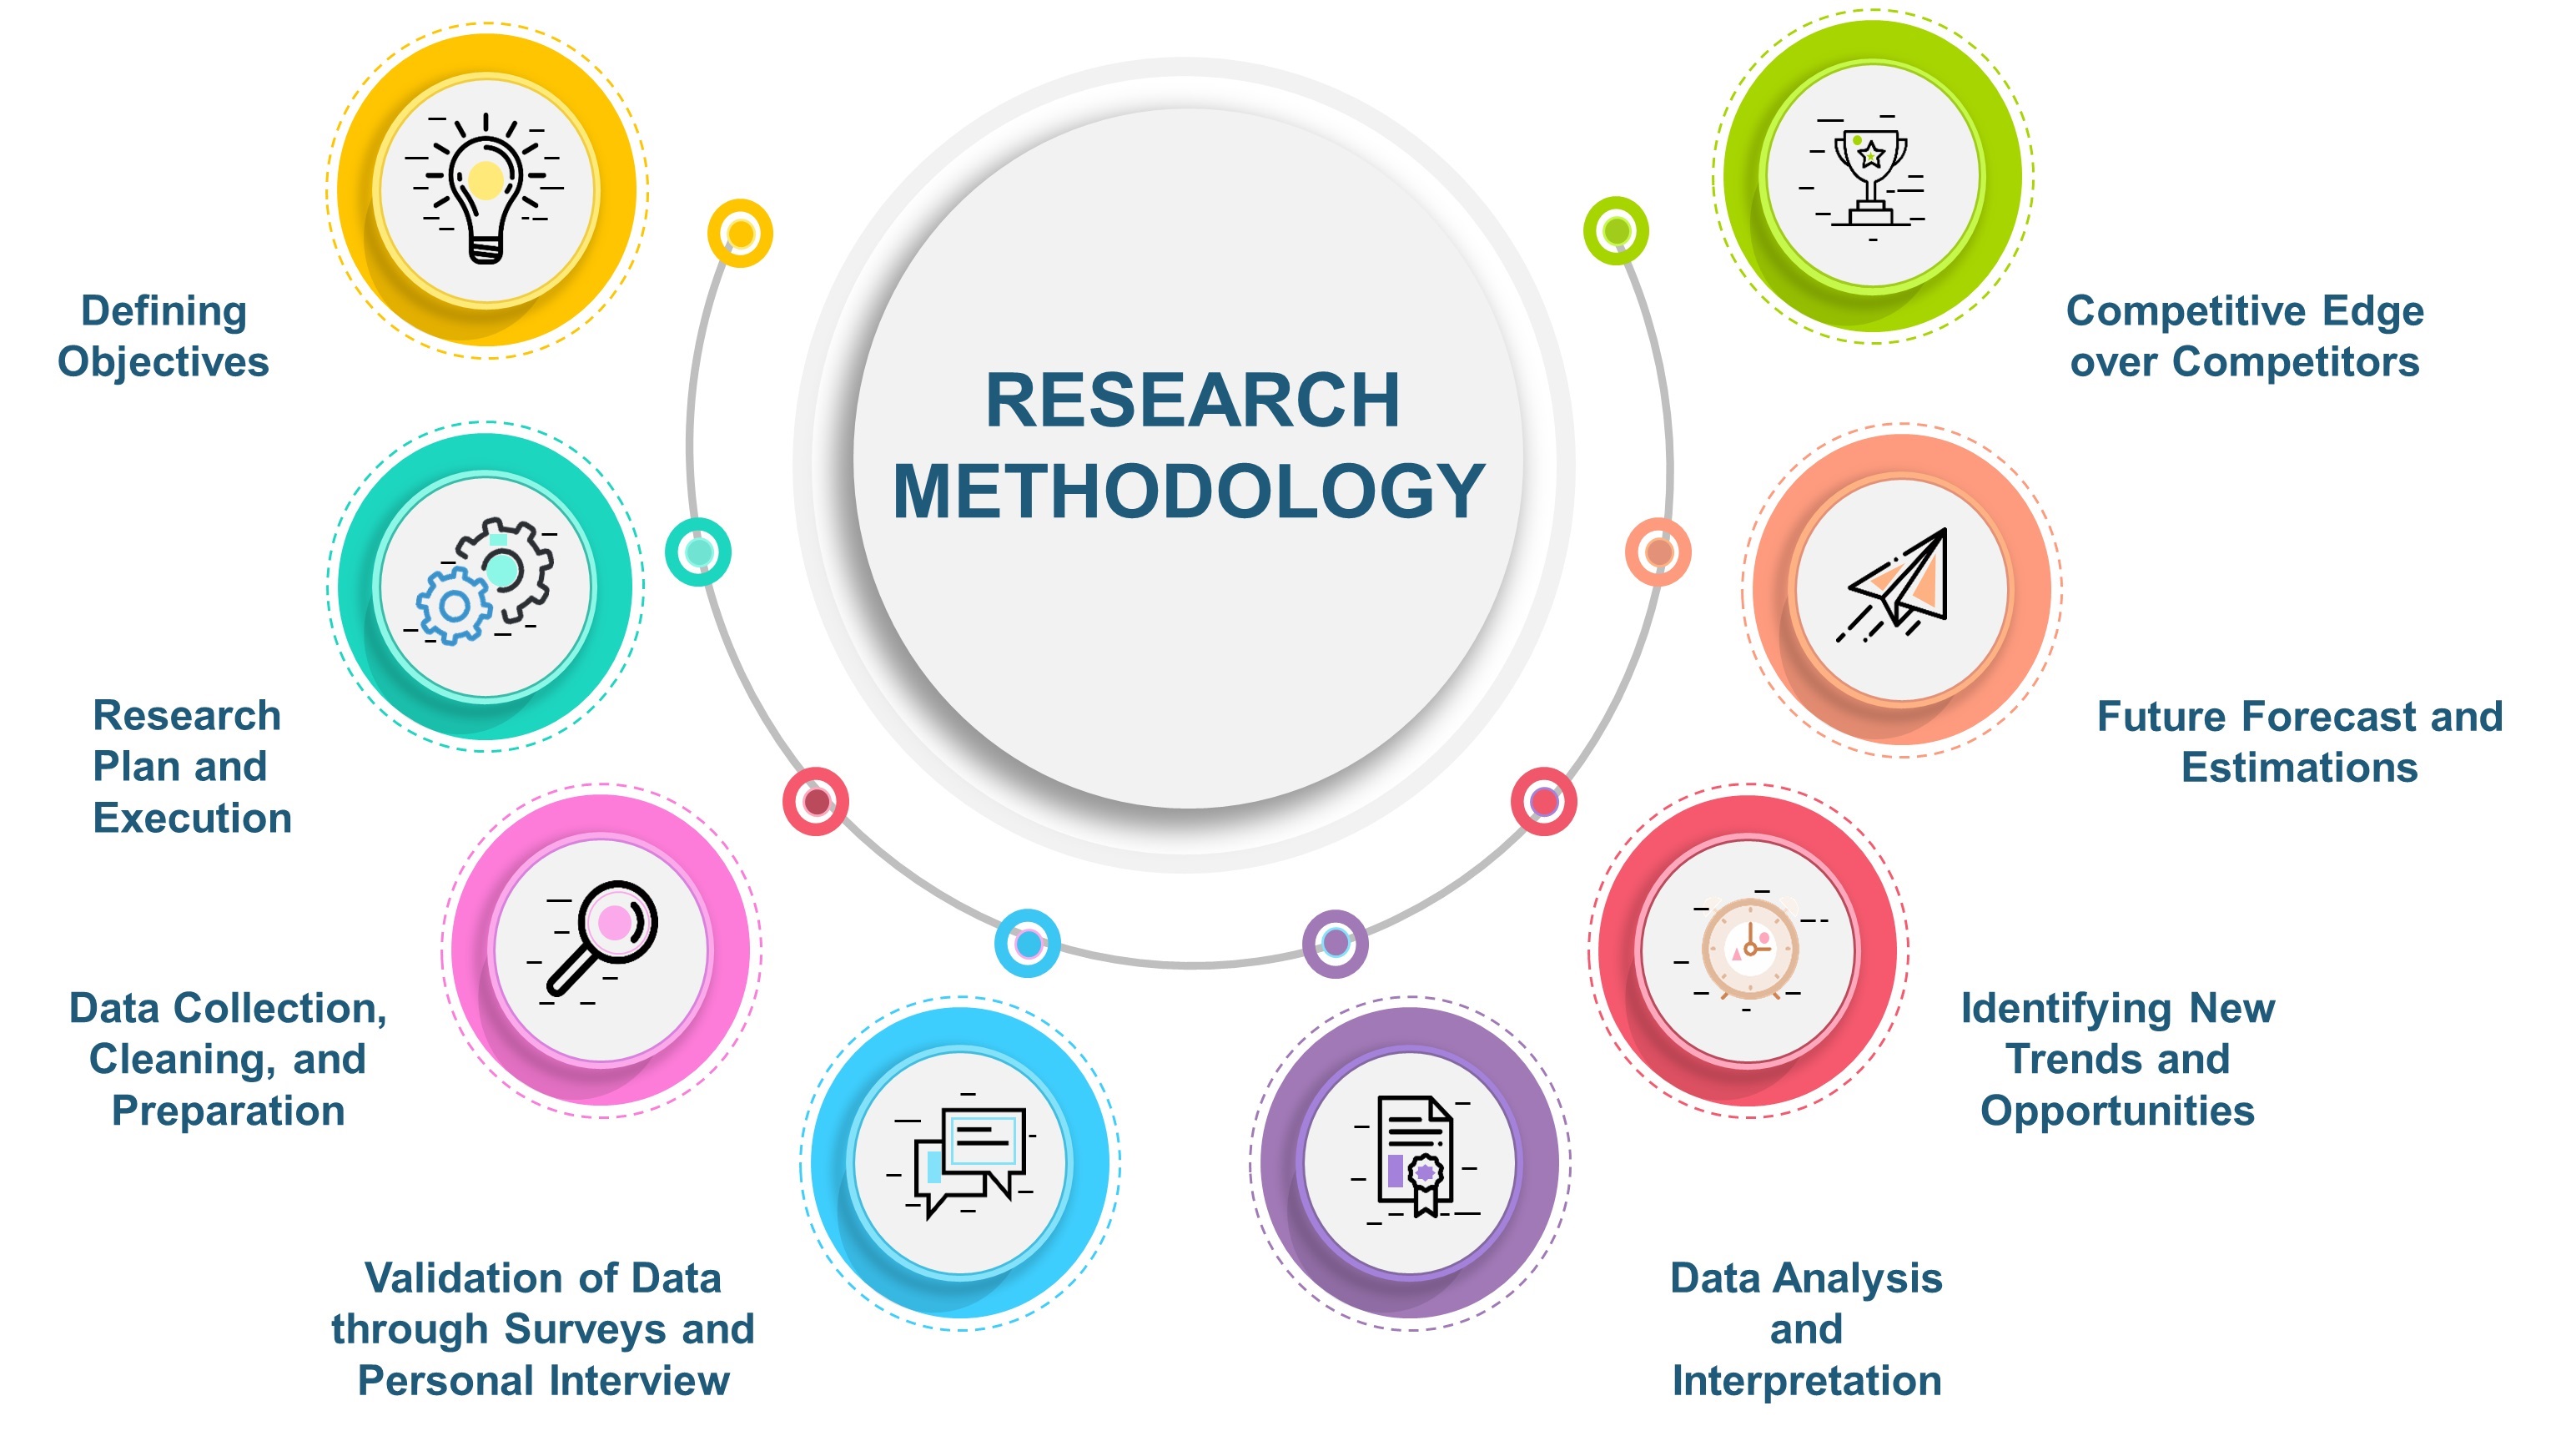
Our Specialized Toolbox for Industry-Specific Market Research
We deploy a specialized arsenal of techniques tailored to meet your unique requirements. Here's a glimpse into our comprehensive toolbox:

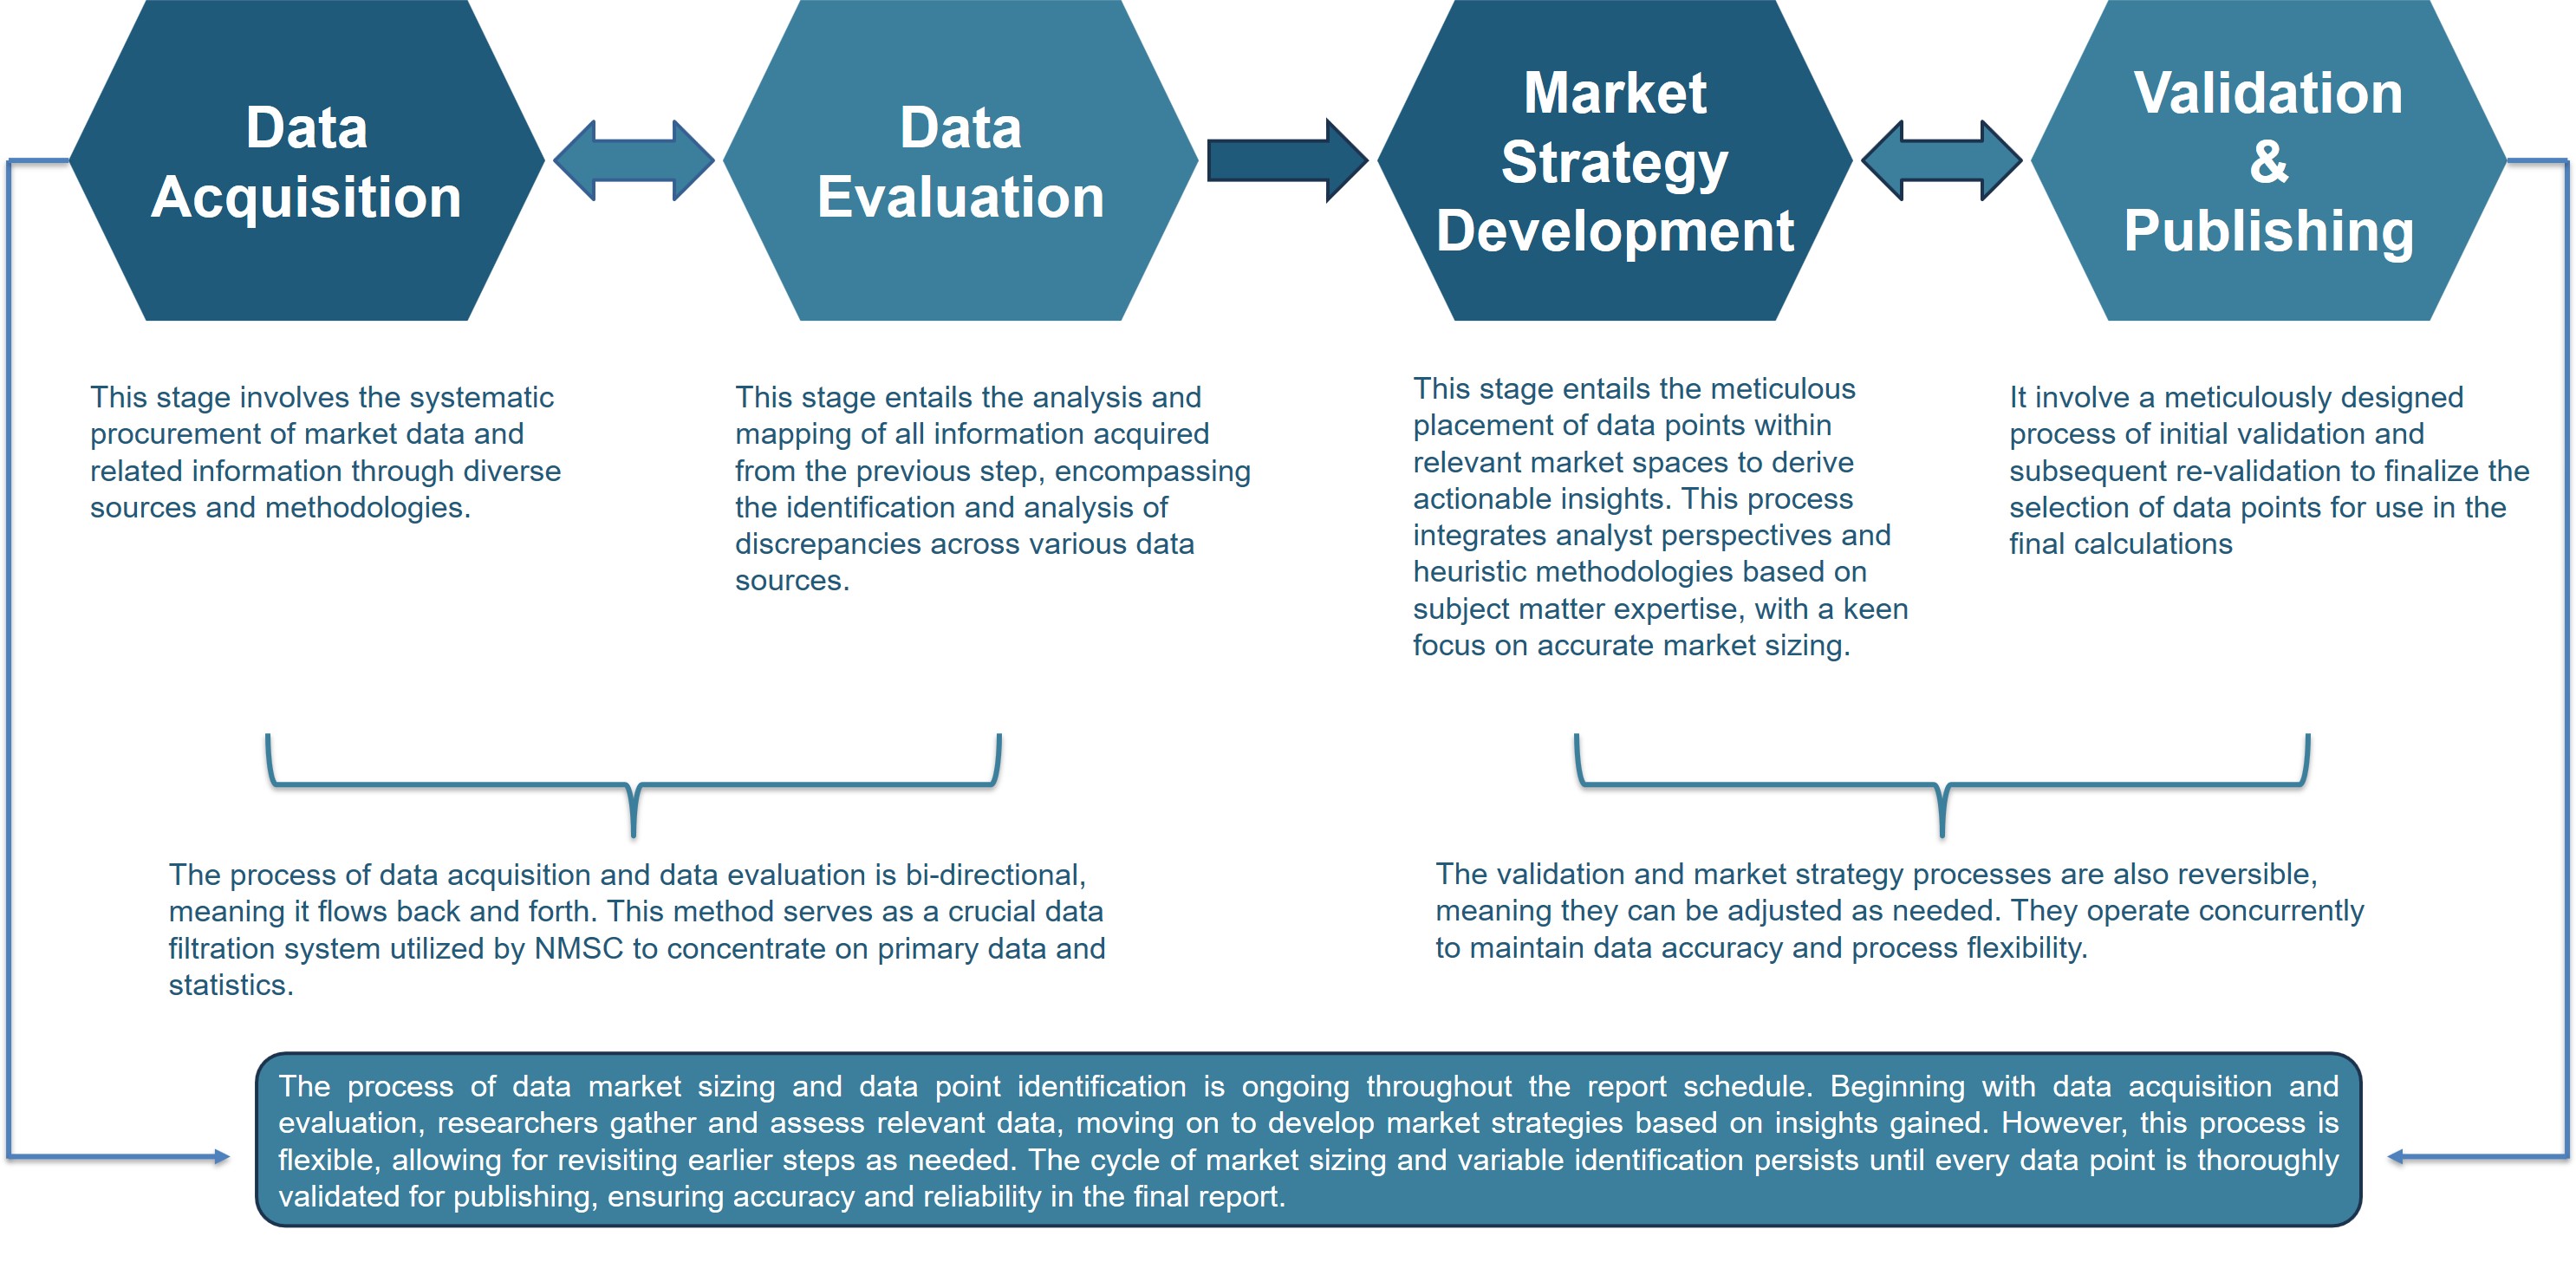
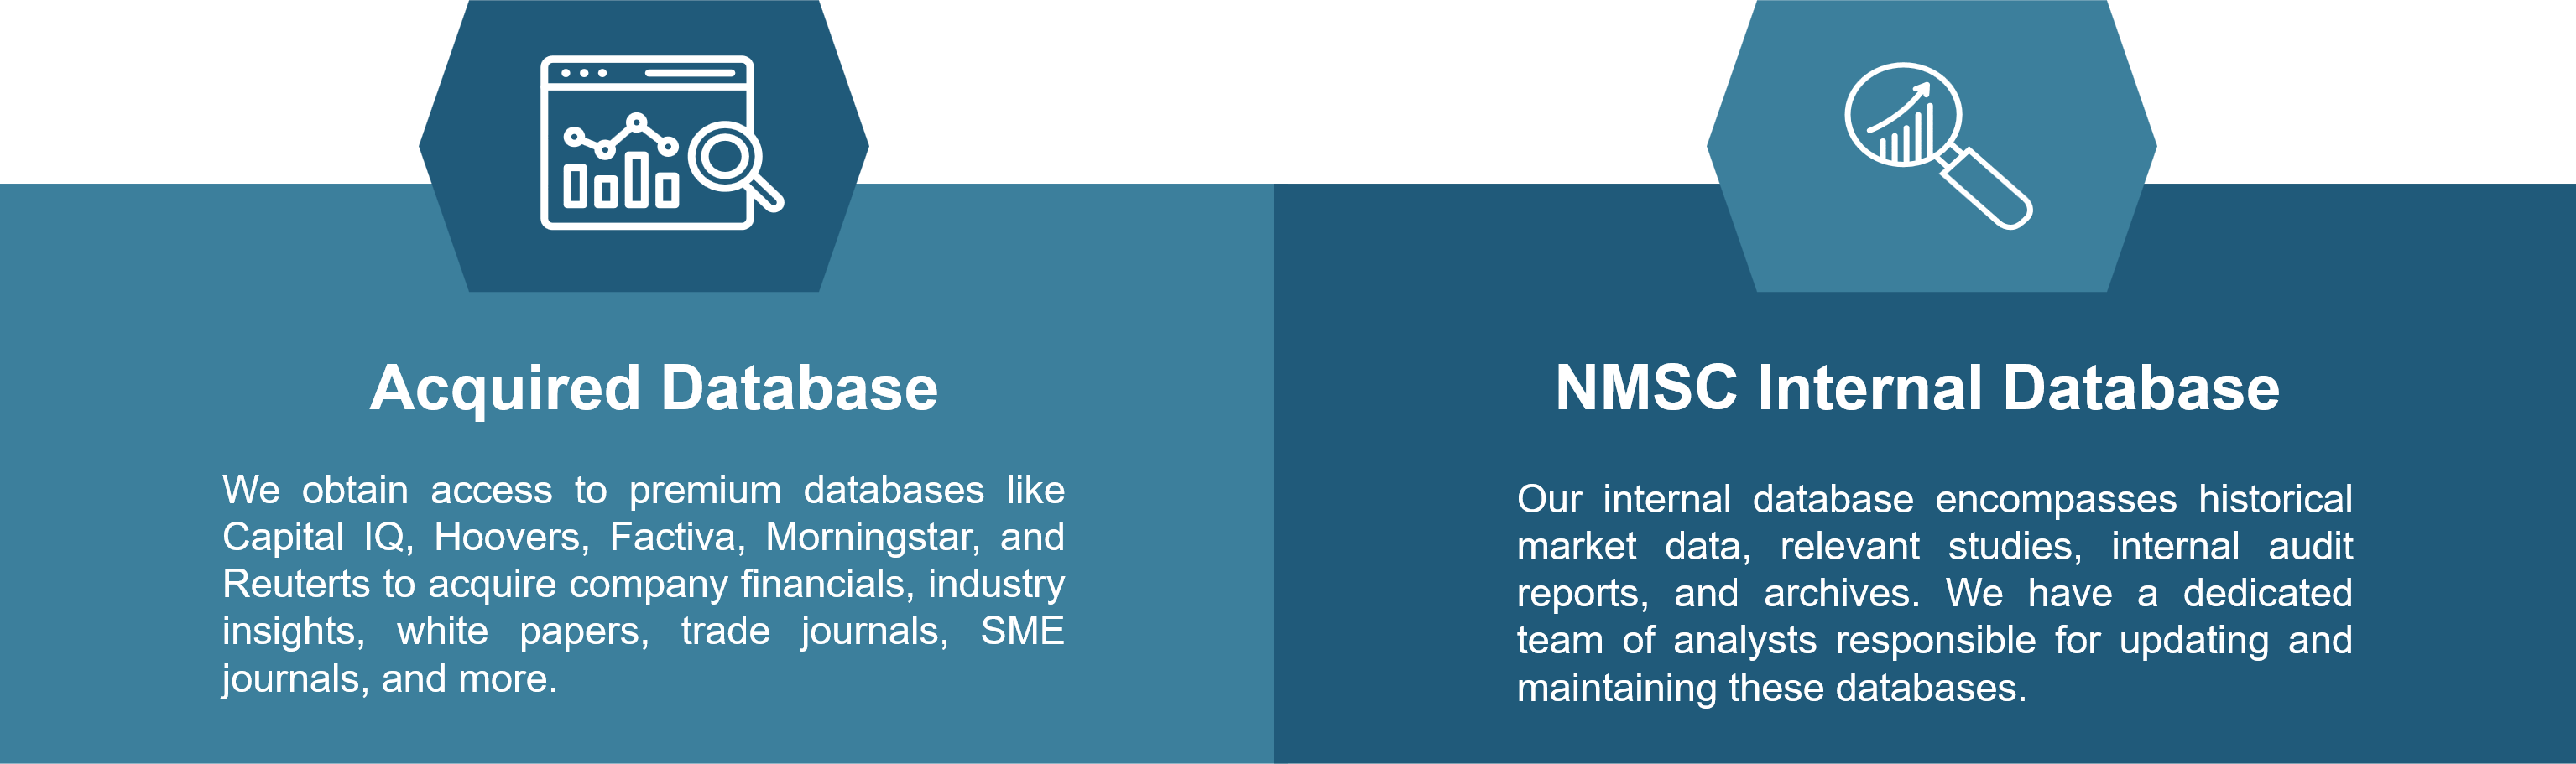
Information Procurement
The stage entails acquiring market data or relevant information through various sources and methodologies.

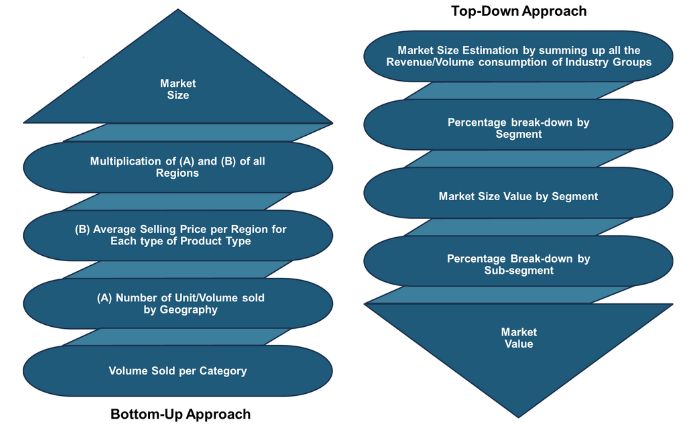
Market Research Approach
We utilize both top-down and bottom-up approaches in market research analysis to achieve a comprehensive understanding of the market dynamics, leveraging the broad perspective of industry trends and macroeconomic factors alongside detailed insights from specific segments and individual companies.
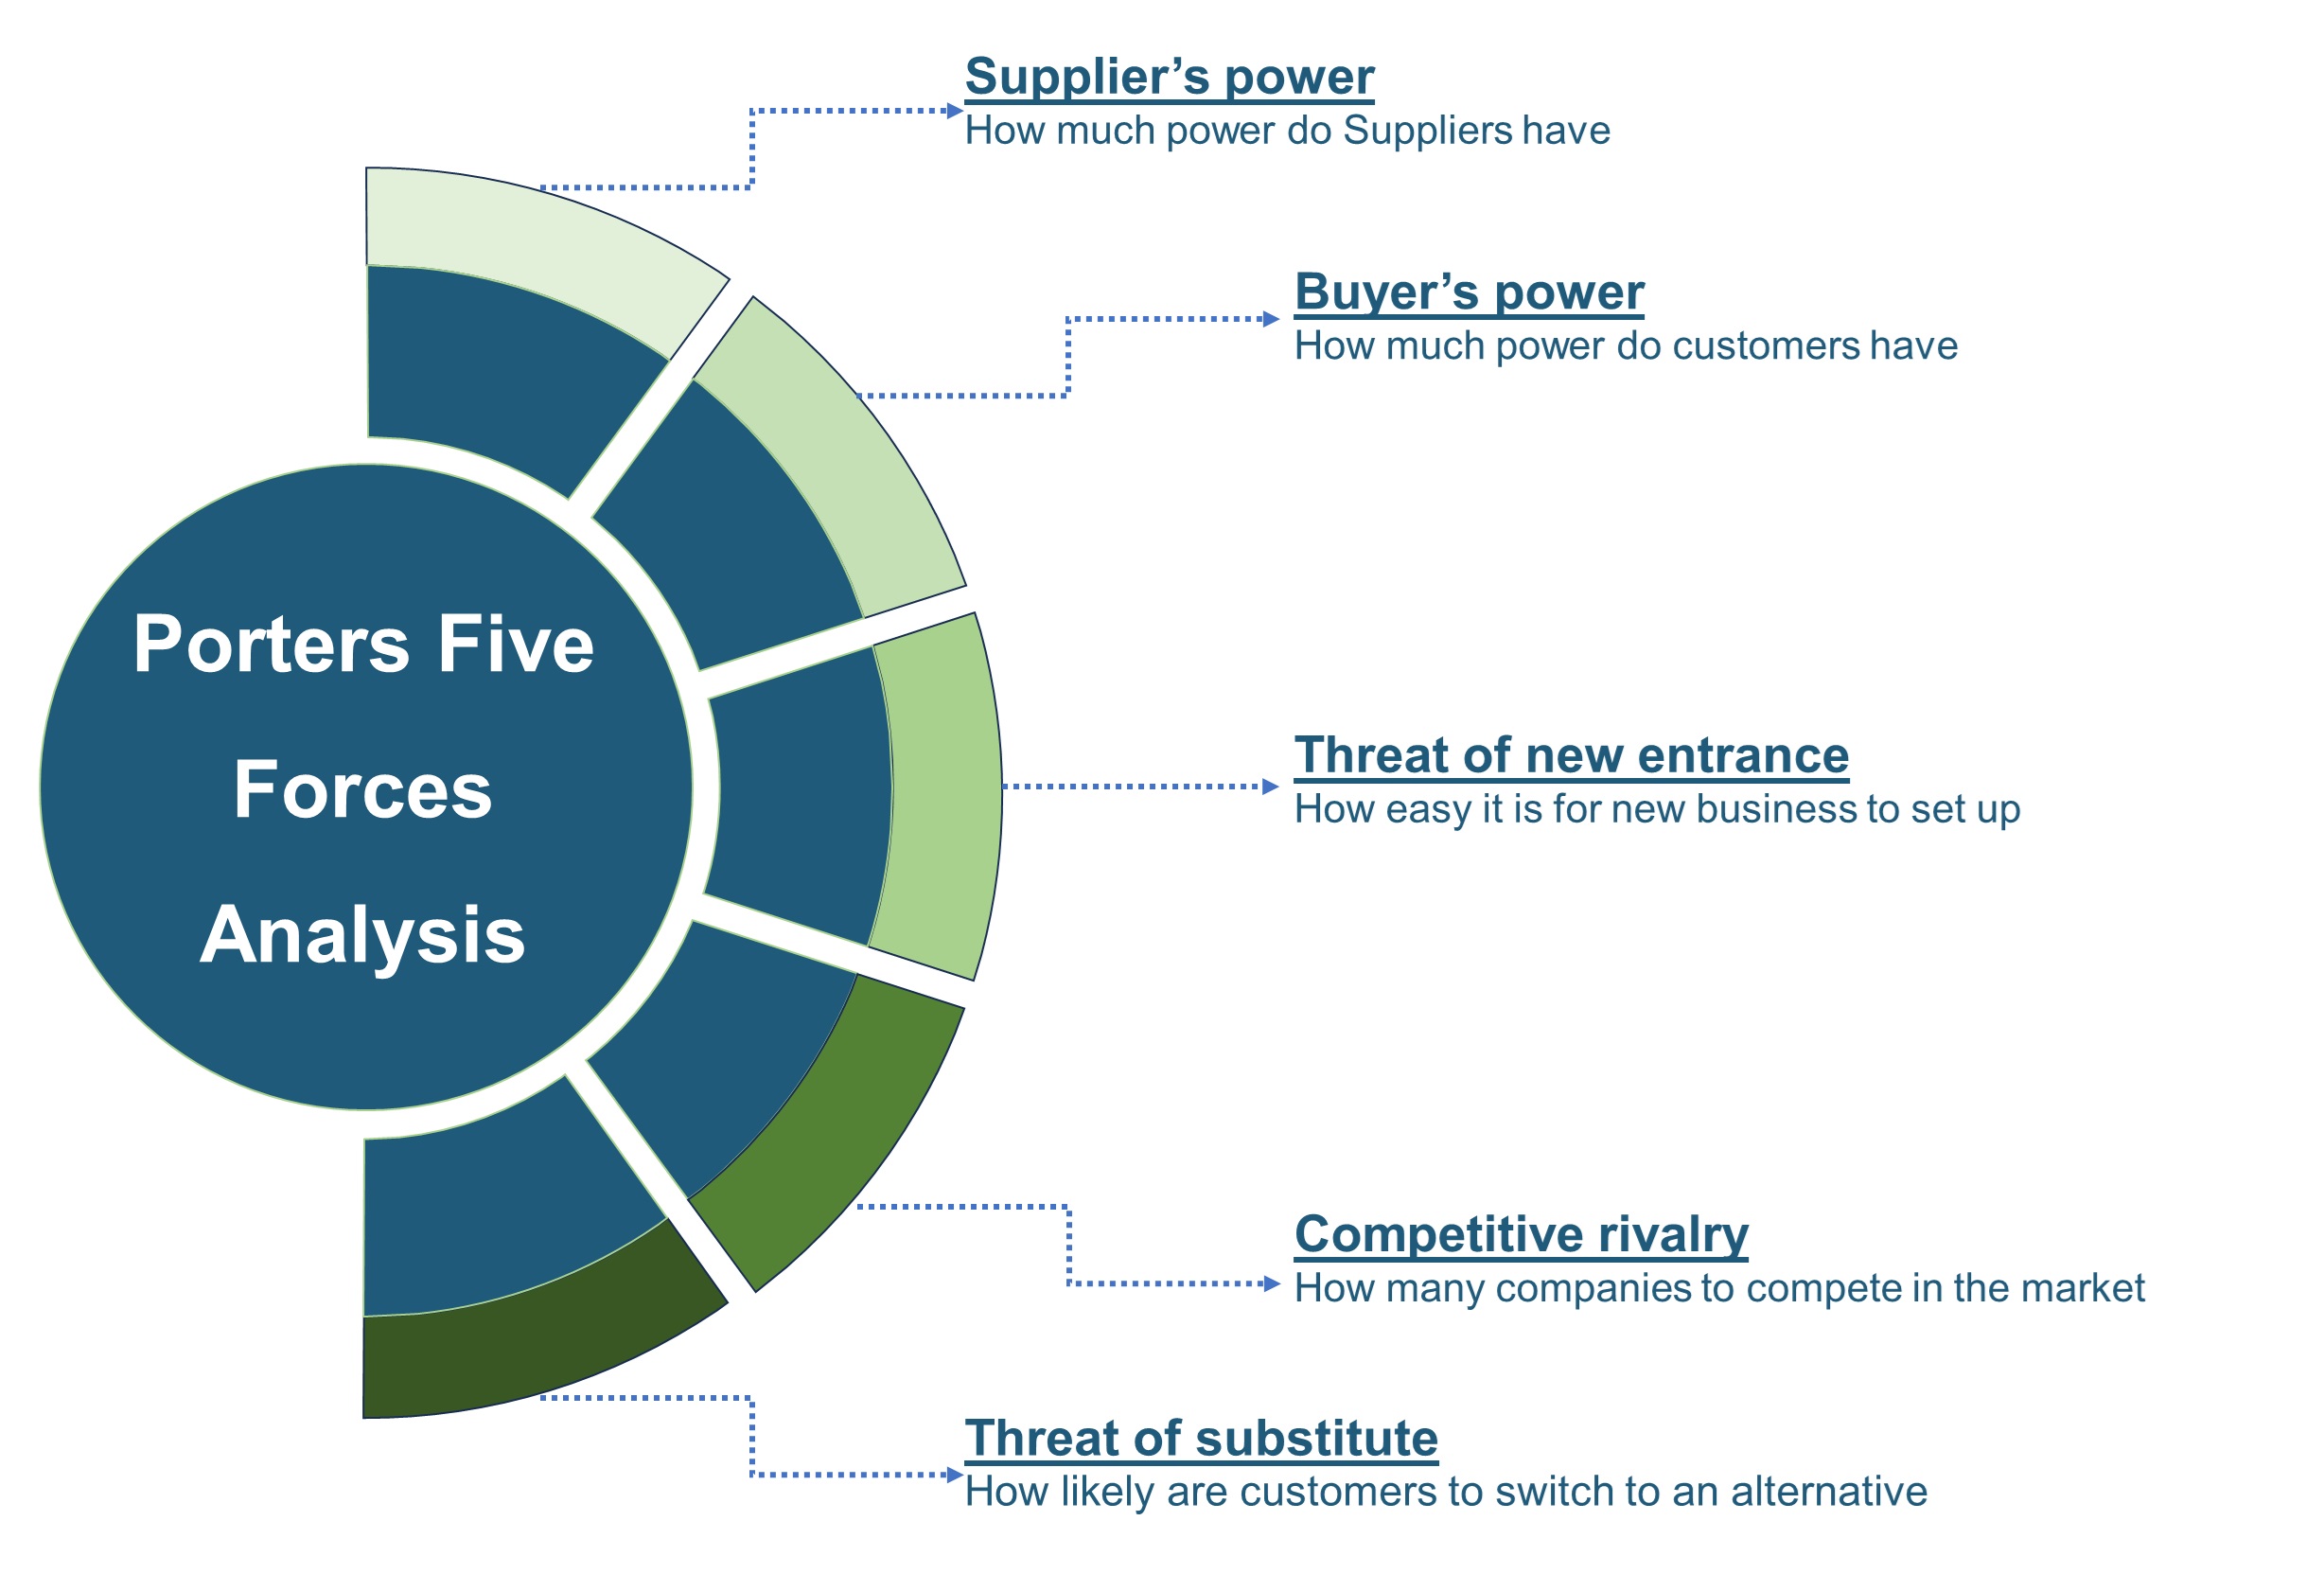
Porters Five Forces Analysis
We conduct Porter's Five Forces analysis to evaluate the competitive landscape of an industry, providing us with insights into factors that affect profitability and strategic positioning.
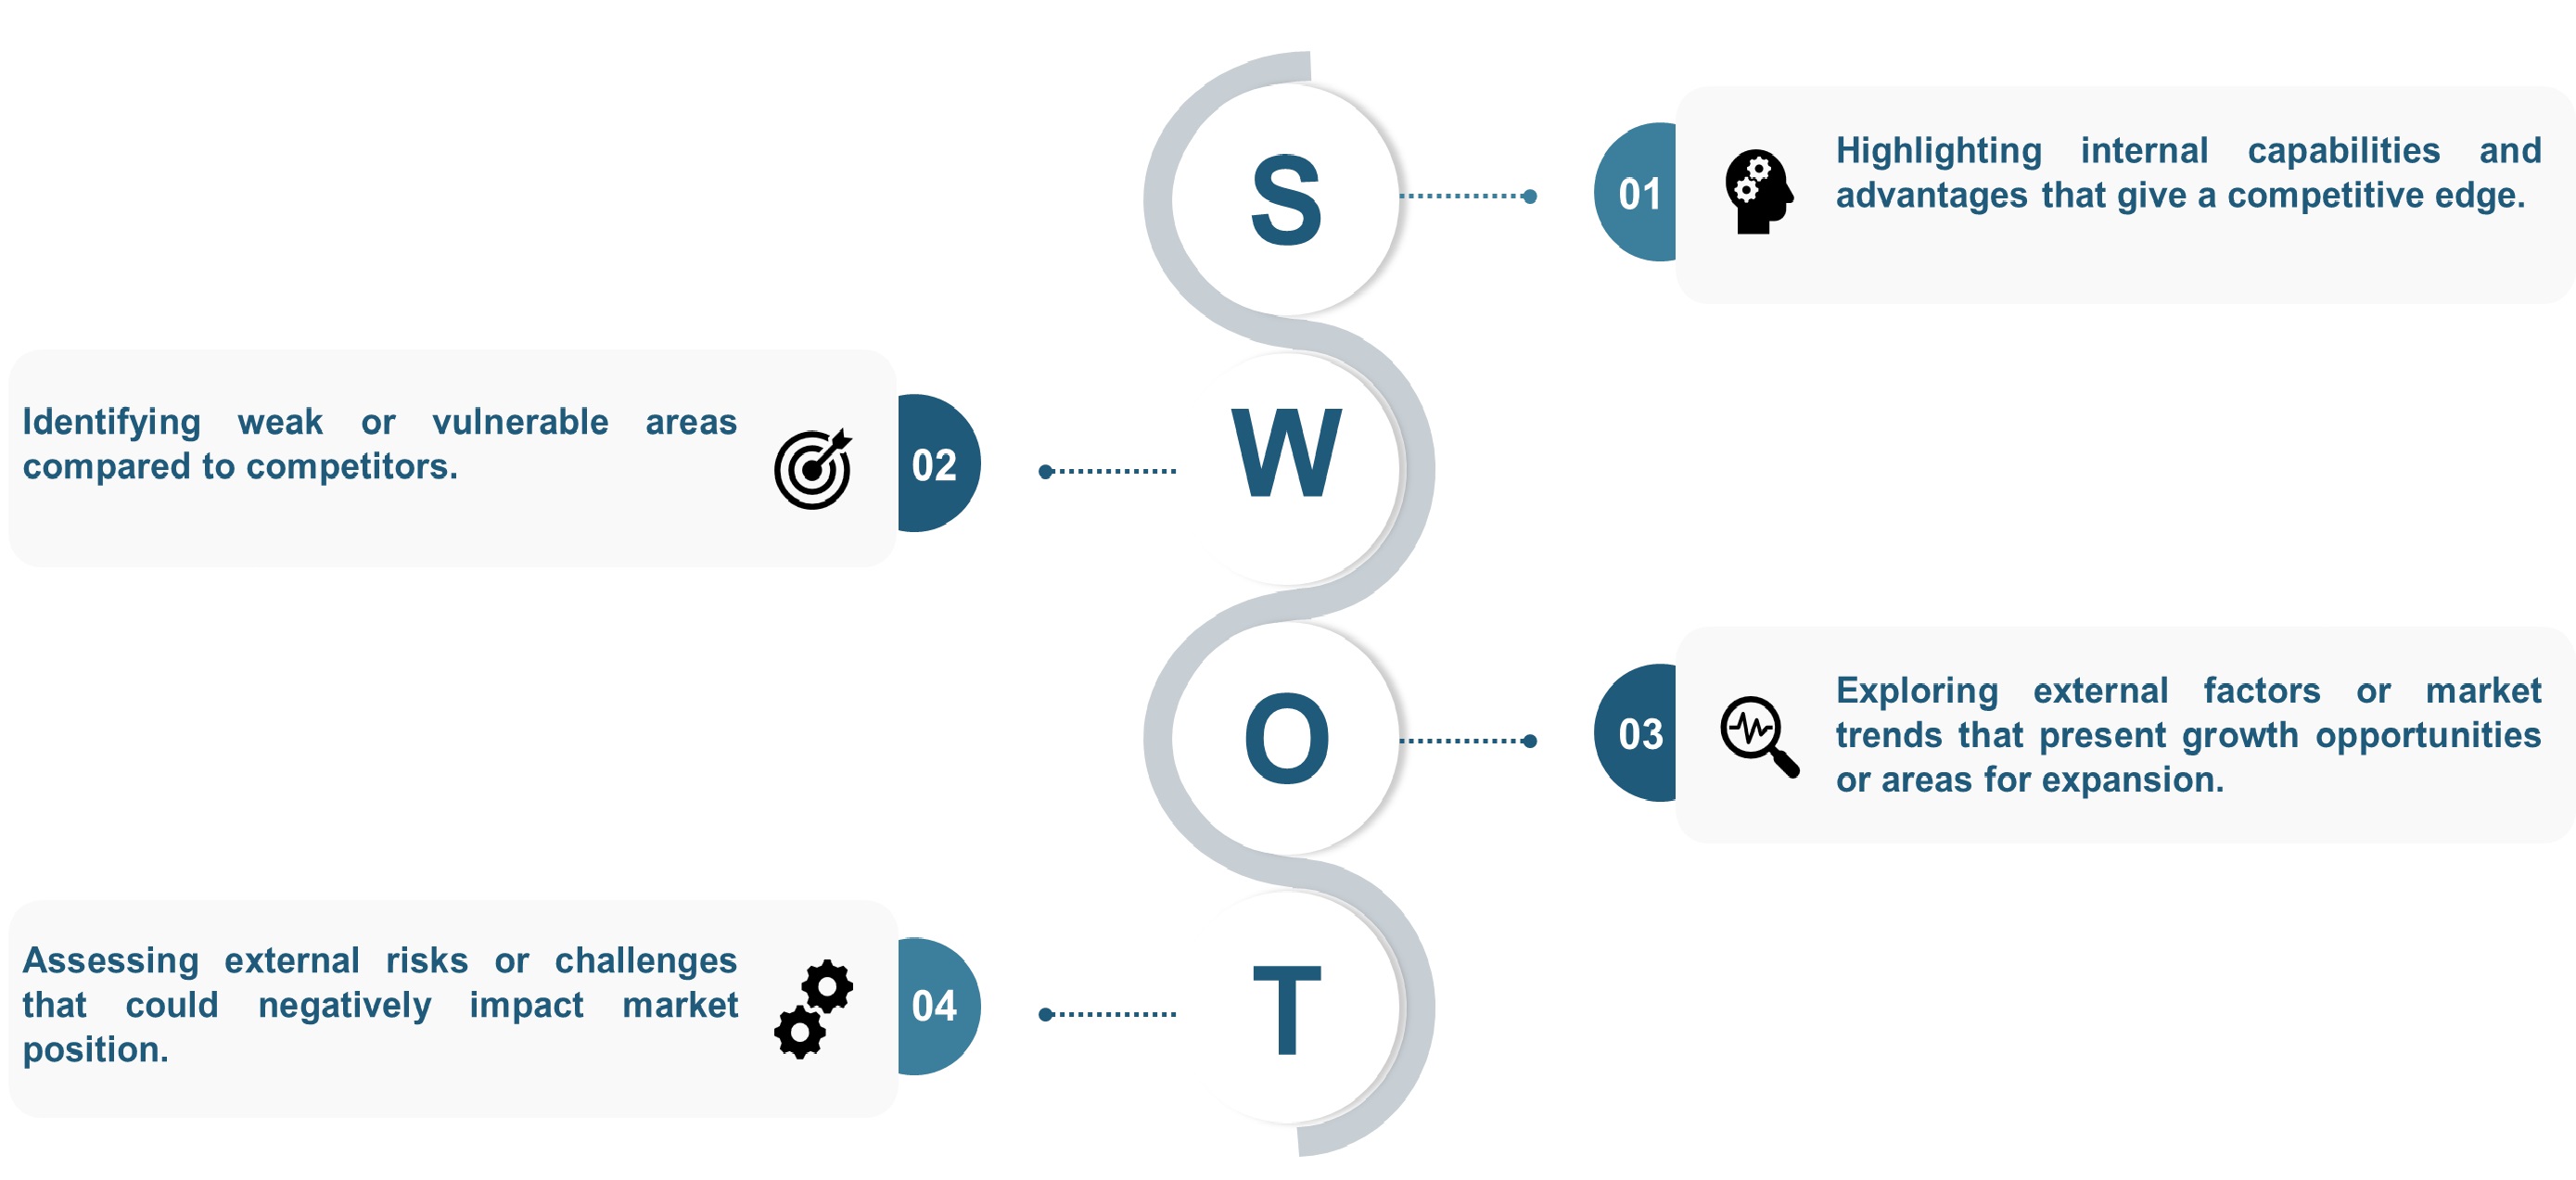
SWOT Analysis
We conduct SWOT analysis to understand market trends, identify potential threats, capitalize on opportunities, and assess our strengths and weaknesses.
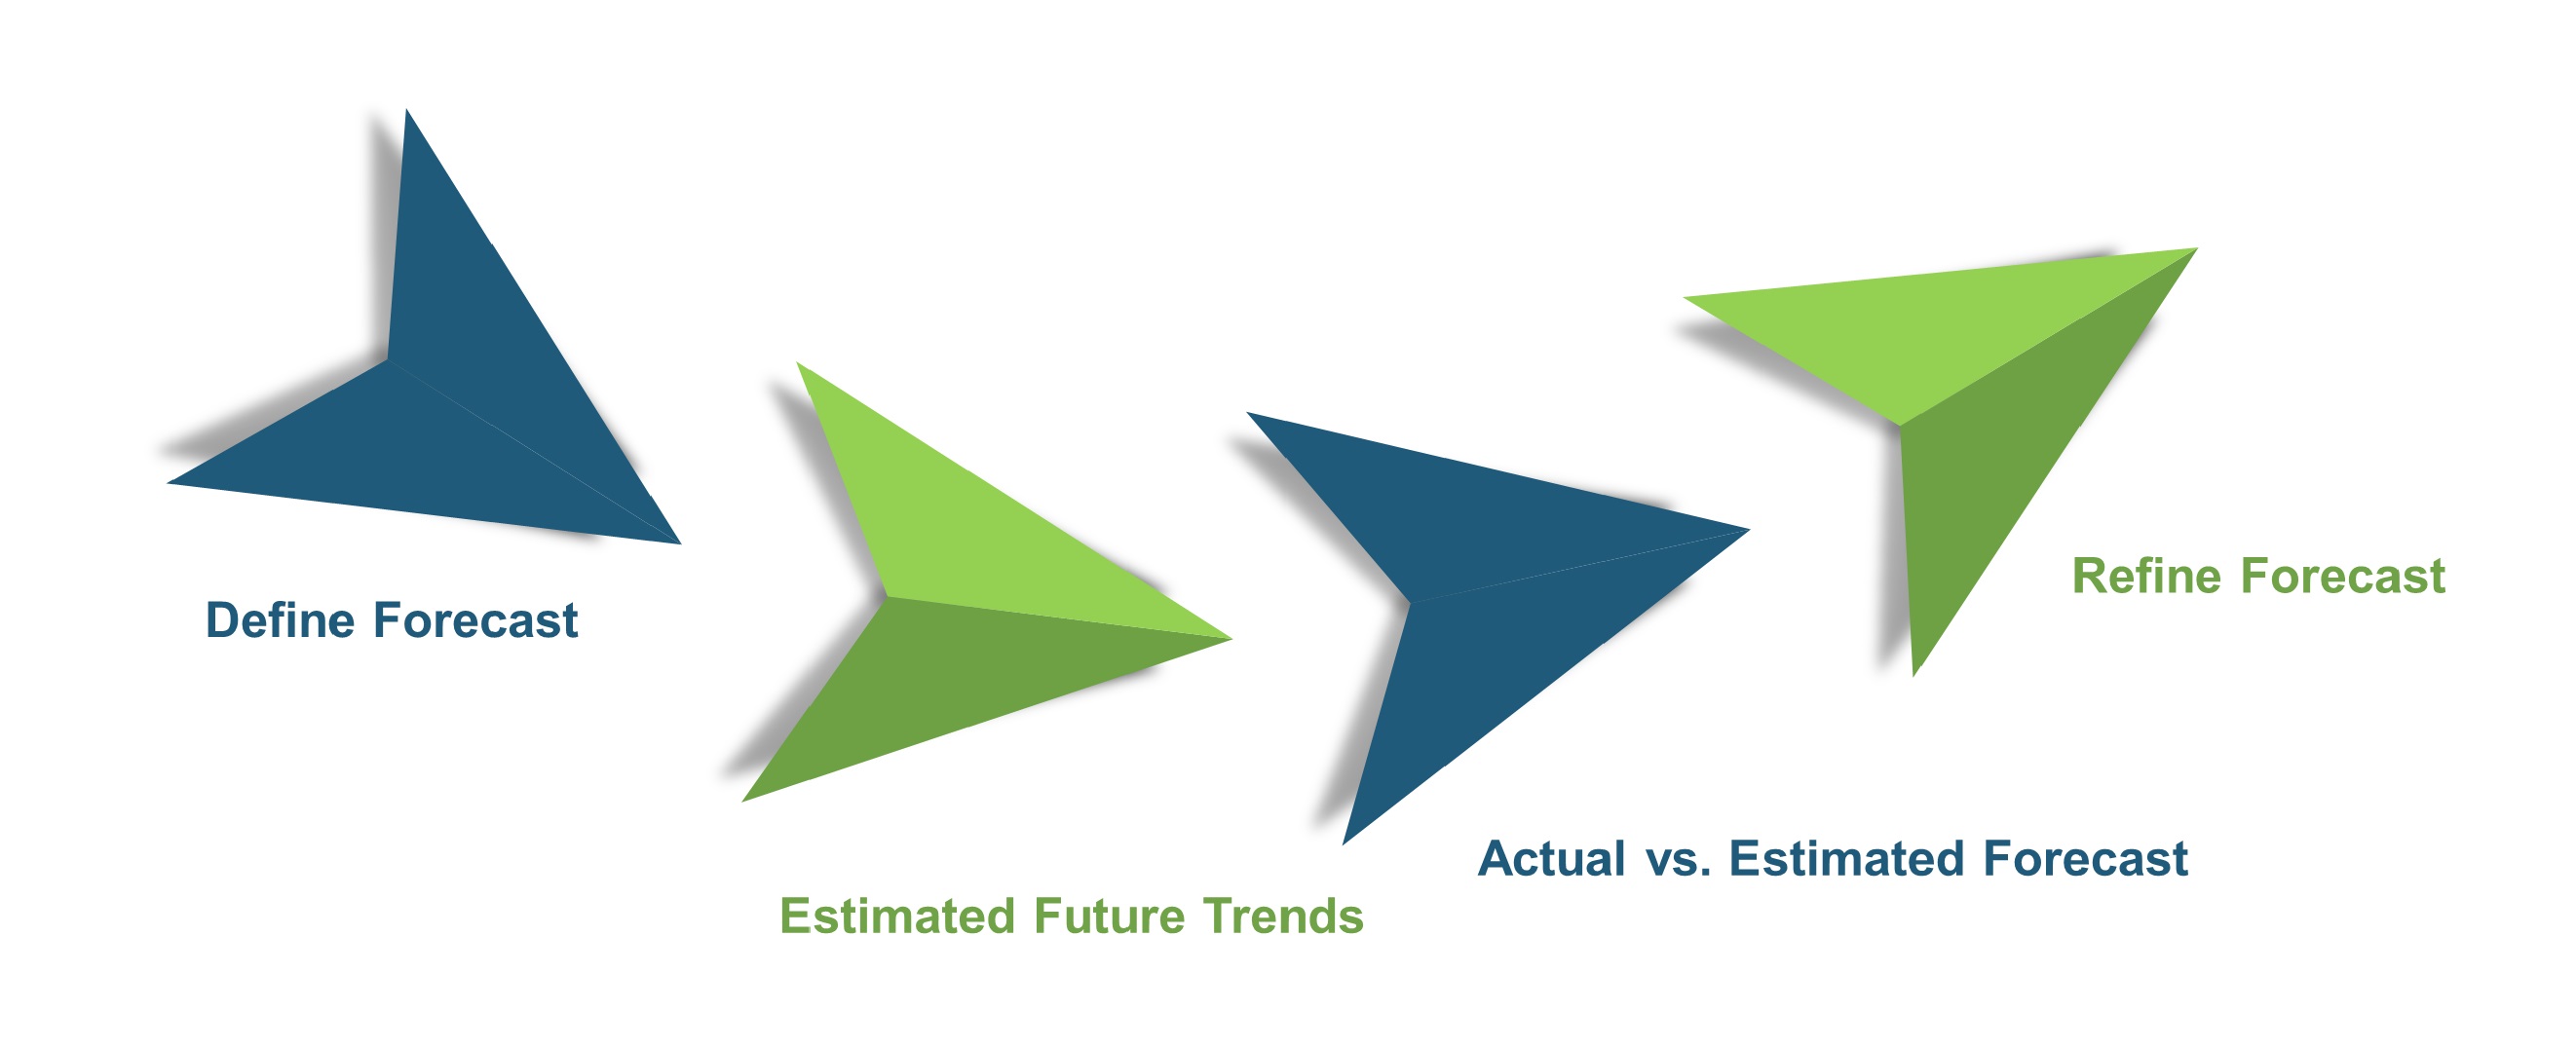
Forecasting
We utilize a forecasting model to predict future consumption by considering parameters like population, economics, regulations, market competition, drivers, constraints, technology, and pricing. We also employ statistical techniques such as multilinear regression, exponential smoothing, moving average, ARIMA, and Monte Carlo simulations for accurate predictions. In econometric forecasting, we analyzed short-term and long-term event impacts, attributing values based on regulatory frameworks, economic factors, and market events.


 Speak to Our Analyst