Signal Detection Equipment Market Size, Share, Trends and Growth Analysis, By Equipment (Signal and Spectrum Analyzers, Network Analyzers, Oscilloscopes, Communications Testers, Modular Test Systems, RF Monitoring Equipment, and Others), By Deployment Form, By Revenue Stream, By Technology Standard, By Sales Channel, By End Use Industry (Telecommunications and Datacom, Semiconductor and Electronics, and Other Industries), and Region — Global Industry Report and Forecast, 2026–2035
Industry: Aerospace & Defense | Publishing Date: July 23, 2026 | Last Updated: September 30, 2026 | No of Pages: N/A | No. of Tables: N/A | No. of Figures: N/A | Format: PDF | Report Code: AD5362
What Is the Signal Detection Equipment Market Size?
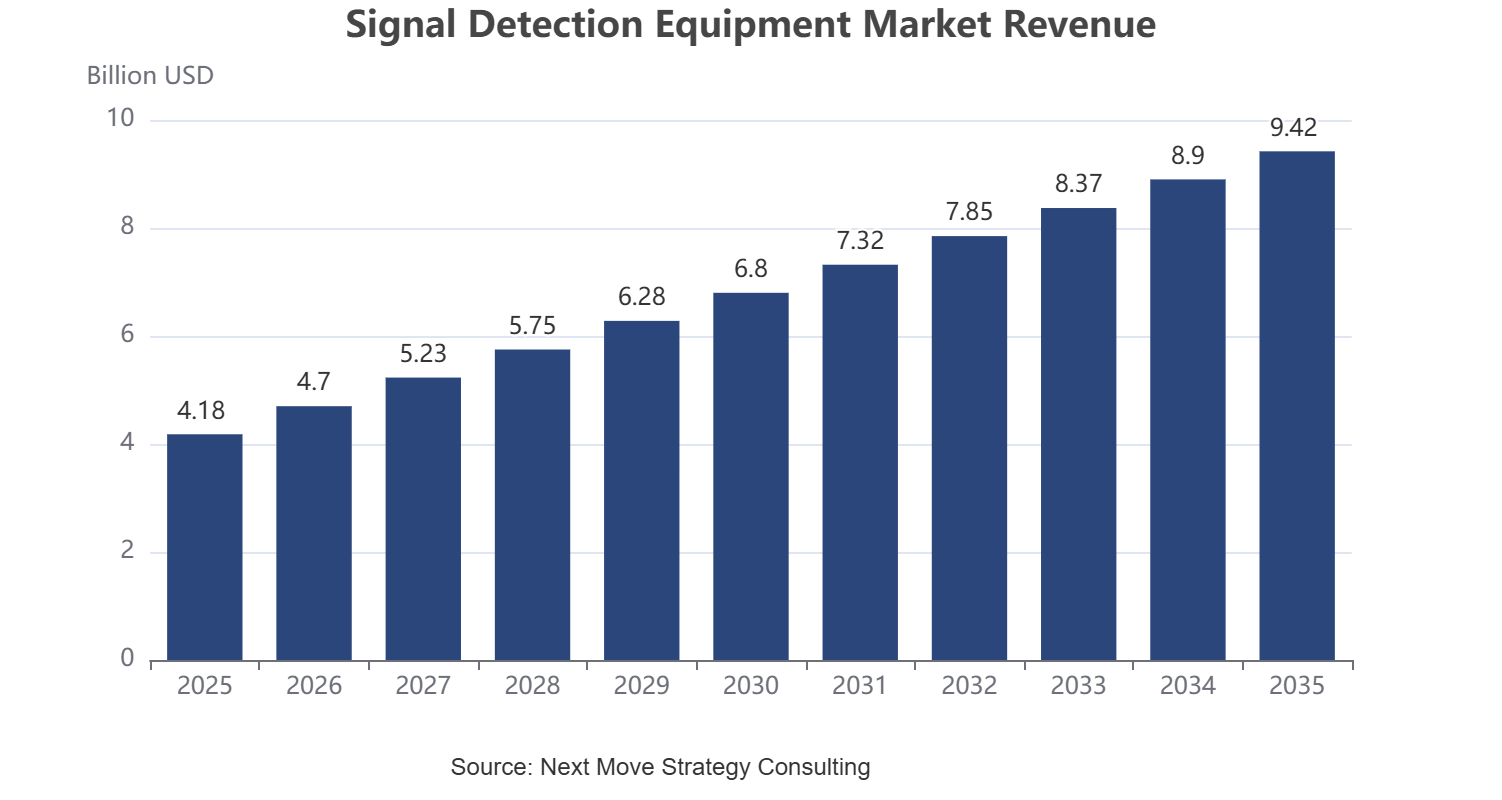
The global Signal Detection Equipment Market size was valued at USD 4.18 billion in 2025 and is estimated at USD 4.52 billion in 2026, forecast to reach USD 9.42 billion by 2035, expanding at an 8.5% CAGR between 2026 and 2035. North America leads with approximately 34% share, while signal and spectrum analyzers dominate all other equipment types with approximately 29% share.
We observed that growth is broad-based across every segmentation axis, with RF monitoring adoption and 5G-driven test demand forming the dominant structural shifts through 2035.
|
Key Takeaways |
|
By Equipment: Signal and Spectrum Analyzers held the largest share of approximately 29% (USD 1.22 Billion) in 2025; RF Monitoring Equipment is the fastest-growing sub-segment at 10.4% CAGR from 2026–2035. |
|
By Deployment Form: Benchtop held the largest share of approximately 41% (USD 1.71 Billion) in 2025; Portable is the fastest-growing sub-segment at 10.8% CAGR from 2026–2035. |
|
By Revenue Stream: Hardware held the largest share of approximately 58% (USD 2.42 Billion) in 2025; Software is the fastest-growing sub-segment at 11.6% CAGR from 2026–2035. |
|
By Technology Standard: 5G and 6G held the largest share of approximately 33% (USD 1.37 Billion) in 2025; Satellite Communications is the fastest-growing sub-segment at 12.9% CAGR from 2026–2035. |
|
By Sales Channel: Direct Sales held the largest share of approximately 46% (USD 1.92 Billion) in 2025; Rental and Leasing is the fastest-growing sub-segment at 12.1% CAGR from 2026–2035. |
|
By End Use Industry: Telecommunications and Datacom held the largest share of approximately 31% (USD 1.30 Billion) in 2025; Automotive is the fastest-growing sub-segment at 11.9% CAGR from 2026–2035. |
|
Dominant Region: North America dominated with approximately 34% revenue share (USD 1.42 Billion) in 2025. |
|
Fastest-Growing Region: Asia-Pacific is expected to register the highest CAGR of 10.4% during 2026–2035. |
|
Dominant Country: U.S. led with approximately USD 1.10 Billion in 2025. |
|
Fastest-Growing Country: India is the fastest-growing country at approximately 13.1% CAGR from 2026–2035. |
Market Opportunity: The signal detection equipment market is expected to create an absolute dollar opportunity of USD 4.90 billion between 2026 and 2035, presenting significant investment potential across the telecommunications, semiconductor, aerospace and defense, and automotive test value chain.
According to Next Move Strategy Consulting analysis, test and measurement vendors are increasingly bundling hardware with subscription-based software and calibration services to lock in recurring revenue, a shift that favors diversified suppliers with broad spectrum analyzer portfolios over single-instrument specialists as 5G and satellite test demand accelerates through 2035.
Signal Detection Equipment Market Overview
What Does the Signal Detection Equipment Market Encompass?
The signal detection equipment market encompasses instruments and systems used to capture, analyze, monitor, and validate electromagnetic and electrical signals across wired and wireless domains, including spectrum analyzers, network analyzers, oscilloscopes, communications testers, modular test systems, and RF monitoring platforms. Our assessment indicates that the scope spans benchtop, portable, rackmount, and embedded form factors supplied to telecommunications operators, semiconductor manufacturers, defense integrators, automotive OEMs, and research institutions validating next-generation communication standards.
Regulatory frameworks such as the U.S. Federal Communications Commission's spectrum allocation rules and the European Telecommunications Standards Institute's electromagnetic compatibility directives shape calibration and certification requirements, while national defense procurement standards increasingly influence ruggedized instrument design. We observed that technology adoption is shifting toward software-defined, cloud-connected analyzers that replace fixed-function hardware to support faster protocol updates. Next Move Strategy Consulting's analysis indicates that this structural shift, combined with 5G and 6G rollout timelines, is redefining procurement criteria across the signal detection equipment market.
|
Parameters |
Details |
|
Market Size in 2025 |
USD 4.18 Billion |
|
Market Size in 2026 |
USD 4.52 Billion |
|
Revenue Forecast in 2035 |
USD 9.42 Billion |
|
Growth Rate |
CAGR of 8.5% from 2026 to 2035 |
|
Analysis Period |
2025–2035 |
|
Base Year Considered |
2025 |
|
Forecast Period |
2026–2035 |
|
Market Size Estimation |
Revenue (USD Billion) |
|
Companies Profiled |
20 |
|
Countries Covered |
38 |
|
Market Share |
Available for Top 10 Companies |
Key Emerging Trends
Our findings suggest that four structural trends are reshaping how signal detection equipment is designed, sold, and deployed across the forecast period.
How Is Software-Defined Instrumentation Transforming Test Architectures?
Software-defined instrumentation is replacing fixed-function analyzers with modular platforms that update capability through firmware rather than hardware replacement. We observed that this transformation lowers total cost of ownership for telecommunications operators and semiconductor test houses managing frequent protocol revisions. Keysight Technologies and National Instruments have both expanded modular PXI-based platforms, illustrating stakeholder migration toward reconfigurable test assets that extend equipment lifecycle by several years.
Why Is 5G and Emerging 6G Validation Driving Demand?
5G network densification and early 6G research are driving sustained demand for real-time spectrum analyzers and wireless communications testers capable of validating millimeter-wave and sub-terahertz signals. Our analysis shows that network equipment manufacturers and mobile operators are the primary adopters, using these instruments for base station commissioning and interference troubleshooting. Rohde & Schwarz has expanded its signal and spectrum analyzer range specifically to address these higher-frequency validation requirements.
How Is RF Monitoring Expanding Beyond Defense Applications?
RF monitoring and direction-finding systems, historically concentrated in defense and government spectrum enforcement, are expanding into commercial interference detection for industrial IoT and smart infrastructure deployments. We found that this diversification broadens the addressable customer base beyond traditional aerospace and defense buyers. Anritsu Corporation has introduced compact RF monitoring systems targeting commercial spectrum management, reflecting this cross-sector adoption pattern.
What Role Does Automation Play in Production Test Platforms?
Automated production test platforms are increasingly embedded directly into semiconductor and electronics manufacturing lines to reduce manual calibration cycles and throughput bottlenecks. Based on research conducted by Next Move Strategy Consulting, we found that this shift toward automation is closely tied to broader factory digitization initiatives across the smart manufacturing landscape. Advantest Corporation and Teradyne, Inc. have both scaled automated test platforms aligned with high-volume semiconductor production requirements.
Porter’s Five Forces Analysis of the Signal Detection Equipment Market:
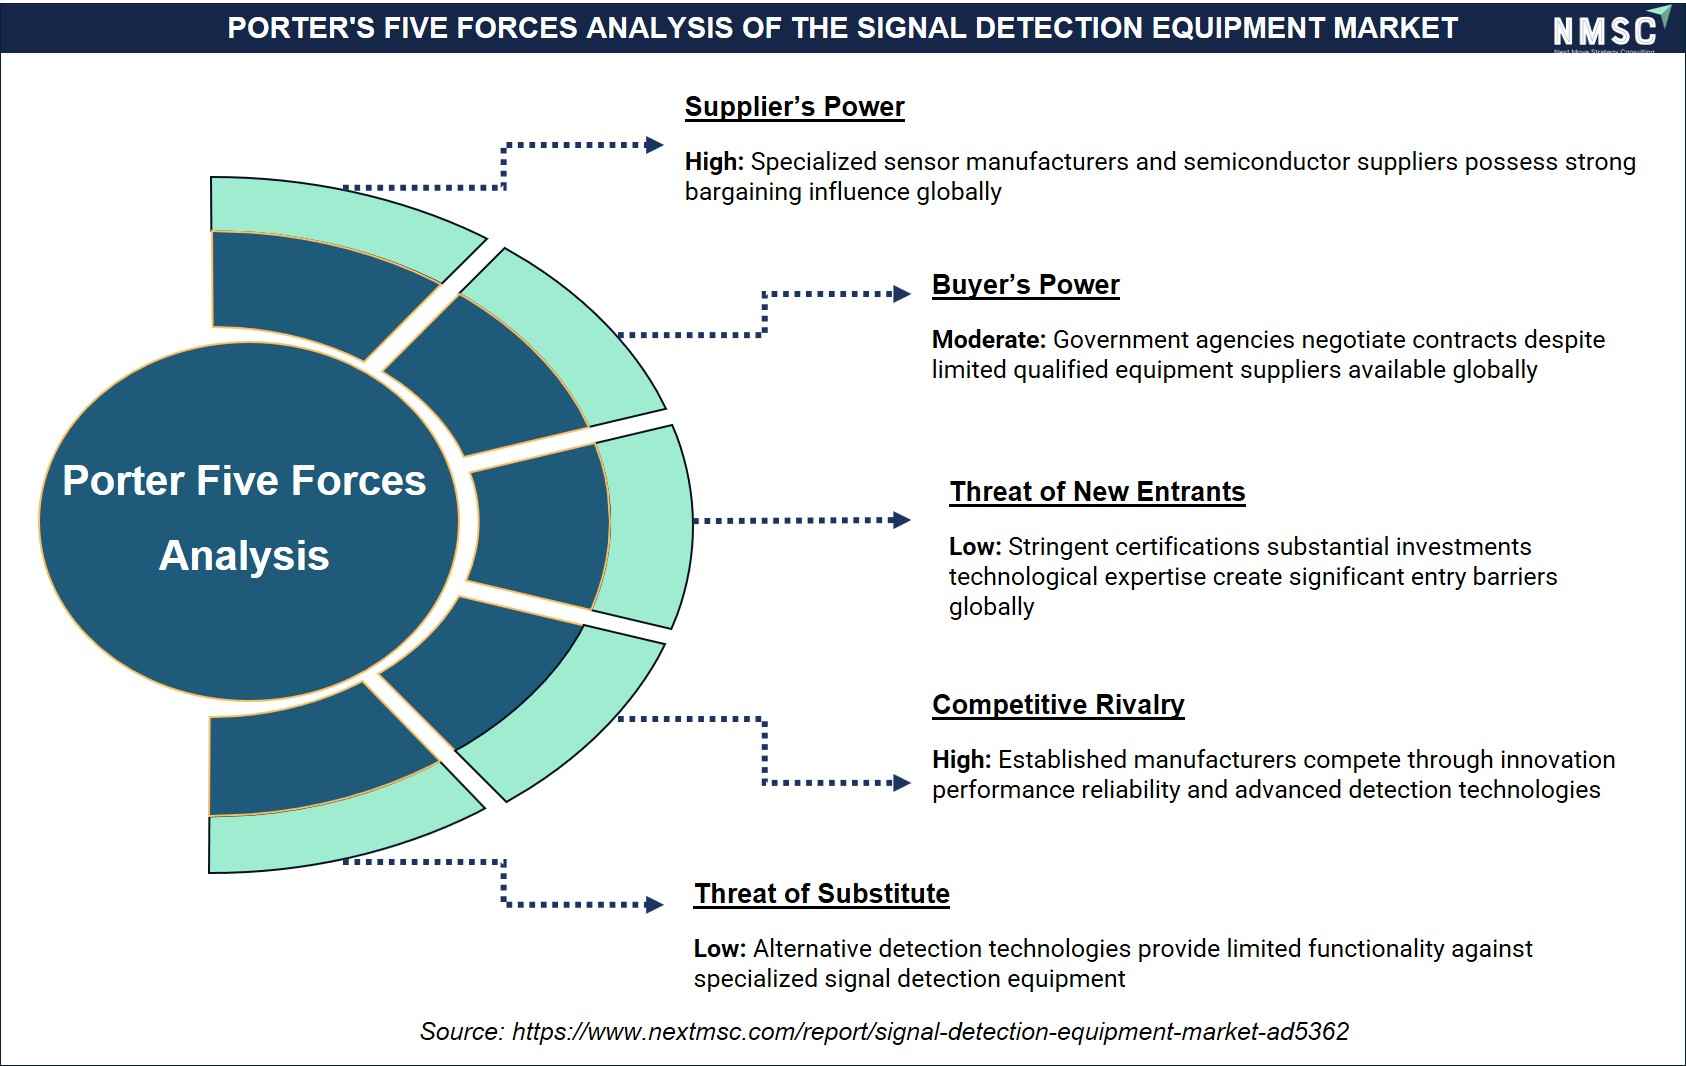
Based on NMSC’s market assessment, the Signal Detection Equipment Market is shaped by strong supplier influence, high competitive rivalry, and significant barriers to entry driven by strict certifications and advanced technological requirements. Meanwhile, moderate buyer bargaining power and limited substitute technologies reinforce market stability. Consequently, continuous innovation, specialized expertise, and performance-focused product development remain essential for sustaining competitive advantage and meeting evolving defense and security requirements.
Growth Drivers & Restraints
|
Factors |
Type |
(+/−) % Impact on CAGR |
Geographic Relevance |
Impact Timeline |
|
5G/6G network rollout and spectrum validation demand |
Driver |
+2.1% |
Global |
2026–2035 |
|
Rising semiconductor and electronics production capacity |
Driver |
+1.6% |
Asia-Pacific, North America |
2026–2035 |
|
Aerospace and defense modernization and EW investment |
Driver |
+1.3% |
North America, Europe, MEA |
2026–2035 |
|
Automotive radar and ADAS test proliferation |
Driver |
+1.1% |
Global |
2026–2032 |
|
Growth of software-defined and modular test platforms |
Driver |
+0.9% |
Global |
2026–2035 |
|
High capital cost of advanced RF instrumentation |
Restraint |
−1.2% |
Emerging economies |
2026–2035 |
|
Long calibration and certification cycles |
Restraint |
−0.8% |
Global |
2026–2031 |
|
Shortage of skilled RF test engineers |
Restraint |
−0.6% |
North America, Europe |
2026–2033 |
What Is the Primary Growth Driver?
The primary growth driver is accelerating 5G network densification alongside early 6G research, which requires extensive spectrum validation, base station commissioning, and interference testing. The U.S. Federal Communications Commission has continued allocating additional mid-band and millimeter-wave spectrum for commercial 5G use, directly expanding the addressable base of network equipment requiring validation. This regulatory expansion sustains demand for signal and spectrum analyzers, network analyzers, and wireless communications testers across operator and manufacturer test labs.
How Is Semiconductor Manufacturing Expansion Driving Market Growth?
Expanding semiconductor fabrication capacity is driving parallel demand for production test platforms and modular test systems embedded within manufacturing lines. Government-backed fabrication investment programs, including incentives tracked by national trade and commerce departments, are expanding wafer output capacity that requires corresponding growth in semiconductor wafer fab equipment and associated signal validation instrumentation, reinforcing structural demand through the forecast period.
What Is Restraining the Signal Detection Equipment Market?
The primary restraint is the high capital cost of advanced RF and microwave instrumentation, which limits adoption among smaller manufacturers and research institutions in cost-sensitive emerging economies. Industry-derived estimates suggest that benchtop real-time spectrum analyzers with millimeter-wave coverage can carry acquisition costs several multiples above legacy instruments, extending replacement cycles and constraining near-term unit growth in price-sensitive geographies despite steady underlying demand.
Segmentation Analysis
Segment Sizing: By Equipment
|
Segment |
2025 (USD Billion) |
2035 (USD Billion) |
CAGR% (2026–2035) |
|
Signal and Spectrum Analyzers |
1.22 |
2.70 |
9.2% |
|
Network Analyzers |
0.49 |
1.17 |
10.2% |
|
Oscilloscopes |
0.49 |
1.06 |
9.0% |
|
Communications Testers |
0.49 |
1.04 |
8.7% |
|
Modular Test Systems |
0.49 |
1.17 |
10.2% |
|
RF Monitoring Equipment |
0.49 |
1.28 |
10.4% |
|
Other Signal Detection Equipment |
0.49 |
1.01 |
8.4% |
|
Total |
4.18 |
9.42 |
8.5% |
Which Equipment Sub-Segment Leads the Market?
Signal and Spectrum Analyzers led the by equipment axis with approximately 29% share (USD 1.22 Billion) in 2025, reflecting entrenched installed base and broad applicability across telecommunications, semiconductor, and defense test environments. Our assessment indicates that RF Monitoring Equipment is the fastest-growing sub-segment at 10.4% CAGR from 2026–2035, driven by rising deployment flexibility requirements and expanding field-test use cases that favor this format over traditional fixed installations.
Segment Sizing: By Technology Standard
|
Segment |
2025 (USD Billion) |
2035 (USD Billion) |
CAGR% (2026–2035) |
|
5G and 6G |
1.37 |
2.85 |
8.5% |
|
Wi-Fi |
0.47 |
0.97 |
8.4% |
|
Ethernet and Time-Sensitive Networking |
0.47 |
0.96 |
8.3% |
|
Radar |
0.47 |
1.08 |
9.7% |
|
Satellite Communications |
0.47 |
1.47 |
12.9% |
|
Electromagnetic Compatibility and Compliance |
0.47 |
1.05 |
9.3% |
|
Other Communication Standards |
0.47 |
1.05 |
9.3% |
|
Total |
4.18 |
9.42 |
8.5% |
Which Technology Standard Sub-Segment Leads the Market?
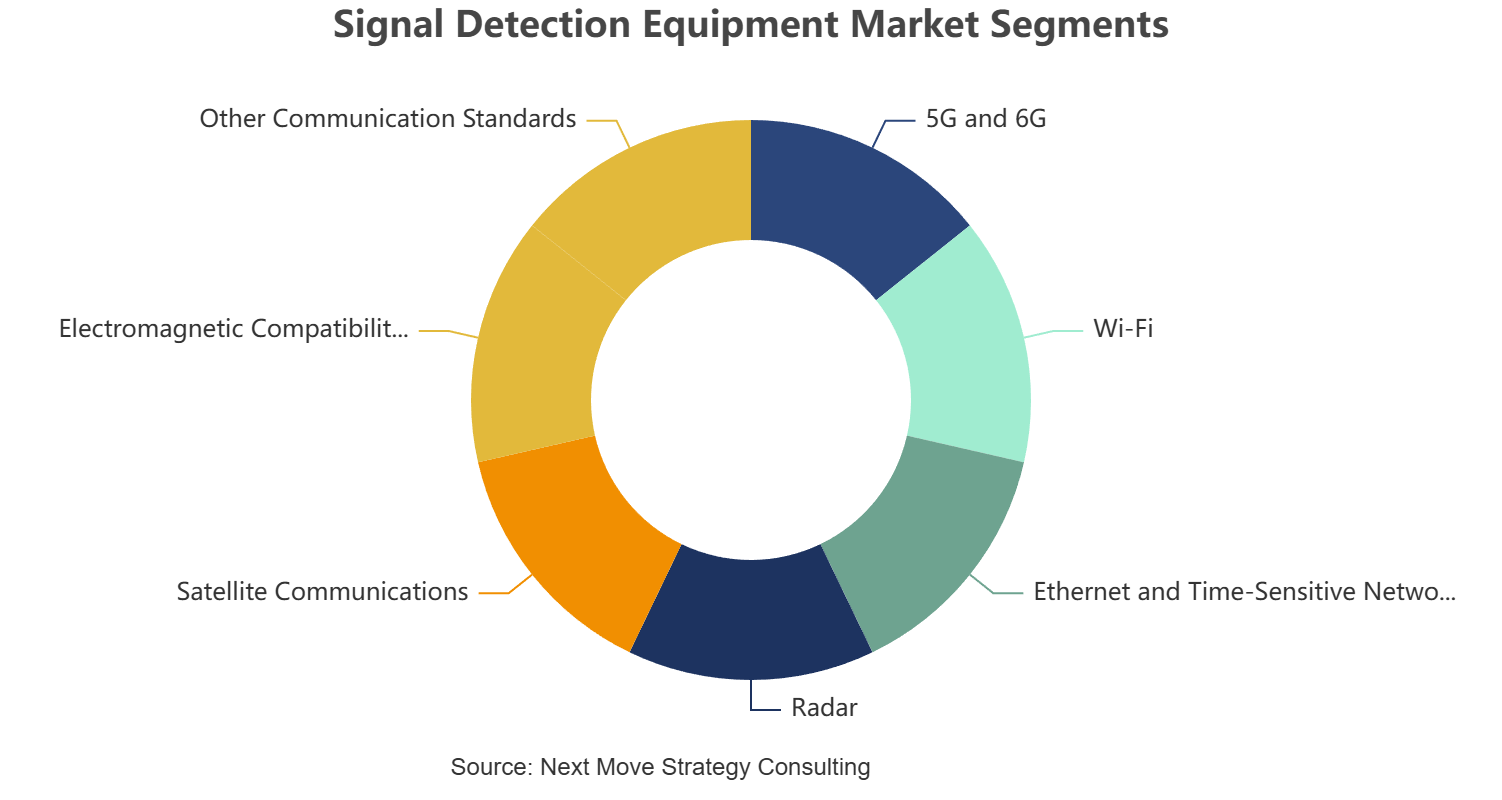
5G and 6G led the by technology standard axis with approximately 33% share (USD 1.37 Billion) in 2025, reflecting entrenched installed base and broad applicability across telecommunications, semiconductor, and defense test environments. Our assessment indicates that Satellite Communications is the fastest-growing sub-segment at 12.9% CAGR from 2026–2035, driven by rising deployment flexibility requirements and expanding field-test use cases that favor this format over traditional fixed installations.
Segment Sizing: By End Use Industry
|
Segment |
2025 (USD Billion) |
2035 (USD Billion) |
CAGR% (2026–2035) |
|
Telecommunications and Datacom |
1.30 |
2.85 |
9.1% |
|
Semiconductor and Electronics |
0.48 |
1.07 |
9.3% |
|
Aerospace and Defense |
0.48 |
1.00 |
8.5% |
|
Automotive |
0.48 |
1.40 |
11.9% |
|
Industrial and Energy |
0.48 |
1.00 |
8.5% |
|
Academic and Research |
0.48 |
1.08 |
9.4% |
|
Other Industries |
0.48 |
1.02 |
8.7% |
|
Total |
4.18 |
9.42 |
8.5% |
Which End Use Industry Sub-Segment Leads the Market?
Telecommunications and Datacom led the by end use industry axis with approximately 31% share (USD 1.30 Billion) in 2025, reflecting entrenched installed base and broad applicability across telecommunications, semiconductor, and defense test environments. Our assessment indicates that Automotive is the fastest-growing sub-segment at 11.9% CAGR from 2026–2035, driven by rising deployment flexibility requirements and expanding field-test use cases that favor this format over traditional fixed installations.
Segment Sizing: By Deployment Form
|
Segment |
2025 (USD Billion) |
2035 (USD Billion) |
CAGR% (2026–2035) |
|
Benchtop |
1.71 |
Not disclosed |
Not disclosed |
|
Portable |
Not disclosed |
Not disclosed |
10.8% |
|
Total |
4.18 |
9.42 |
8.5% |
Which Deployment Form Sub-Segment Leads the Market?
Benchtop led the by deployment form axis with approximately 41% share (USD 1.71 Billion) in 2025. Our assessment indicates that Portable is the fastest-growing sub-segment at 10.8% CAGR from 2026–2035. Full segment-level 2035 sizing and additional sub-segment CAGRs for this axis were not disclosed in the underlying data and are not estimated here.
Segment Sizing: By Revenue Stream
|
Segment |
2025 (USD Billion) |
2035 (USD Billion) |
CAGR% (2026–2035) |
|
Hardware |
2.42 |
Not disclosed |
Not disclosed |
|
Software |
Not disclosed |
Not disclosed
|
11.6% |
|
Total |
4.18 |
9.42 |
8.5% |
Which Revenue Stream Sub-Segment Leads the Market?
Hardware led the by revenue stream axis with approximately 58% share (USD 2.42 Billion) in 2025. Our assessment indicates that Software is the fastest-growing sub-segment at 11.6% CAGR from 2026–2035. Full segment-level 2035 sizing and additional sub-segment CAGRs for this axis were not disclosed in the underlying data and are not estimated here.
Segment Sizing: By Sales Channel
|
Segment |
2025 (USD Billion) |
2035 (USD Billion) |
CAGR% (2026–2035) |
|
Direct Sales |
1.92 |
Not disclosed |
Not disclosed |
|
Rental and Leasing |
Not disclosed |
Not disclosed |
12.1% |
|
Total |
4.18 |
9.42 |
8.5% |
Which Sales Channel Sub-Segment Leads the Market?
Direct Sales led the by sales channel axis with approximately 46% share (USD 1.92 Billion) in 2025. Our assessment indicates that Rental and Leasing is the fastest-growing sub-segment at 12.1% CAGR from 2026–2035. Full segment-level 2035 sizing and additional sub-segment CAGRs for this axis were not disclosed in the underlying data and are not estimated here.
Growth Opportunities
Our analysis shows three forward-looking whitespace opportunities emerging across the signal detection equipment value chain.
Can Satellite Communications Test Demand Create New Revenue Streams?
Expanding low-earth-orbit constellations and non-terrestrial network initiatives such as the 5G NTN ecosystem are creating demand for specialized satellite communications test instrumentation, benefiting equipment vendors serving satellite operators and ground-station integrators.
Can Automotive Radar Test Convergence Expand the Addressable Market?
Rising radar sensor content in ADAS platforms is converging with RF test requirements traditionally confined to telecommunications, creating opportunity for vendors serving automotive semiconductor suppliers validating radar transceiver modules at production scale.
Can Rental and Leasing Models Broaden Access for Smaller Buyers?
Expanding rental and leasing distribution models can broaden access to high-value RF and microwave instrumentation for smaller research institutions and contract manufacturers unable to justify outright capital purchases, benefiting instrument-rental specialists and system integrators positioned to serve project-based test demand.
Regional Outlook
|
Region |
2025 (USD Billion) |
2035 (USD Billion) |
CAGR% (2026–2035) |
Key Driver |
|
North America |
1.42 |
2.98 |
7.7% |
5G/6G and defense test investment |
|
Europe |
1.09 |
2.24 |
7.5% |
EMC compliance and industrial test demand |
|
Asia-Pacific |
1.17 |
3.14 |
10.4% |
Semiconductor fabrication expansion |
|
Middle East & Africa |
0.29 |
0.63 |
8.1% |
Defense modernization programs |
|
Latin America |
0.21 |
0.43 |
7.4% |
Telecom infrastructure expansion |
|
Total |
4.18 |
9.42 |
8.5% |
|
North America Signal Detection Equipment Market Outlook
North America represents a mature, high-value market anchored by extensive defense procurement, dense telecommunications infrastructure, and concentrated semiconductor R&D activity. We observed that Federal Communications Commission spectrum policy and Department of Defense modernization programs sustain steady replacement demand for advanced instrumentation. Regulatory certification requirements and strong domestic vendor presence support premium instrument adoption, with strategic outlook favoring continued investment in software-defined and modular platforms through 2035.
Europe Signal Detection Equipment Market Outlook
Europe's market reflects strong regulatory-driven demand from electromagnetic compatibility compliance requirements under European Telecommunications Standards Institute frameworks, alongside established automotive and industrial test bases. Our analysis shows Germany and the UK anchor regional demand through dense semiconductor and automotive supply chains. Technology adoption trends favor precision calibration services, while strategic outlook points to steady, compliance-driven replacement cycles rather than explosive volume growth.
Asia-Pacific Signal Detection Equipment Market Outlook
Asia-Pacific combines the largest semiconductor fabrication footprint globally with rapid 5G network buildout, positioning the region as the fastest-growing market. We found that China, Japan, South Korea, and Taiwan anchor production test demand, while India's expanding telecom base drives incremental instrument adoption. Regulatory support for domestic semiconductor manufacturing and strong technology adoption momentum underpin a strategic outlook of sustained double-digit growth through 2035.
Middle East & Africa Signal Detection Equipment Market Outlook
The Middle East & Africa market is shaped primarily by defense modernization programs and expanding telecommunications infrastructure across Gulf economies. Based on research conducted by Next Move Strategy Consulting, we found that Saudi Arabia and the UAE anchor regional defense-linked procurement, while South Africa contributes industrial and telecom-driven demand. Regulatory environments remain fragmented, and strategic outlook favors gradual capacity building supported by government-backed infrastructure investment.
Latin America Signal Detection Equipment Market Outlook
Latin America represents an emerging market where telecommunications infrastructure expansion and gradual industrial modernization drive incremental instrument demand. Our assessment indicates that Brazil anchors regional activity through expanding mobile network investment, while Argentina contributes through industrial and research-sector adoption. Regulatory frameworks remain less standardized than in mature regions, and strategic outlook favors steady, infrastructure-linked growth through the forecast period.
U.S. Signal Detection Equipment Market
Based on our estimates, U.S. generated approximately USD 1.10 billion in 2025 and is projected to reach USD 2.28 billion by 2035, expanding at a 8.5% CAGR from 2026–2035. Demand structure is anchored by defense and telecommunications procurement, with high technology adoption, strong regulatory oversight through the Federal Communications Commission, dense competitive intensity, and a strategic outlook favoring continued premium instrument investment.
Canada Signal Detection Equipment Market
The market in Canada was valued at approximately USD 0.19 billion in 2025 and is projected to reach USD 0.41 billion by 2035, expanding at a 8.9% CAGR from 2026–2035. Demand structure centers on telecommunications and research-sector procurement, with moderate technology adoption, stable regulatory influence, limited domestic competitive intensity, and a strategic outlook of steady, incremental growth.
UK Signal Detection Equipment Market
As per our estimate, UK generated approximately USD 0.21 billion in 2025 and is projected to reach USD 0.43 billion by 2035, expanding at a 8.3% CAGR from 2026–2035. Demand reflects strong compliance-driven adoption under domestic and European regulatory frameworks, moderate-to-high technology penetration, established competitive intensity among global vendors, and a strategic outlook of stable regulatory-linked growth.
Germany Signal Detection Equipment Market
According to our analysis, Germany generated approximately USD 0.28 billion in 2025 and is projected to reach USD 0.58 billion by 2035, expanding at a 8.4% CAGR from 2026–2035. Demand structure is anchored by automotive and industrial test requirements, high technology adoption, strict European Union compliance influence, dense competitive intensity, and a strategic outlook favoring continued precision instrumentation investment.
France Signal Detection Equipment Market
Based on our estimates, France generated approximately USD 0.16 billion in 2025 and is projected to reach USD 0.33 billion by 2035, expanding at a 8.1% CAGR from 2026–2035. Demand reflects aerospace and defense-linked procurement, moderate technology adoption, meaningful regulatory influence from European compliance frameworks, moderate competitive intensity, and a strategic outlook of steady defense-driven growth.
China Signal Detection Equipment Market
The market in China was valued at approximately USD 0.44 billion in 2025 and is projected to reach USD 1.10 billion by 2035, expanding at a 11.9% CAGR from 2026–2035. Demand structure is anchored by large-scale semiconductor fabrication and 5G infrastructure buildout, very high technology adoption, government-supported regulatory influence, intense domestic and international competitive activity, and a strategic outlook of sustained high growth.
India Signal Detection Equipment Market
As per our estimate, India generated approximately USD 0.13 billion in 2025 and is projected to reach USD 0.35 billion by 2035, expanding at a 13.1% CAGR from 2026–2035. Demand reflects rapidly expanding telecommunications infrastructure and growing semiconductor ambitions, rising technology adoption, evolving regulatory frameworks, increasing competitive intensity from global vendors, and a strategic outlook of the fastest regional growth trajectory.
Japan Signal Detection Equipment Market
According to our analysis, Japan generated approximately USD 0.22 billion in 2025 and is projected to reach USD 0.48 billion by 2035, expanding at a 9.6% CAGR from 2026–2035. Demand structure is anchored by mature electronics manufacturing and strong domestic instrumentation vendors, high technology adoption, stable regulatory influence, dense competitive intensity, and a strategic outlook of steady, innovation-led growth.
South Korea Signal Detection Equipment Market
Based on our estimates, South Korea generated approximately USD 0.19 billion in 2025 and is projected to reach USD 0.44 billion by 2035, expanding at a 10.4% CAGR from 2026–2035. Demand reflects concentrated semiconductor and 5G network investment, high technology adoption, supportive regulatory influence, intense competitive activity among domestic and global vendors, and a strategic outlook of above-average regional growth.
Australia Signal Detection Equipment Market
The market in Australia was valued at approximately USD 0.07 billion in 2025 and is projected to reach USD 0.15 billion by 2035, expanding at a 8.8% CAGR from 2026–2035. Demand structure centers on telecommunications and defense-linked procurement, moderate technology adoption, stable regulatory influence, limited domestic competitive intensity, and a strategic outlook of steady, infrastructure-linked growth.
UAE Signal Detection Equipment Market
As per our estimate, UAE generated approximately USD 0.06 billion in 2025 and is projected to reach USD 0.14 billion by 2035, expanding at a 9.7% CAGR from 2026–2035. Demand reflects expanding telecommunications and defense-linked infrastructure investment, rising technology adoption, government-supported regulatory influence, growing competitive intensity, and a strategic outlook of steady, investment-driven growth.
Saudi Arabia Signal Detection Equipment Market
According to our analysis, Saudi Arabia generated approximately USD 0.08 billion in 2025 and is projected to reach USD 0.18 billion by 2035, expanding at a 9.3% CAGR from 2026–2035. Demand structure is anchored by national defense modernization programs, rising technology adoption, government-directed regulatory influence, moderate competitive intensity, and a strategic outlook favoring continued defense-linked procurement growth.
South Africa Signal Detection Equipment Market
Based on our estimates, South Africa generated approximately USD 0.04 billion in 2025 and is projected to reach USD 0.08 billion by 2035, expanding at a 8.1% CAGR from 2026–2035. Demand reflects gradual industrial and telecommunications modernization, moderate technology adoption, developing regulatory frameworks, limited competitive intensity, and a strategic outlook of steady, infrastructure-linked growth.
Brazil Signal Detection Equipment Market
The market in Brazil was valued at approximately USD 0.11 billion in 2025 and is projected to reach USD 0.23 billion by 2035, expanding at a 8.6% CAGR from 2026–2035. Demand structure is anchored by expanding mobile network infrastructure investment, moderate technology adoption, developing regulatory frameworks, moderate competitive intensity, and a strategic outlook of steady, telecom-driven growth.
Argentina Signal Detection Equipment Market
As per our estimate, Argentina generated approximately USD 0.04 billion in 2025 and is projected to reach USD 0.08 billion by 2035, expanding at a 8.0% CAGR from 2026–2035. Demand reflects gradual industrial and research-sector adoption, moderate technology penetration, developing regulatory frameworks, limited competitive intensity, and a strategic outlook of steady, incremental growth.
SWOT Analysis of the Signal Detection Equipment Market:
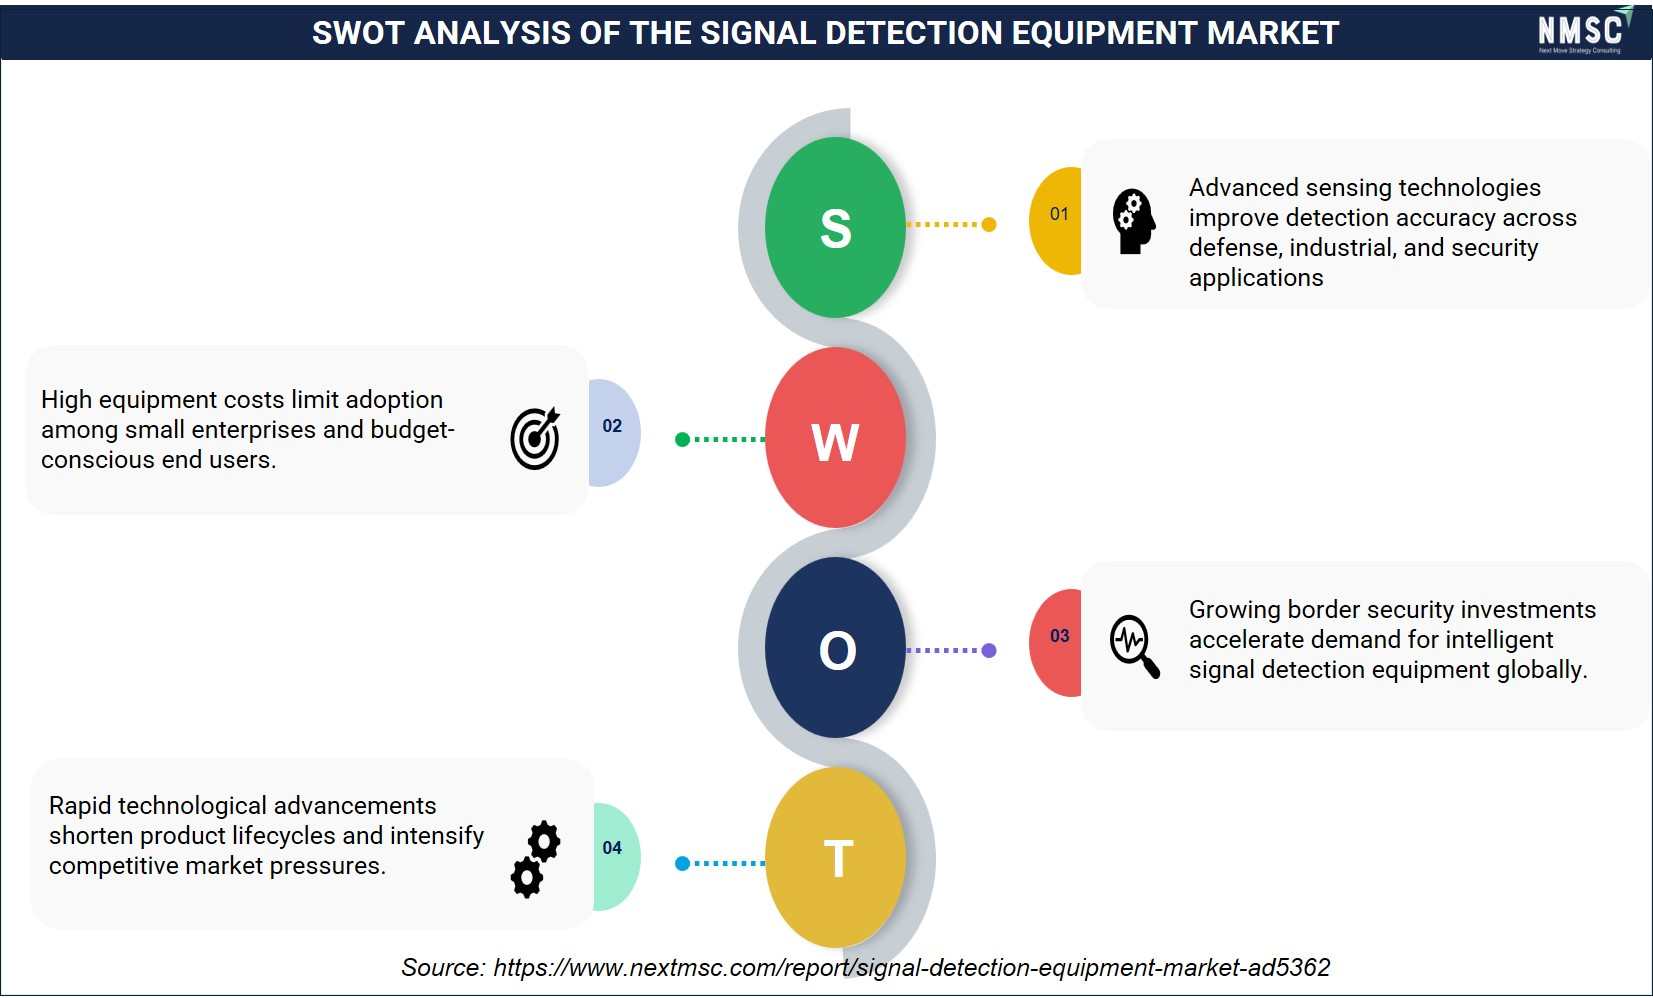
According to our market research, the Signal Detection Equipment Market benefits from advanced sensing technologies that enhance detection accuracy across defense, industrial, and security applications. Furthermore, rising border security investments create promising growth opportunities, while high equipment costs and rapid technological evolution present adoption and competitive challenges. Therefore, manufacturers focusing on innovation, cost optimization, and next-generation detection capabilities are better positioned to strengthen market presence and achieve sustainable long-term growth.
Competitive Landscape
We observed that the competitive landscape remains moderately consolidated, with established test-and-measurement leaders competing alongside specialized regional instrumentation vendors.
|
Dimension |
Assessment |
|
Market Structure |
Moderately consolidated among top global vendors, with fragmented regional competition in portable and entry-tier instruments |
|
Innovation Focus |
Software-defined platforms, millimeter-wave coverage expansion, and cloud-connected calibration services |
|
M&A Activity |
Selective bolt-on acquisitions targeting software and RF front-end technology capabilities |
How Do Companies Compete in the Signal Detection Equipment Market?
Companies compete primarily on measurement accuracy, frequency coverage, software integration depth, and calibration service quality rather than price alone. Our findings suggest that vendors differentiate through proprietary signal-processing algorithms and expanding software ecosystems that lock in customers across multi-year instrument lifecycles, while regional players compete on cost and localized support responsiveness within specific end-use verticals.
Which Competitive Archetypes Dominate the Market?
Two archetypes dominate: diversified global instrumentation leaders offering broad portfolios spanning spectrum analyzers through modular test systems, and specialized RF-focused vendors concentrating on niche frequency bands or application segments. We found that diversified leaders such as Keysight Technologies and Rohde & Schwarz dominate through platform breadth and enterprise account relationships, while specialists compete through deep technical focus in narrower applications.
What Innovation and Differentiation Strategies Are Companies Pursuing?
Companies are prioritizing software-defined architectures, artificial intelligence-assisted signal classification, and integration with tunable antennas and front-end RF components to differentiate on measurement flexibility. Our analysis shows this strategy extends instrument relevance across multiple technology-standard generations without requiring full hardware replacement.
What M&A Activity Is Shaping the Competitive Landscape?
M&A activity has concentrated on bolt-on acquisitions of software and calibration-service capabilities rather than large-scale consolidation among top-tier vendors. Next Move Strategy Consulting's analysis indicates that this selective approach reflects a maturing market where organic platform development remains the primary growth lever, with acquisitions used mainly to accelerate software roadmap execution and expand geographic service coverage.
Key Market Players
Our assessment indicates that the following companies represent the validated competitive set profiled in this report, ranked by overall market presence and portfolio breadth.
-
Keysight Technologies
-
Rohde & Schwarz
-
Teradyne, Inc.
-
National Instruments
-
Yokogawa Electric Corporation
-
Anritsu Corporation
-
Tektronix, Inc.
-
Teledyne LeCroy, Inc.
-
Chroma ATE Inc.
-
EXFO Inc.
-
HIOKI E.E. Corporation
-
RIGOL Technologies Co., Ltd.
-
Good Will Instrument Co., Ltd.
-
Siglent Technologies Co., Ltd.
-
B&K Precision Corporation
-
Bird
-
Copper Mountain Technologies
-
Aaronia AG
Latest Developments
We observed the following recent developments reflecting active product and capability investment across leading vendors.
|
Date |
Event |
|
July 2026 |
Rohde & Schwarz supplied its advanced conformance and EMI/EMC test systems to Marquistech to equip India's first GCF RTO and PTCRB Authorized Test Laboratory (ATL) in Noida, supporting local certification testing for global wireless devices |
|
May 2026 |
Keysight entered a strategic collaboration with SRC UK Limited in the United Kingdom to modernize electronic warfare test and simulation environments. The partnership supports migration to open, software-defined architectures while preserving existing threat libraries and accelerating deployment of advanced electronic warfare testing capabilities. |
|
April 2026 |
Teradyne completed the acquisition of TestInsight, a premier provider of semiconductor test development, pre-silicon validation, and automated pattern conversion tools, significantly accelerating time-to-market workflows for complex AI and data center silicon. |
Investment Opportunities
How Are Capital Inflows Shaping the Market?
Capital inflows are increasingly directed toward software and calibration-service capabilities rather than pure hardware expansion. Industry-derived estimates suggest that private and strategic investment in RF test software has grown meaningfully as vendors seek recurring revenue streams, reflecting broader capital-allocation shifts toward asset-light, higher-margin business lines within the signal detection equipment value chain.
What Infrastructure Investment Supports Market Growth?
Government-backed semiconductor fabrication investment and expanding 5G from space satellite infrastructure programs are creating durable infrastructure-linked demand for test instrumentation, with national industrial policy programs in the United States, European Union, and several Asia-Pacific economies directly supporting fabrication and network-validation capacity expansion.
How Do ESG Considerations Factor into Investment Decisions?
Environmental, Social, and Governance considerations increasingly influence procurement, with buyers favoring instrument vendors demonstrating energy-efficient product design and responsible electronic-waste handling practices. Our assessment indicates that calibration and refurbishment service models, which extend instrument lifecycle and reduce electronic waste, are gaining procurement preference among enterprise and government buyers applying formal ESG screening criteria.
Key Benefits for Stakeholders
How Does This Report Benefit Industry Leaders?
Industry leaders gain access to validated segmentation, competitive benchmarking, and regional demand analysis that support product roadmap prioritization and capacity-planning decisions. Our analysis shows that this level of granularity helps enterprise buyers and manufacturers align procurement and R&D investment with the fastest-growing technology standards and end-use verticals identified throughout this report.
How Does This Report Benefit Investors and Financial Analysts?
Investors and financial analysts benefit from consolidated market sizing, CAGR forecasts, and competitive-landscape assessment that support valuation and capital-allocation decisions. We found that the report's regional and segment-level breakdowns help identify where structural growth is most durable, supporting more informed comparison across instrumentation vendors and adjacent test-and-measurement investment opportunities.
How Does This Report Benefit Technology Vendors and Product Teams?
Technology vendors and product teams benefit from detailed segmentation across equipment type, deployment form, and technology standard that clarifies where product development investment aligns with the fastest-growing demand pockets. Our assessment indicates that this analysis supports more precise roadmap sequencing for software, calibration-service, and next-generation frequency-coverage investments through 2035.
Key Market Segments
By Equipment
-
Signal and Spectrum Analyzers
-
Benchtop Signal Analyzers
-
Handheld Signal Analyzers
-
Real-Time Spectrum Analyzers
-
Spectrum Monitoring Receivers
-
-
Network Analyzers
-
Vector Network Analyzers
-
Cable and Antenna Analyzers
-
-
Oscilloscopes
-
Digital Oscilloscopes
-
Mixed-Signal Oscilloscopes
-
Sampling Oscilloscopes
-
-
Communications Testers
-
Wireless Communications Testers
-
Ethernet Testers
-
Transport Network Testers
-
Protocol Testers
-
Drive-Test Systems
-
-
Modular Test Systems
-
PXI Systems
-
Rackmount Automated Test Systems
-
Production Test Platforms
-
-
RF Monitoring Equipment
-
RF Monitoring Systems
-
Direction Finding Systems
-
Interference Detection Systems
-
-
Other Signal Detection Equipment
By Deployment Form
-
Benchtop
-
Portable
-
Rackmount
-
Embedded
By Revenue Stream
-
Hardware
-
Software
-
Services
-
Accessories and Calibration
By Technology Standard
-
5G and 6G
-
Wi-Fi
-
Ethernet and Time-Sensitive Networking
-
Radar
-
Satellite Communications
-
Electromagnetic Compatibility and Compliance
-
Other Communication Standards
By Sales Channel
-
Direct Sales
-
Authorized Distributor
-
E-Commerce
-
System Integrator
-
Rental and Leasing
By End Use Industry
-
Telecommunications and Datacom
-
Semiconductor and Electronics
-
Aerospace and Defense
-
Automotive
-
Industrial and Energy
-
Academic and Research
-
Other Industries
By Region
-
North America: U.S., Canada, Mexico.
-
Europe: UK, Germany, France, Italy, Spain, Sweden, Denmark, Finland, Netherlands, Rest of Europe.
-
Asia-Pacific: China, India, Japan, South Korea, Taiwan, Indonesia, Vietnam, Australia, Philippines, Malaysia, Rest of APAC.
-
Middle East & Africa: Saudi Arabia, UAE, Egypt, Israel, Turkey, Nigeria, South Africa, Rest of MEA.
-
Latin America: Brazil, Argentina, Chile, Colombia, Rest of LATAM.
Conclusion & Recommendations
What Is the Long-Term Outlook for the Market?
The long-term outlook remains favorable, with the market projected to grow from USD 4.52 billion in 2026 to USD 9.42 billion by 2035 at an 8.5% CAGR. We observed that sustained 5G/6G rollout, semiconductor capacity expansion, and defense modernization collectively underpin durable, multi-year demand rather than a short-term cyclical upswing.
What Strategic Positioning Should Vendors Pursue?
Vendors should prioritize software-defined, modular platform architectures that extend instrument relevance across successive technology-standard transitions. Our assessment indicates that companies pairing hardware breadth with recurring software and calibration-service revenue are best positioned to defend margin and account share as buyers consolidate vendor relationships.
How Attractive Is the Market for New Investment?
Investment attractiveness remains high given the absolute dollar opportunity of USD 4.90 billion between 2026 and 2035, concentrated in RF monitoring, satellite communications test, and automotive radar validation segments. We found that these pockets offer above-market CAGR relative to the 8.5% overall market rate, appealing to investors seeking exposure to structural rather than cyclical growth.
What Market Shifts and Key Risks Should Stakeholders Monitor?
Stakeholders should monitor the high capital cost of advanced instrumentation and extended calibration cycles, both of which could slow adoption among smaller buyers in price-sensitive geographies. Our analysis shows that skilled RF test engineer shortages in North America and Europe represent an additional risk that could constrain service-capacity growth despite strong underlying demand.
What Are the Primary Growth Pathways Through 2035?
Primary growth pathways include expanding RF monitoring beyond defense into commercial spectrum management, deepening automotive radar test integration, and scaling satellite communications validation alongside AI-enabled electronic warfare and counter-drone test requirements, each representing durable, technology-standard-linked demand through the forecast period.
About the Author
 Saista Faiyaz
— Saista Faiyaz is Research Associate at Next Move Strategy Consulting, where she has covered consumer markets and healthcare technologies for 3 years. Her work includes primary interview review, secondary-source validation, market sizing, and structured analysis of company and industry data. She supports research by comparing evidence across sources, organizing findings into market narratives, and documenting assumptions used in analysis. Her scope includes cross-market benchmarking, and reports.
Saista Faiyaz
— Saista Faiyaz is Research Associate at Next Move Strategy Consulting, where she has covered consumer markets and healthcare technologies for 3 years. Her work includes primary interview review, secondary-source validation, market sizing, and structured analysis of company and industry data. She supports research by comparing evidence across sources, organizing findings into market narratives, and documenting assumptions used in analysis. Her scope includes cross-market benchmarking, and reports.
About the Reviewer
 Supradip Baul
— Supradip Baul is an accomplished business consultant and strategist with over a decade of rich experience in market intelligence, strategy, technology, and business transformation. His work has included rigorous qualitative and quantitative analysis across multiple industries, helping clients shape investment decisions and long-term roadmaps. Earlier in his career, he was associated with Gartner, where he contributed to industry-leading reports and market share analyses. He has worked with leading global companies and holds an MBA with a dual specialization in Marketing and Finance.
Supradip Baul
— Supradip Baul is an accomplished business consultant and strategist with over a decade of rich experience in market intelligence, strategy, technology, and business transformation. His work has included rigorous qualitative and quantitative analysis across multiple industries, helping clients shape investment decisions and long-term roadmaps. Earlier in his career, he was associated with Gartner, where he contributed to industry-leading reports and market share analyses. He has worked with leading global companies and holds an MBA with a dual specialization in Marketing and Finance.
At Next Move Strategy Consulting, we understand that insightful market research is the cornerstone of successful business decisions. That's why we employ a robust and multifaceted approach, combining various methodologies to deliver the most accurate and actionable data for our clients.

Research Landscape
We navigate the world of research with two primary approaches:
Qualitative Approach
Our qualitative research methodologies involve immersive techniques such as in-depth interviews, focus groups, and observational studies. By engaging directly with individuals and stakeholders, we uncover valuable insights that quantitative data alone may overlook.

Quantitative Research
In tandem with qualitative methodologies, NMSC leverages the power of Quantitative Research to provide a robust foundation of numerical insights. Through systematic data collection and analysis, we quantify patterns, preferences, and market trends, offering a comprehensive view of the business landscape.
Our quantitative research approach employs diverse tools, including surveys, experiments, and statistical modelling. These methodologies enable us to gather data from a large and representative sample, ensuring the statistical significance of our findings. By employing structured questionnaires and standardized data collection methods, we guarantee the reliability and validity of the information we present to our clients.
Quantitative research is particularly effective in measuring the prevalence of trends, assessing market size, and gauging the impact of various factors on consumer behavior. The numerical precision attained through this approach equips our clients with actionable insights, facilitating data-driven decision-making and strategy formulation.


Our Specialized Toolbox for Industry-Specific Market Research
We deploy a specialized arsenal of techniques tailored to meet your unique requirements. Here's a glimpse into our comprehensive toolbox:

Information Procurement
The stage entails acquiring market data or relevant information through various sources and methodologies.


Market Research Approach
We utilize both top-down and bottom-up approaches in market research analysis to achieve a comprehensive understanding of the market dynamics, leveraging the broad perspective of industry trends and macroeconomic factors alongside detailed insights from specific segments and individual companies.

Porters Five Forces Analysis
We conduct Porter's Five Forces analysis to evaluate the competitive landscape of an industry, providing us with insights into factors that affect profitability and strategic positioning.

SWOT Analysis

Forecasting
We utilize a forecasting model to predict future consumption by considering parameters like population, economics, regulations, market competition, drivers, constraints, technology, and pricing. We also employ statistical techniques such as multilinear regression, exponential smoothing, moving average, ARIMA, and Monte Carlo simulations for accurate predictions. In econometric forecasting, we analyzed short-term and long-term event impacts, attributing values based on regulatory frameworks, economic factors, and market events.





 Speak to Our Analyst