Medical Simulation Market by Product & Services (Anatomical Models, Web-Based Simulation, and Simulation Training Services), by Technology (Virtual Patient Simulation, 3D Printing, and Procedure Rehearsal Technology), by Fidelity (Low-Fidelity, Medium-Fidelity, and High-Fidelity), and by End User (Hospitals, Military Organizations, Research Institutes, and Others) - Global Opportunity Analysis and Industry Forecast, 2020 – 2030
Industry: Healthcare | Lastest Edition: January 5, 2026 | No of Pages: 372 | No. of Tables: 288 | No. of Figures: 233 | Format: PDF | Report Code : HC46
Market Definition
The global Medical Simulation Market size was valued at USD 1.69 billion in 2019, and is predicted to reach USD 7.64 billion by 2030, with a CAGR of 14.7% from 2020-2030.
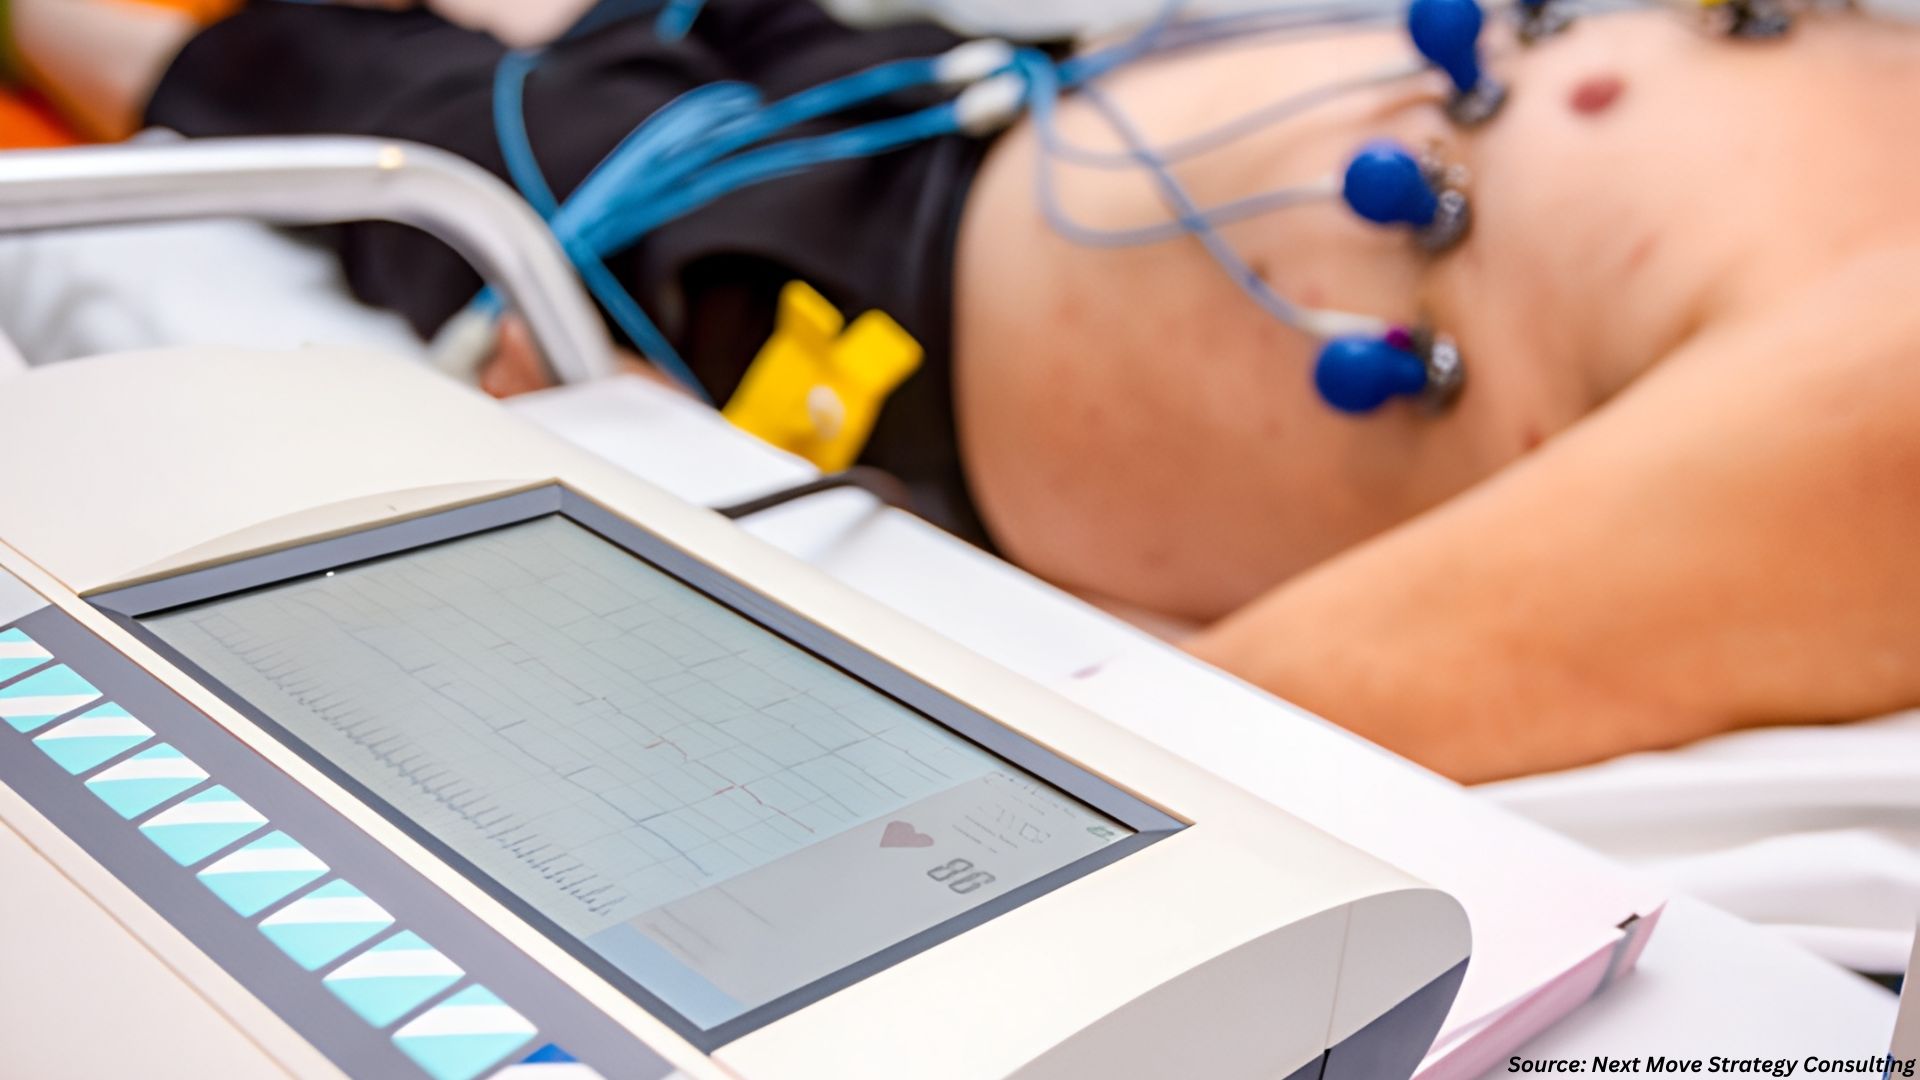
Medical simulation or healthcare simulation involves artificial or human simulated patients, animated simulants, holographic simulants, or their combination, to create an artificial representation of the real clinical scenarios.
Medical simulation aims to impart education and train healthcare professionals to perform general practice, prescription, crisis interventions, surgery, casualty assessment in homeland security, as well as emergency response in military situations. Along with healthcare facilities, and military services; medical simulation hold wide applications in educational institutes, and research centres.
Market Dynamics and Trends
There has been an upsurge in minimally invasive surgeries over the period, owing to fast and easy patient recovery. This in-turn has increased the demand for explicitly trained healthcare professionals who can carry out various medical practices and surgeries, with reduced errors and higher precision.
Furthermore, factors such as growing concern regarding patient safety, increasing incidences of medical errors, technological advents in medical simulations, as well as increased penetration of animated and web-based simulation, are anticipated to propel the medical simulation market growth throughout the forecast period.
However, high cost of the products, software, and set-ups; along with high unmet needs, and compliance issues are expected to limit the growth of the medical simulation market.
Market Segmentations and Scope of the Study
The global medical simulation market report has been analyzed based on product and service, fidelity, end user and geography. Based on product, the market is segmented into model-based simulation, web-based simulation, and simulation training services. The model-based simulation segment is sub segmented into patient simulation, surgical simulation and ultrasound simulation. The fidelity are divided into low fidelity, medium fidelity and high fidelity. Based on end users, the market is categorized into academic institutes and research centers, hospitals & clinics, and military organizations. Geographic breakdown and analysis of each of the previously mentioned segments include regions comprising North America, Europe, Asia-Pacific, and RoW.
Geographical Analysis
North America holds the major market share in the global market and is expected to maintain its dominance over the forecast period. The factors attributed to the medical simulation market growth include increase in patient safety norms, technological advancements, along with increasing demand for healthcare services.
It is expected that the emerging economies, specifically in the Asia-Pacific region would witness increasing market size owing to the development of healthcare facilities, increase in commercialization of medical simulators, higher adoption of advanced technology and augmentation in healthcare spending by public as well as private sectors.
Competitive Landscape
The Medical simulation industry, is consolidated and consists of a few major players such as Simulab Corporation, Limbs And Things, Ltd., CAE Ltd., Anesoft Corporation, 3B Scientific GmbH, Surgical Science, Gaumard Scientific Company, Inc., Kyoto Kagaku Co. Ltd., Laerdal Medical, MedVision, Mentice AB, Medical-X, Simulaids Inc., Operative Experience, Inc., Inovus Limited and others.
The key players are employing strategies such as technical collaboration, capacity expansion, acquisition, and advanced product launches, in-order to gain stronger position in the medical simulation market.
For instance, in January 2019, CAE Healthcare, one of the major players in the global market, announced collaboration with a UK-based software company TWME8 to create simulation-based learning scenarios that meet the highest educational standards.
In July 2019, Laerdal Medical, a pioneer manufacturer in the market, announced the acquisition over B-Line Medical, a leader in simulation debriefing assessment and management; to create premium debriefing, assessment, and training management platform. With this acquisition, Laerdal Medical aims to deliver the highest quality healthcare education, training, and quality improvement programs to the consumers.
In September 2024, Operative Experience Inc. launched their PCCS Pro Female trauma simulator became the first female trauma care simulator accredited and procured by the U.S. Army.
In February 2020, 3B Scientific GmbH, one of the major players in the global market, inaugurated its new Simulation Training Center for Medical Simulation and Skill Training, in Germany. The well-equipped 500 sqm training center located in the heart of Hamburg city, displays advanced medical simulators, and professional task trainers, that impart basic, advanced, and super specialty skilled medical trainings.
Medical Simulation Market Key Segments
By Product and Service
-
Anatomical Models
-
Patient Simulators
-
Task Trainers
-
Surgical Simulators
-
Ultrasound Simulators
-
Dental Simulators
-
Eye Simulators
-
-
Web Based Simulation
-
Simulation Software
-
Performance Recording Software
-
Virtual Tutors
-
-
Simulation Training Services
-
Vendor-Based Training
-
Custom Consulting and Training Services
-
Educational Societies
-
By Technology
-
Virtual Patient Simulation
-
3D Printing
-
Procedure Rehearsal Technology
By Fidelity
-
Low Fidelity
-
Medium Fidelity
-
High Fidelity
By End Users
-
Hospitals
-
Military Organizations
-
Research Institutes
-
Others
By Geography
-
North America
-
U.S.
-
Canada
-
Mexico
-
-
Europe
-
UK
-
Italy
-
Germany
-
Spain
-
Netherlands
-
Rest of Europe
-
-
Asia-Pacific
-
China
-
Japan
-
India
-
Australia
-
South Korea
-
Taiwan
-
Vietnam
-
Rest of Asia Pacific
-
-
RoW
-
Latin America
-
Middle East
-
Africa
-
Key Players
-
Simulab Corporation
-
Limbs And Things, Ltd.
-
CAE Ltd.
-
Anesoft Corporation
-
3B Scientific GmbH
-
Surgical Science
-
Gaumard Scientific Company, Inc.
-
Kyoto Kagaku Co. Ltd.
-
Laerdal Medical
-
MedVision
-
Mentice AB
-
Medical-X
-
Simulaids Inc.
-
Operative Experience, Inc.
-
Inovus Limited
Report Scope and Segmentation
|
Parameters |
Details |
|
Analysis Period |
2019–2030 |
|
Base Year Considered |
2020 |
|
Forecast Period |
2020–2030 |
|
Market Size Estimation |
Billion (USD) |
|
Market Segmentation |
By Product & Service (Anatomical Models, Web-Based Simulation, Simulation Training Services), By Technology(Virtual Patient Simulation, 3D Printing, Procedure Rehearsal Technology), By Fidelity (High-Fidelity, Medium-Fidelity, Low-Fidelity), By End User (Academic Institutions, Hospitals, Military Organizations, Others) |
|
Geographical Segmentation |
North America (U.S., Canada, Mexico), Europe (Germany, France,Italy, Spain, UK, Russia, Sweden, Norway, Denmark, Netherlands, Finalnd, Rest of Europe), Asia-Pacific (Australia, China, India, Japan, South Korea, Indonesia, Singapore, Taiwan, Thailand, Rest of Asia Pacific), RoW (Latin America, Middle East, Africa) |
|
Companies Profiled |
Simulab Corporation, Limbs And Things, Ltd., CAE Ltd., Anesoft Corporation, 3B Scientific GmbH, Surgical Science, Gaumard Scientific Company, Inc., Kyoto Kagaku Co. Ltd., Laerdal Medical, MedVision, Mentice AB, Medical-X, Simulaids Inc., Operative Experience, Inc., Inovus Limited |
")


About the Author
 Jayanta Das is a senior research analyst delivering high-impact market intelligence across global markets. He leads comprehensive studies covering market assessment, forecasting, competitive evaluation, regulatory review, and trend analysis. Known for his structured and methodical approach, Jayanta excels at converting complex datasets into clear, decision-ready insights for leadership teams. His work supports strategic planning through credible sourcing, analytical precision, strong validation frameworks, and well-structured, business-focused reporting that enables confident decision-making.
About the Reviewer
 Supradip Baul is an accomplished business consultant and strategist with over a decade of rich experience in market intelligence, strategy, technology, and business transformation. His work has included rigorous qualitative and quantitative analysis across multiple industries, helping clients shape investment decisions and long-term roadmaps. Earlier in his career, he was associated with Gartner, where he contributed to industry-leading reports and market share analyses. He has worked with leading global companies and holds an MBA with a dual specialization in Marketing and Finance.
At Next Move Strategy Consulting, we understand that insightful market research is the cornerstone of successful business decisions. That's why we employ a robust and multifaceted approach, combining various methodologies to deliver the most accurate and actionable data for our clients.

Research Landscape
We navigate the world of research with two primary approaches:
Qualitative Approach
Our qualitative research methodologies involve immersive techniques such as in-depth interviews, focus groups, and observational studies. By engaging directly with individuals and stakeholders, we uncover valuable insights that quantitative data alone may overlook.

Quantitative Research
In tandem with qualitative methodologies, NMSC leverages the power of Quantitative Research to provide a robust foundation of numerical insights. Through systematic data collection and analysis, we quantify patterns, preferences, and market trends, offering a comprehensive view of the business landscape.
Our quantitative research approach employs diverse tools, including surveys, experiments, and statistical modelling. These methodologies enable us to gather data from a large and representative sample, ensuring the statistical significance of our findings. By employing structured questionnaires and standardized data collection methods, we guarantee the reliability and validity of the information we present to our clients.
Quantitative research is particularly effective in measuring the prevalence of trends, assessing market size, and gauging the impact of various factors on consumer behavior. The numerical precision attained through this approach equips our clients with actionable insights, facilitating data-driven decision-making and strategy formulation.


Our Specialized Toolbox for Industry-Specific Market Research
We deploy a specialized arsenal of techniques tailored to meet your unique requirements. Here's a glimpse into our comprehensive toolbox:

Information Procurement
The stage entails acquiring market data or relevant information through various sources and methodologies.


Market Research Approach
We utilize both top-down and bottom-up approaches in market research analysis to achieve a comprehensive understanding of the market dynamics, leveraging the broad perspective of industry trends and macroeconomic factors alongside detailed insights from specific segments and individual companies.

Porters Five Forces Analysis
We conduct Porter's Five Forces analysis to evaluate the competitive landscape of an industry, providing us with insights into factors that affect profitability and strategic positioning.

SWOT Analysis

Forecasting
We utilize a forecasting model to predict future consumption by considering parameters like population, economics, regulations, market competition, drivers, constraints, technology, and pricing. We also employ statistical techniques such as multilinear regression, exponential smoothing, moving average, ARIMA, and Monte Carlo simulations for accurate predictions. In econometric forecasting, we analyzed short-term and long-term event impacts, attributing values based on regulatory frameworks, economic factors, and market events.


 Speak to Our Analyst


 Systems Market")