AI Carbon Accounting Market Size, Share, Trends and Growth Analysis, By Software Subscriptions (Standalone Platform, Embedded Module, Carbon Data API, and Services), By Buyer Size (Enterprise, Mid-Market, SMEs), By Channel (Direct, Partner, Marketplace, OEM), By End-User Industry (Energy and Utilities, Manufacturing, Retail and Consumer Packaged Goods, Food and Beverage), and Region — Industry Report and Forecast, 2026-2035
Industry: ICT & Media | Publishing Date: July 17, 2026 | Last Updated: September 30, 2026 | No of Pages: N/A | No. of Tables: N/A | No. of Figures: N/A | Format: PDF | Report Code: IC5213
What Is the AI Carbon Accounting Market Size?
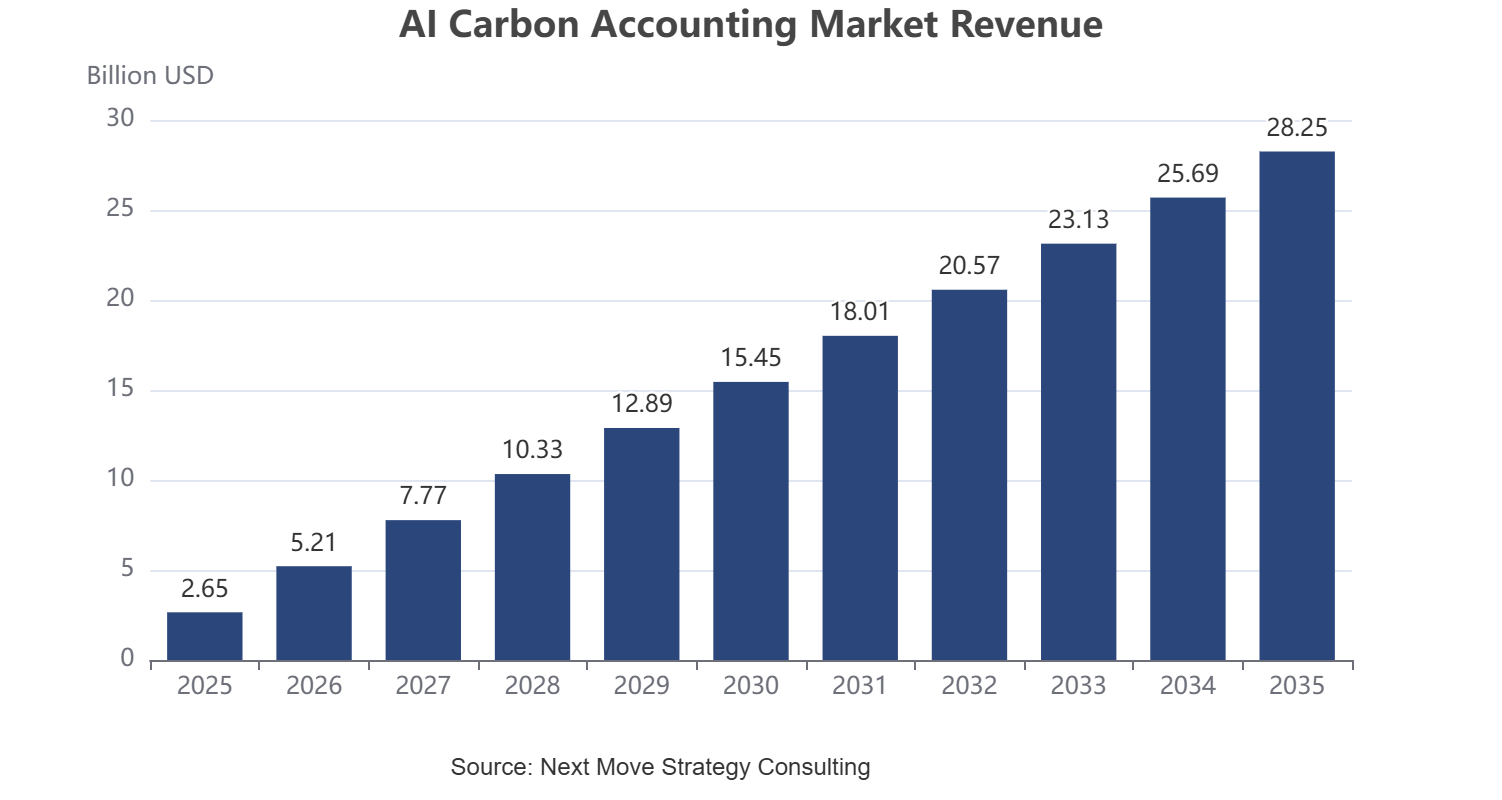
We observed that the AI Carbon Accounting Market generated USD 2.65 Billion in 2025 and is set to reach USD 3.36 Billion in 2026, advancing to USD 28.25 Billion by 2035 at a 26.7% CAGR. North America holds approximately 35.8% share, while Standalone Platform leads adoption with approximately 47.2% share of 2025 revenue.
During our market evaluation, we noticed that adoption is broadening across every segmentation axis, with AI-driven emission-factor automation and Scope 3 supply chain data collection acting as the dominant structural catalysts through 2035.
|
Key Takeaways |
|
By Software Subscriptions: Standalone Platform held the largest share of approximately 47.2% (USD 1.25 Billion) in 2025; Carbon Data API is the fastest-growing sub-segment at 35.9% CAGR from 2026-2035. |
|
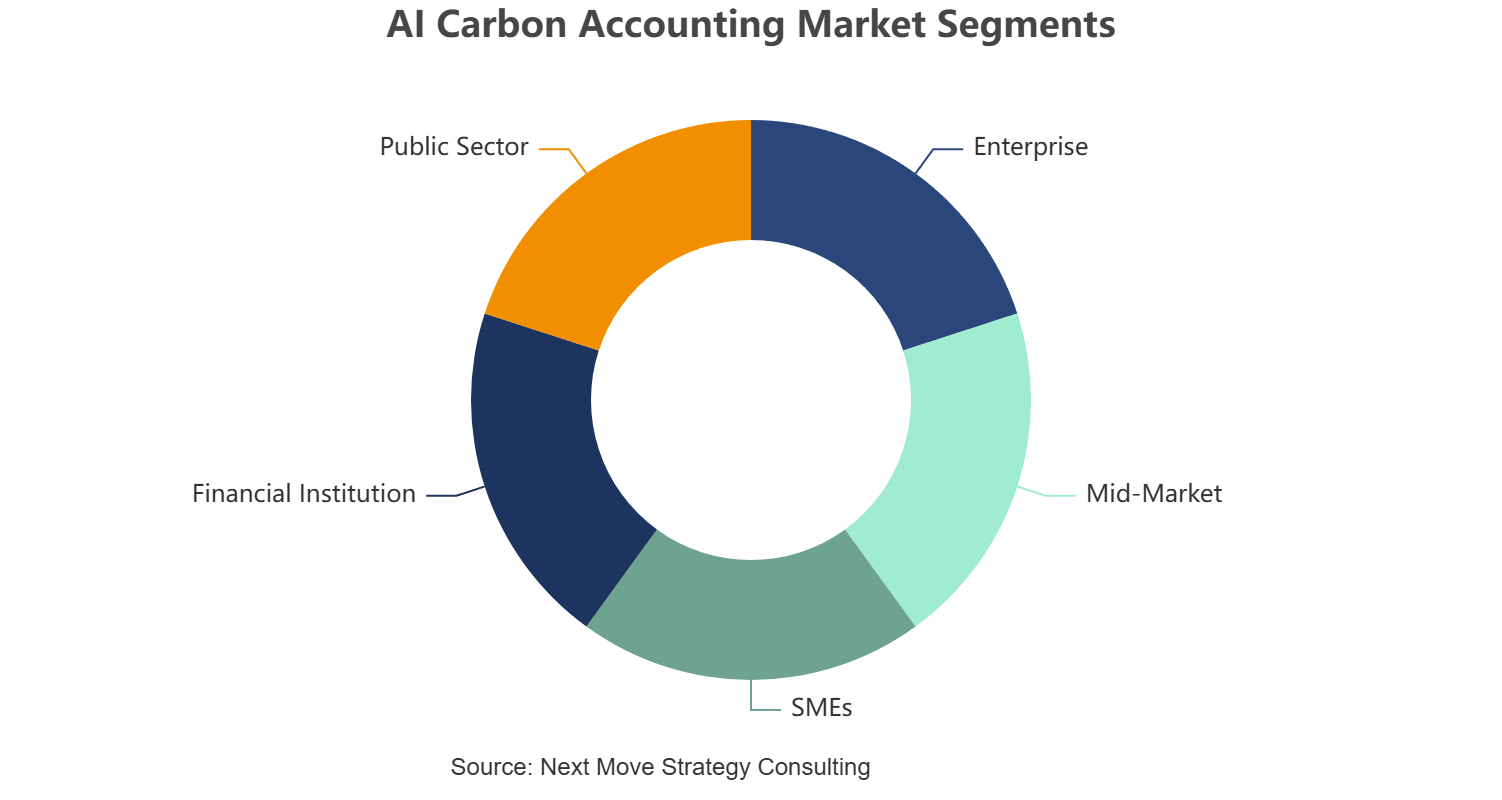
By Buyer Size: Enterprise held the largest share of approximately 44.2% (USD 1.17 Billion) in 2025; Public Sector is the fastest-growing sub-segment at 32.9% CAGR from 2026-2035. |
|
By Channel: Direct held the largest share of approximately 42.0% (USD 1.11 Billion) in 2025; Marketplace is the fastest-growing sub-segment at approximately 30.5% CAGR from 2026-2035. |
|
By End-User Industry: Manufacturing held the largest share of approximately 18.5% (USD 0.49 Billion) in 2025; Financial Services is the fastest-growing sub-segment at 31.9% CAGR from 2026-2035. |
|
Dominant Region: North America dominated with approximately 35.8% revenue share (USD 0.95 Billion) in 2025. |
|
Fastest-Growing Region: Asia-Pacific is expected to register the highest CAGR of 33.0% during 2026-2035. |
|
Dominant Country: U.S. led with approximately USD 0.82 Billion in 2025. |
|
Fastest-Growing Country: India is the fastest-growing country at approximately 37.0% CAGR from 2026-2035. |
Between 2026 and 2035, the AI Carbon Accounting Market is set to generate an absolute dollar opportunity of USD 24.89 Billion, positioning AI-native emission-factor engines and embedded ERP modules as a compelling area for capital allocation.
According to NMSC analysis, sustained investment in Scope 3 data automation and financed-emissions analytics is reshaping vendor selection criteria for enterprises and financial institutions, as regulatory divergence between U.S. federal and state frameworks increasingly determines platform architecture choices.
Ecosystem Analysis of the AI Carbon Accounting Market
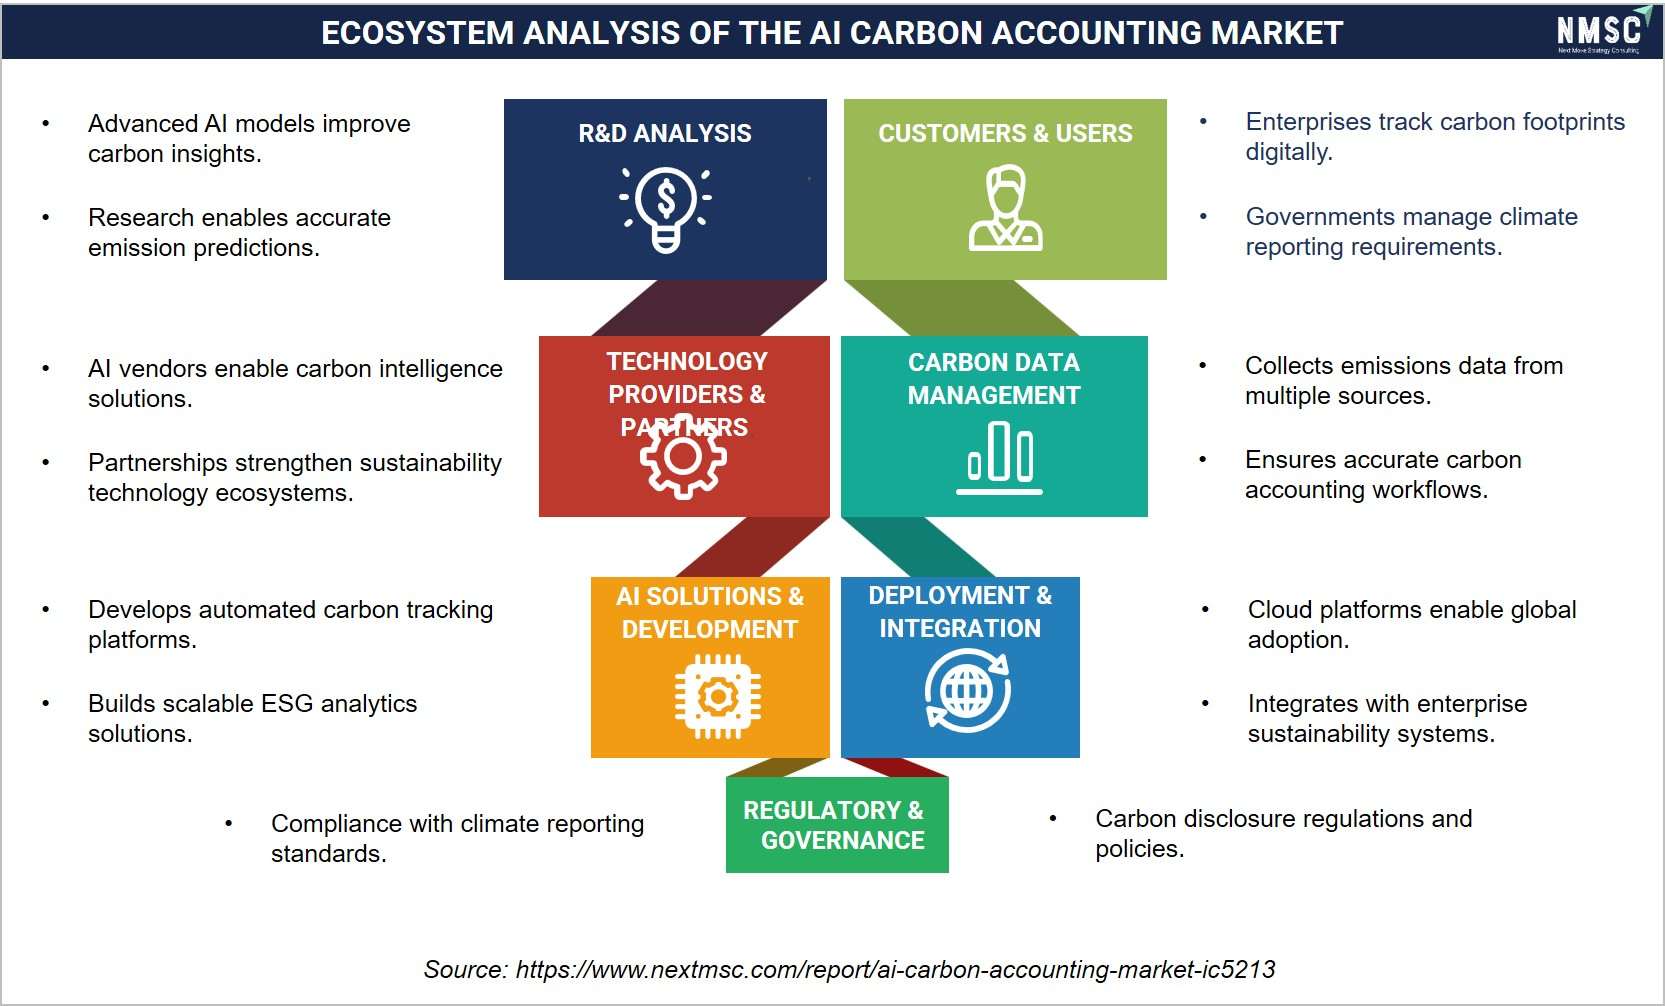
The above infographic presents an ecosystem analysis of the AI Carbon Accounting Market, where advanced AI models and research are driving accurate emission predictions. These capabilities are supported by technology vendors and sustainability partnerships, which together enable the development of automated carbon tracking and ESG analytics platforms. At the same time, compliance with climate reporting standards strengthens governance, while cloud-based deployment and enterprise integration ensure widespread adoption. Looking ahead, we observed that these interconnected elements are collectively helping businesses and governments manage their carbon footprints more effectively.
What does the AI Carbon Accounting Market Encompass?
The AI Carbon Accounting Market encompasses software and data platforms that apply machine learning and automation to measure, calculate, and report an organization's Scope 1, 2, and 3 greenhouse gas emissions. Our assessment indicates that the scope spans standalone platforms, ERP and ESG-suite embedded modules, emission-factor and calculation-engine APIs, and advisory services supplied to enterprises, mid-market firms, financial institutions, and public sector bodies across energy, manufacturing, retail, and financial services end markets.
We found that the category has evolved from spreadsheet-based reporting into an AI-native discipline, driven by the EU Corporate Sustainability Reporting Directive, California's SB 253 and SB 261, and the International Sustainability Standards Board's IFRS S2 framework. Technology adoption trends favor platforms that ingest supplier invoices, utility bills, and bill-of-materials data automatically, reducing manual emissions-inventory workloads for sustainability teams.
|
Parameter |
Details |
|
Market Size in 2025 |
USD 2.65 Billion |
|
Market Size in 2026 |
USD 3.36 Billion |
|
Revenue Forecast in 2035 |
USD 28.25 Billion |
|
Growth Rate |
CAGR of 26.7% from 2026 to 2035 |
|
Analysis Period |
2025–2035 |
|
Base Year Considered |
2025 |
|
Forecast Period |
2026–2035 |
|
Market Size Estimation |
Revenue (USD Billion) |
|
Companies Profiled |
20 |
|
Countries Covered |
38 |
|
Market Share |
Available for Top 10 Companies |
Key Emerging Trends
Our analysis shows that four trends are reshaping how enterprises procure and deploy carbon accounting technology through 2035.
How Is Agentic AI Transforming Emissions Data Collection in the AI Carbon Accounting Market?
Agentic AI models now reconcile utility bills, ERP purchase orders, and supplier invoices without manual mapping, cutting inventory-build time from months to weeks. We observed that this shift is moving carbon accounting from an annual compliance exercise toward continuous, near-real-time emissions monitoring. Persefoni's embedded AI assistant, for example, now flags statistical anomalies in customer emissions data automatically, illustrating how vendors are operationalizing this transformation across enterprise deployments.
Why Is Product-Level Carbon Footprinting Gaining Adoption in the AI Carbon Accounting Market?
Brand owners increasingly need SKU-level emissions data to satisfy the EU Carbon Border Adjustment Mechanism and retailer scorecards. Normative's 2026 product carbon footprint capability, which uses AI-powered bill-of-materials ingestion, illustrates how vendors are extending calculation engines below the corporate level. Our findings suggest that this shift is pulling manufacturing and retail buyers toward platforms with granular, activity-based data models rather than spend-based estimates.
How Are Embedded Modules Reshaping Buyer Behavior in the AI Carbon Accounting Market?
Enterprises running SAP, Salesforce, or Microsoft ecosystems increasingly prefer carbon modules embedded inside existing ERP and CRM systems over standalone tools, reducing integration overhead. We observed that this trend is compressing sales cycles for platform incumbents while pressuring standalone vendors to deepen API connectivity, a dynamic reflected in Diligent's 2025 decision to migrate its carbon accounting clients to Persefoni's platform rather than continue independent development.
What Role Does Financed Emissions Software Play in Market Expansion?
Banks and asset managers face growing pressure to disclose portfolio-level financed emissions under PCAF-aligned methodologies. Our assessment indicates that Persefoni's finance-specific portfolio analytics, covering emission intensity and asset-class breakdowns for private equity and banking clients, exemplify how vendors are building dedicated financial-institution offerings rather than adapting corporate tools.
Growth Drivers & Restraints
Growth Catalyst & Risk Assessment Matrix
|
Factors |
Type |
(+/-) % Impact on CAGR |
Geographic Relevance |
Impact Timeline |
|
EU CSRD and ESRS phased rollout |
Driver |
+4.8% |
Europe |
2026–2029 |
|
California SB 253 Scope 1/2 reporting deadline |
Driver |
+3.6% |
North America |
2026–2027 |
|
AI-native emission-factor automation |
Driver |
+5.2% |
Global |
2026–2035 |
|
ISSB IFRS S2 voluntary state adoption |
Driver |
+2.9% |
Asia-Pacific, LATAM |
2026–2030 |
|
Vendor consolidation and platform migration |
Driver |
+2.1% |
Global |
2026–2028 |
|
Financed-emissions demand from banks and PE firms |
Driver |
+2.4% |
North America, Europe |
2026–2032 |
|
SEC federal climate rule rescission proposal |
Restraint |
-2.6% |
North America |
2026–2027 |
|
SB 261 Ninth Circuit litigation uncertainty |
Restraint |
-1.8% |
North America |
2026–2027 |
|
Data quality and Scope 3 supplier engagement gaps |
Restraint |
-2.2% |
Global |
2026–2030 |
|
SME budget constraints for enterprise-tier pricing |
Restraint |
-1.5% |
Global |
2026–2029 |
What Is the Primary Growth Driver in the AI Carbon Accounting Market?
Mandatory state and regional disclosure regimes represent the primary growth driver. California's SB 253 sets an August 10, 2026 deadline for Scope 1 and Scope 2 reporting by companies with over USD 1 billion in revenue, a threshold CARB finalized on February 26, 2026. We observed that compliance-driven procurement is pulling first-time buyers into the market well ahead of any federal mandate.
How Is AI Automation Driving the AI Carbon Accounting Market Growth?
AI-driven data ingestion is reducing the cost and time of building an emissions inventory, which our analysis shows is the single largest barrier to smaller-company adoption. Vendors, including Watershed and Sweep, now offer automated utility-bill scanning and anomaly detection, converting what previously required dedicated sustainability staff into a largely automated workflow, expanding the addressable buyer base into mid-market and SME segments.
What Is Restraining the AI Carbon Accounting Market?
Regulatory uncertainty at the U.S. federal level is the primary restraint. The SEC voted on March 27, 2025 to end its defense of the 2024 climate disclosure rules and proposed their rescission on May 29, 2026, leaving companies without a unifying national mandate. This fragmentation is delaying purchasing decisions among U.S. companies not directly captured by California or EU requirements.
Segmentation Analysis
Segment Sizing: By Software Subscriptions
|
Segment |
2025 (USD) |
2035 (USD) |
CAGR% (2026-2035) |
|
Standalone Platform |
1.25 Billion |
11.72 Billion |
28.2% |
|
Embedded Module |
0.64 Billion |
6.64 Billion |
29.7% |
|
Carbon Data API |
0.42 Billion |
6.64 Billion |
35.9% |
|
Services |
0.34 Billion |
3.25 Billion |
28.5% |
|
Total |
2.65 Billion |
28.25 Billion |
26.7% |
Which Software Subscription Segment Leads the AI Carbon Accounting Market?
Standalone Platform led with approximately 47.2% share in 2025, reflecting enterprise preference for dedicated measurement and reporting suites during initial regulatory build-out. Carbon Data API is the fastest-growing sub-segment at 35.9% CAGR, as vendors increasingly license emission-factor and calculation-engine access directly into partner and OEM software rather than selling full platforms, a shift consistent with the embedded-module trend documented in this report.
Segment Sizing: By Buyer Size
|
Segment |
2025 (USD) |
2035 (USD) |
CAGR% (2026-2035) |
|
Enterprise |
1.17 Billion |
11.16 Billion |
28.5% |
|
Mid-Market |
0.72 Billion |
7.63 Billion |
30.0% |
|
SMEs |
0.37 Billion |
4.66 Billion |
32.5% |
|
Financial Institution |
0.27 Billion |
3.25 Billion |
31.8% |
|
Public Sector |
0.12 Billion |
1.55 Billion |
32.9% |
|
Total |
2.65 Billion |
28.25 Billion |
26.7% |
Which Buyer Size Segment Is Growing Fastest in the AI Carbon Accounting Market?
Enterprise buyers held the largest share at approximately 44.2% of 2025 revenue, driven by regulatory obligations under SB 253 and CSRD that apply primarily to large filers. Public Sector is the fastest-growing segment at 32.9% CAGR, as government agencies adopt AI carbon accounting tools to meet their own procurement-linked sustainability disclosure commitments and set an example for regulated industries.
Segment Sizing: By End-User Industry
|
Segment |
2025 (USD) |
2035 (USD) |
CAGR% (2026-2035) |
|
Energy And Utilities |
0.42 Billion |
4.10 Billion |
28.8% |
|
Manufacturing |
0.49 Billion |
4.94 Billion |
29.3% |
|
Retail And Consumer Packaged Goods |
0.34 Billion |
3.81 Billion |
30.8% |
|
Food And Beverage |
0.21 Billion |
2.12 Billion |
29.3% |
|
Technology And Telecom |
0.32 Billion |
3.81 Billion |
31.7% |
|
Financial Services |
0.34 Billion |
4.10 Billion |
31.9% |
|
Transport And Logistics |
0.21 Billion |
2.40 Billion |
31.1% |
|
Construction And Real Estate |
0.13 Billion |
1.27 Billion |
28.8% |
|
Healthcare And Pharma |
0.11 Billion |
1.13 Billion |
29.5% |
|
Others |
0.08 Billion |
0.57 Billion |
24.4% |
|
Total |
2.65 Billion |
28.25 Billion |
26.7% |
Which End-User Industry Dominates Adoption in the AI Carbon Accounting Market?
Manufacturing held the largest end-user share at approximately 18.5% in 2025, reflecting complex multi-facility Scope 1 and Scope 2 inventories and Carbon Border Adjustment Mechanism exposure. Financial Services is the fastest-growing segment at 31.9% CAGR, as banks and insurers build financed-emissions capabilities to meet PCAF-aligned disclosure expectations from regulators and institutional investors across multiple jurisdictions simultaneously.
Growth Opportunities
Our findings suggest three forward-looking whitespace opportunities are emerging as the market matures beyond first-generation compliance tooling.
Can Product-Level Carbon APIs Unlock Retail Partnerships?
Retailers increasingly require supplier-level product carbon footprints to satisfy scorecards and CBAM obligations. Vendors offering lightweight, API-first product footprint databases can capture mid-market manufacturers seeking retailer compliance without adopting a full enterprise platform, positioning Carbon Data API providers as the primary beneficiary segment.
Does Financed Emissions Analytics Represent a Banking Whitespace in the AI Carbon Accounting Market?
Regional and mid-sized banks lack the portfolio analytics that top-tier institutions already deploy. Software offering pre-built PCAF asset-class templates can convert this underserved financial institution segment into recurring subscription revenue as state-level financial risk disclosure laws expand beyond California.
Can Embedded ERP Modules Displace Standalone Tools in Mid-Market?
Mid-market companies running SAP or Microsoft ecosystems prefer native modules over separate logins. Embedded Module vendors that deepen ERP-native workflows stand to capture Mid-Market buyers migrating away from standalone platforms as procurement consolidates around existing enterprise software vendors.
Regional Outlook
|
Region |
2025 (USD) |
2035 (USD) |
CAGR% (2026-2035) |
Key Driver |
|
North America |
0.95 Billion |
9.47 Billion |
29.1% |
California SB 253/SB 261 |
|
Europe |
0.82 Billion |
8.47 Billion |
29.6% |
EU CSRD and ESRS |
|
Asia-Pacific |
0.53 Billion |
6.92 Billion |
33.0% |
ISSB-aligned national rollout |
|
Middle East & Africa |
0.19 Billion |
2.12 Billion |
30.7% |
Sovereign net-zero programs |
|
Latin America |
0.16 Billion |
1.27 Billion |
25.9% |
Export compliance pressure |
|
Total |
2.65 Billion |
28.25 Billion |
26.7% |
- |
North America
North America remains the most mature AI Carbon Accounting Market, anchored by California's SB 253 and SB 261 and a fragmented federal landscape following the SEC's proposed rescission of its 2024 climate rule. We observed that enterprises are prioritizing state-compliant platforms over federally scoped tools. Vendor density is highest here, and strategic outlook favors continued platform consolidation among incumbents serving multi-state reporting entities.
U.S.
Based on our engagements, the U.S. generated approximately USD 0.82 Billion in 2025 and is projected to reach USD 7.56 Billion by 2035 at a 28.0% CAGR. Demand concentrates among SB 253-covered companies preparing for the August 10, 2026, deadline. Adoption is strongest among technology, retail, and financial services firms, with competitive intensity elevated by both venture-backed specialists and embedded incumbents.
Canada
Through our analysis, Canada is estimated at USD 0.13 Billion in 2025, growing to USD 1.16 Billion by 2035 at a 27.5% CAGR. Demand is shaped by voluntary ISSB-aligned disclosure guidance and cross-border reporting obligations for companies serving California and EU customers, with technology penetration led by mid-market ERP-embedded adoption.
Europe
Europe's growth is driven by the phased rollout of the Corporate Sustainability Reporting Directive and European Sustainability Reporting Standards, which apply double-materiality requirements across an expanding company population. We found that regulatory clarity here exceeds North America, supporting faster enterprise-tier adoption and a strong services attachment rate for assurance-ready reporting.
UK
From our assessment, the UK AI Carbon Accounting Market reached approximately USD 0.20 Billion in 2025 and is forecast to reach USD 1.98 Billion by 2035 at a 29.0% CAGR. Streamlined Energy and Carbon Reporting obligations and UK-specific ISSB adoption plans sustain steady enterprise demand, with strong competitive intensity among both domestic and U.S.-headquartered platform vendors.
Germany
According to our evaluation, Germany stood at approximately USD 0.19 Billion in 2025, projected to reach USD 2.01 Billion by 2035 at a 30.0% CAGR. Manufacturing-heavy Scope 3 supply chains and CSRD applicability to a large base of mid-cap companies drive demand for embedded modules integrated with SAP, reflecting the country's ERP-centric enterprise software landscape.
France
Based on our engagements, France reached approximately USD 0.14 Billion in 2025 and is projected to reach USD 1.34 Billion by 2035 at a 28.5% CAGR. Domestic vendors including Sweep maintain strong home-market share, supported by CSRD compliance demand and government-backed decarbonization initiatives across industrial and retail sectors.
Asia-Pacific
Asia-Pacific is the fastest-growing region in the AI Carbon Accounting Market, supported by ISSB-aligned disclosure adoption across multiple national regulators and export-driven Carbon Border Adjustment Mechanism exposure. Our analysis shows that technology adoption is accelerating unevenly, with China, Japan, and South Korea leading enterprise deployment while emerging markets favor lower-cost, API-based tools.
China
Through our analysis, China reached approximately USD 0.15 Billion in 2025 and is projected to reach USD 2.02 Billion by 2035 at a 33.5% CAGR. Export-oriented manufacturers face mounting CBAM-related disclosure pressure from EU trading partners, driving demand for product-level carbon data alongside domestic dual-carbon policy compliance requirements.
India
From our assessment, India is estimated at approximately USD 0.09 Billion in 2025, forecast to reach USD 1.53 Billion by 2035 at a 37.0% CAGR, the fastest of any country covered. Business Responsibility and Sustainability Reporting mandates and IT-sector sustainability commitments from global technology buyers are accelerating enterprise and mid-market adoption alike.
Japan
According to our evaluation, Japan reached approximately USD 0.10 Billion in 2025 and is projected to reach USD 1.06 Billion by 2035 at a 30.0% CAGR in the AI Carbon Accounting Market. Financial Services Agency disclosure expectations aligned with ISSB standards, combined with keiretsu-style supply chain reporting norms, sustain steady enterprise-tier demand across manufacturing and financial institution buyers.
South Korea
Based on our engagements, South Korea reached approximately USD 0.06 Billion in 2025, projected to reach USD 0.73 Billion by 2035 at a 32.0% CAGR. K-ESG guideline adoption and export exposure to EU and U.S. customers drive demand concentrated among large industrial conglomerates and their extended supplier networks.
Australia
Through our analysis, Australia reached approximately USD 0.05 Billion in 2025 and is projected to reach USD 0.57 Billion by 2035 at a 31.0% CAGR. Mandatory climate disclosure requirements under the Australian Sustainability Reporting Standards are expanding the covered-entity population, supporting enterprise and mid-market platform adoption across mining and financial services sectors.
Middle East & Africa
Middle East & Africa growth is anchored by sovereign net-zero programs in the Gulf states and expanding voluntary disclosure among listed companies. Our assessment indicates that technology penetration remains lower than in other regions, but the strategic outlook favors accelerating adoption as national exchanges introduce ESG listing requirements.
UAE
From our assessment, the UAE AI Carbon Accounting Market reached approximately USD 0.05 Billion in 2025 and is projected to reach USD 0.67 Billion by 2035 at a 33.5% CAGR. Federal net-zero 2050 commitments and Dubai Financial Market disclosure guidance are driving early enterprise adoption among energy and real estate sector participants.
Saudi Arabia
Based on our engagements, Saudi Arabia reached approximately USD 0.045 Billion in 2025, forecast to reach USD 0.63 Billion by 2035 at a 34.0% CAGR. Vision 2030 sustainability commitments and Tadawul exchange ESG disclosure guidance are driving adoption concentrated among energy and construction sector enterprises.
South Africa
Through our analysis, the South Africa reached approximately USD 0.025 Billion in 2025 and is projected to reach USD 0.27 Billion by 2035 at a 30.0% CAGR. Johannesburg Stock Exchange sustainability disclosure guidance and carbon tax compliance requirements sustain steady demand among mining, energy, and financial services companies.
Latin America
Latin America's growth reflects export compliance pressure and gradually maturing national disclosure frameworks. We observed that technology adoption favors mid-market and API-based tools over full enterprise platforms, given the lower average company size across the region's covered-entity population relative to North America and Europe.
Brazil
According to our evaluation, the Brazil AI Carbon Accounting Market reached approximately USD 0.08 Billion in 2025 and is projected to reach USD 0.74 Billion by 2035 at a 28.0% CAGR. B3 exchange sustainability disclosure guidance and agribusiness export requirements to EU markets are the primary drivers of enterprise and mid-market platform adoption.
Argentina
Based on our engagements, the Argentina AI Carbon Accounting Market reached approximately USD 0.025 Billion in 2025, forecast to reach USD 0.20 Billion by 2035 at a 26.0% CAGR. Adoption remains concentrated among export-oriented agribusiness and energy companies responding to buyer-driven emissions disclosure requests from European and North American trading partners.
Regulatory Framework Impacting the AI Carbon Accounting Market
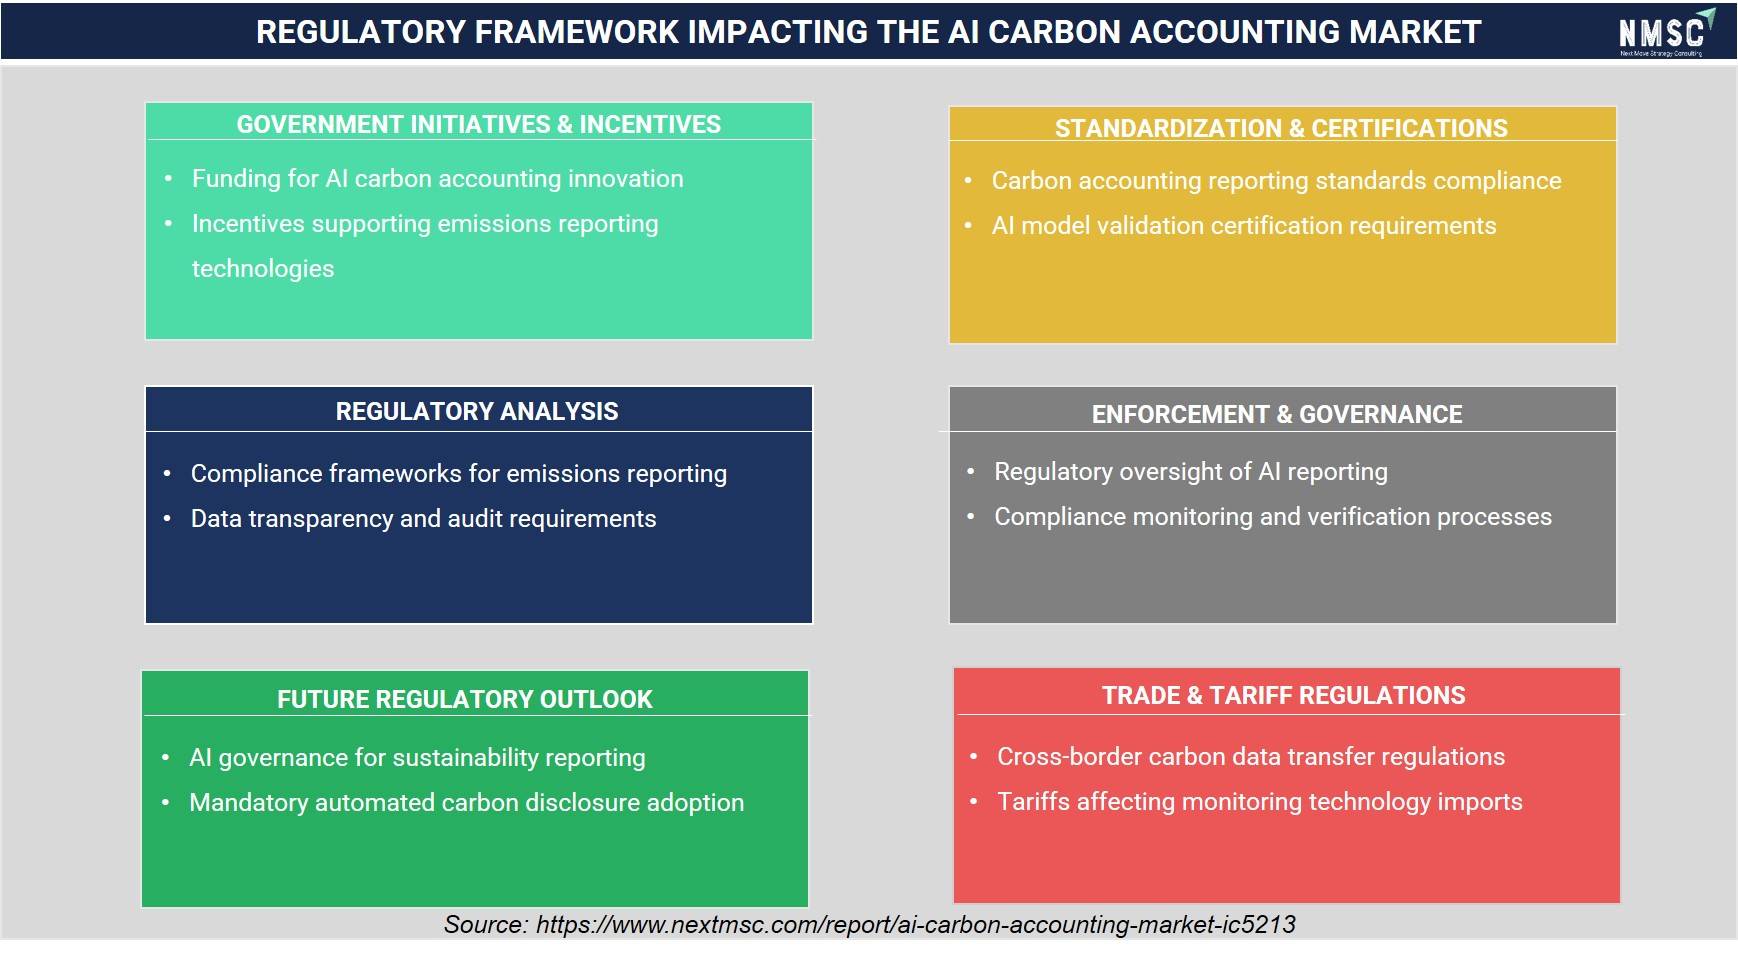
The above infographic presents a regulatory framework impacting the AI Carbon Accounting Market, where government funding and compliance frameworks are supporting emissions reporting and data transparency. Standardization and enforcement mechanisms strengthen credibility, while future regulations are moving toward automated disclosure and AI governance. Looking ahead, we noticed that cross-border data rules and tariffs continue to influence adoption and costs across the market.
Competitive Landscape
We observed that the competitive landscape spans venture-backed specialists, embedded enterprise-software incumbents, and industrial technology providers, each pursuing distinct differentiation strategies.
|
Category |
Details |
|
Market Structure |
Fragmented, with venture-backed specialists competing alongside embedded modules from enterprise software incumbents |
|
Innovation Focus |
AI-driven data ingestion, Scope 3 supplier engagement, and product-level carbon footprinting |
|
M&A Activity |
Active consolidation, including partnership-driven client migration between specialist vendors |
How Do Companies Compete in the AI Carbon Accounting Market?
Vendors compete primarily on data automation depth, framework coverage, and integration breadth. Our analysis shows that platforms offering the widest range of pre-built regulatory report templates, spanning CSRD, ISSB, and California requirements, win multi-jurisdiction enterprise accounts, while narrower tools compete on price and ease of use within mid-market and SME segments.
Which Competitive Archetypes Dominate the Industry?
Three archetypes dominate the AI Carbon Accounting Market: venture-backed specialists such as Watershed and Persefoni that lead on AI-native measurement depth, embedded incumbents such as Salesforce, SAP, and Microsoft that leverage existing enterprise footprints, and data-and-services providers such as Sphera and ENGIE Impact that combine software with advisory and assurance support for complex, regulated buyers.
What Innovation and Differentiation Strategies Are Emerging in the AI Carbon Accounting Market?
Vendors are differentiating through agentic AI features that automate anomaly detection and utility-bill ingestion, and through expanding emission-factor libraries covering hundreds of thousands of activity types. We found that differentiation is shifting from raw calculation accuracy, now broadly comparable across leading platforms, toward workflow automation and audit-readiness for third-party assurance.
How Is M&A Activity Reshaping the Competitive Landscape?
M&A and partnership activity accelerated through 2025 and 2026 as smaller vendors sought scale and larger platforms absorbed their client bases. Diligent's October 2025 decision to transition its carbon accounting clients to Persefoni, taking an equity position in the process, illustrates how governance-software incumbents are choosing partnership over continued independent product development in this Industry.
Key Market Players
Our assessment identifies the following 20 companies as the leading providers of AI carbon accounting software, data, and advisory services globally.
-
Watershed
-
Microsoft
-
IBM
-
SAP
-
Salesforce
-
Workiva
-
Schneider Electric
-
Sphera
-
ENGIE Impact
-
Persefoni
-
Normative
-
Sweep
-
Greenly
-
Plan A
-
Terrascope
-
Nasdaq
-
CarbonChain
-
Altruistiq
-
Climatiq
-
Coolset
Latest Developments
We observed the following verified developments as directly relevant regulatory and competitive milestones shaping the AI Carbon Accounting Market.
|
Date |
Event |
|
September 2025 |
Watershed launched AI-accelerated Product Footprints, combining artificial intelligence with climate science to automate product carbon footprint calculations and Scope 3 emissions measurement. The capability significantly reduces manual lifecycle modeling while improving the speed and scalability of enterprise carbon accounting. |
|
May 2025 |
SAP introduced new AI capabilities across its sustainability portfolio, including AI-assisted emission-factor mapping within SAP Sustainability Footprint Management. The enhancement automatically maps products to lifecycle assessment databases, improving carbon footprint calculations while reducing manual effort in enterprise carbon accounting. |
Expert Insights
 “As agentic AI rapidly transforms the world of work, its introduction into carbon accounting represents a critical shift. By enabling faster, deeper analysis of emissions data, our new agent will help surface insights that may not have been visible before.”
Kim Stroh, CTO & Co-Founder of Persefoni
Statement made during the launch of Persefoni's Agentic AI solution for carbon accounting.
Market Interpretation
The statement highlights the growing adoption of agentic AI to automate and enhance carbon accounting processes. AI-powered emissions analysis enables organizations to process complex sustainability data more efficiently, improve the accuracy of carbon reporting, uncover hidden emissions patterns, and strengthen regulatory compliance. As enterprises seek scalable, data-driven decarbonization strategies, AI-enabled carbon accounting platforms are expected to play an increasingly important role in sustainability management and corporate climate reporting.
Investment Opportunities
Where Is Capital Inflow Concentrated in the AI Carbon Accounting Market?
Capital inflow remains concentrated in Standalone Platform and Carbon Data API vendors, with Persefoni's 2025 Series C extension funding illustrating continued investor appetite despite broader venture-funding caution across software categories. Our analysis shows that later-stage rounds increasingly favor vendors with proven enterprise and financial-institution reference customers over early-stage measurement-only tools.
What Infrastructure Investment Is Required for Scale?
Scaling AI carbon accounting requires sustained investment in emission-factor databases, third-party assurance partnerships, and API infrastructure connecting utility, ERP, and supplier data sources. We observed that vendors building proprietary, continuously updated factor libraries are better positioned to defend margins as calculation accuracy commoditizes across the competitive landscape.
How Do ESG Considerations Shape Investment Decisions in the AI Carbon Accounting Market?
Investors increasingly weigh a vendor's own environmental, social, and governance practices alongside product capability, given customer expectations that carbon accounting providers model the standards they help enforce. Our assessment indicates that vendors publishing third-party-assured emissions disclosures of their own gain credibility advantages when competing for financial institution and public sector contracts.
Key Benefits for Stakeholders
How Does This Report Benefit Enterprise and Industry Leaders?
Enterprise and industry leaders gain a consolidated view of segmentation, regional demand, and competitive positioning to inform platform selection and budget planning ahead of SB 253 and CSRD compliance deadlines. Our analysis and forecasts help leaders benchmark vendor capability against dominant and fastest-growing sub-segments identified throughout this report.
How Does This Report Benefit Investors and Financial Analysts in the AI Carbon Accounting Market?
Investors and financial analysts gain quantified market-sizing, segment-level CAGR data, and competitive landscape insight to evaluate capital allocation across standalone platforms, embedded modules, and data API providers. Our strategic insights help analysts assess which vendor archetypes are best positioned for the whitespace opportunities identified in this report.
How Does This Report Benefit Technology Vendors and Product Teams?
Technology vendors and product teams gain a structured view of emerging trends, growth drivers, and regional regulatory divergence to inform product roadmaps and go-to-market prioritization. Our segmentation analysis and growth opportunity assessment help product teams identify underserved buyer segments, including Public Sector and financial institution buyers, ahead of competitors.
Key Market Segments
By Software Subscriptions
-
Standalone Platform
-
Corporate Carbon
-
Product Carbon
-
Supply Chain Carbon
-
Financed Emissions
-
Other Standalone Platform
-
-
Embedded Module
-
ERP Embedded
-
CRM Embedded
-
ESG Suite Embedded
-
Other Embedded Module
-
-
Carbon Data API
-
Emission Factors API
-
Calculation Engine
-
Product Footprint Database
-
Other Data API
-
-
Services
-
Implementation And Integration
-
Managed Carbon Accounting
-
Advisory And Assurance
-
Other Services
-
By Buyer Size
-
Enterprise
-
Mid-Market
-
SMEs
-
Financial Institution
-
Public Sector
By Channel
-
Direct
-
Partner
-
Marketplace
-
OEM
By End-User Industry
-
Energy And Utilities
-
Manufacturing
-
Retail And Consumer Packaged Goods
-
Food And Beverage
-
Technology And Telecom
-
Financial Services
-
Transport And Logistics
-
Construction And Real Estate
-
Healthcare And Pharma
-
Others
By Region
-
North America: U.S., Canada, Mexico
-
Europe: UK, Germany, France, Italy, Spain, Sweden, Denmark, Finland, Netherlands, Rest of Europe
-
Asia-Pacific: China, India, Japan, South Korea, Taiwan, Indonesia, Vietnam, Australia, Philippines, Malaysia, Rest of APAC
-
Middle East & Africa: Saudi Arabia, UAE, Egypt, Israel, Turkey, Nigeria, South Africa, Rest of MEA
-
Latin America: Brazil, Argentina, Chile, Colombia, Rest of LATAM
Conclusion & Recommendations
What Is the Long-Term Outlook of the AI Carbon Accounting Market?
The long-term outlook remains strongly positive, with the market forecast to expand from USD 3.36 Billion in 2026 to USD 28.25 Billion by 2035 at a 26.7% CAGR. Our analysis shows that AI-native automation and expanding global disclosure mandates will sustain double-digit growth well beyond the current decade, even amid U.S. federal regulatory uncertainty.
What Strategic Positioning Should Vendors Pursue?
Vendors should prioritize deep integration with ERP and CRM ecosystems while maintaining standalone platform depth for enterprises with complex, multi-framework reporting needs. We recommend that mid-tier vendors pursue partnership or acquisition rather than standalone scale-up, following the pattern established by the Diligent-Persefoni transaction.
How Attractive Is the AI Carbon Accounting Market for Investment?
Investment attractiveness remains high given the absolute dollar opportunity of USD 24.89 Billion between 2026 and 2035 and consistently above-market CAGR across every segmentation axis. Our assessment indicates that Carbon Data API and Public Sector sub-segments offer the strongest risk-adjusted growth profiles for new capital deployment.
What Are the Key Market Shifts and Risks?
The principal risk is continued U.S. federal regulatory fragmentation following the SEC's proposed rescission of its climate disclosure rule, which could slow enterprise procurement outside California and the EU. Our findings suggest that vendors diversifying revenue across multiple regulatory jurisdictions are best insulated against this single-market risk.
What Are the Primary Growth Pathways in the AI Carbon Accounting Market?
Primary growth pathways include expanding product-level carbon footprinting for CBAM-exposed manufacturers, deepening financed-emissions analytics for financial institutions, and broadening embedded-module partnerships with ERP incumbents. We observed that vendors pursuing at least two of these three pathways simultaneously are best positioned to sustain share through 2035.
About the Author
 Mayurima Roy
— Mayurima Roy is Research Analyst at Next Move Strategy Consulting, where she has spent 4 years working across the firm's full industry coverage rather than a single fixed vertical. Her work centers on structured research, ongoing trend tracking, competitive assessment, and insight-led content development, translating complex market data into clear, decision-ready narratives that support informed client decision-making across diverse global industries, market sectors, and world regions every day.
Mayurima Roy
— Mayurima Roy is Research Analyst at Next Move Strategy Consulting, where she has spent 4 years working across the firm's full industry coverage rather than a single fixed vertical. Her work centers on structured research, ongoing trend tracking, competitive assessment, and insight-led content development, translating complex market data into clear, decision-ready narratives that support informed client decision-making across diverse global industries, market sectors, and world regions every day.
About the Reviewer
 Supradip Baul
— Supradip Baul is an accomplished business consultant and strategist with over a decade of rich experience in market intelligence, strategy, technology, and business transformation. His work has included rigorous qualitative and quantitative analysis across multiple industries, helping clients shape investment decisions and long-term roadmaps. Earlier in his career, he was associated with Gartner, where he contributed to industry-leading reports and market share analyses. He has worked with leading global companies and holds an MBA with a dual specialization in Marketing and Finance.
Supradip Baul
— Supradip Baul is an accomplished business consultant and strategist with over a decade of rich experience in market intelligence, strategy, technology, and business transformation. His work has included rigorous qualitative and quantitative analysis across multiple industries, helping clients shape investment decisions and long-term roadmaps. Earlier in his career, he was associated with Gartner, where he contributed to industry-leading reports and market share analyses. He has worked with leading global companies and holds an MBA with a dual specialization in Marketing and Finance.
At Next Move Strategy Consulting, we understand that insightful market research is the cornerstone of successful business decisions. That's why we employ a robust and multifaceted approach, combining various methodologies to deliver the most accurate and actionable data for our clients.

Research Landscape
We navigate the world of research with two primary approaches:
Qualitative Approach
Our qualitative research methodologies involve immersive techniques such as in-depth interviews, focus groups, and observational studies. By engaging directly with individuals and stakeholders, we uncover valuable insights that quantitative data alone may overlook.

Quantitative Research
In tandem with qualitative methodologies, NMSC leverages the power of Quantitative Research to provide a robust foundation of numerical insights. Through systematic data collection and analysis, we quantify patterns, preferences, and market trends, offering a comprehensive view of the business landscape.
Our quantitative research approach employs diverse tools, including surveys, experiments, and statistical modelling. These methodologies enable us to gather data from a large and representative sample, ensuring the statistical significance of our findings. By employing structured questionnaires and standardized data collection methods, we guarantee the reliability and validity of the information we present to our clients.
Quantitative research is particularly effective in measuring the prevalence of trends, assessing market size, and gauging the impact of various factors on consumer behavior. The numerical precision attained through this approach equips our clients with actionable insights, facilitating data-driven decision-making and strategy formulation.


Our Specialized Toolbox for Industry-Specific Market Research
We deploy a specialized arsenal of techniques tailored to meet your unique requirements. Here's a glimpse into our comprehensive toolbox:

Information Procurement
The stage entails acquiring market data or relevant information through various sources and methodologies.


Market Research Approach
We utilize both top-down and bottom-up approaches in market research analysis to achieve a comprehensive understanding of the market dynamics, leveraging the broad perspective of industry trends and macroeconomic factors alongside detailed insights from specific segments and individual companies.

Porters Five Forces Analysis
We conduct Porter's Five Forces analysis to evaluate the competitive landscape of an industry, providing us with insights into factors that affect profitability and strategic positioning.

SWOT Analysis

Forecasting
We utilize a forecasting model to predict future consumption by considering parameters like population, economics, regulations, market competition, drivers, constraints, technology, and pricing. We also employ statistical techniques such as multilinear regression, exponential smoothing, moving average, ARIMA, and Monte Carlo simulations for accurate predictions. In econometric forecasting, we analyzed short-term and long-term event impacts, attributing values based on regulatory frameworks, economic factors, and market events.





 Speak to Our Analyst