Co-Packaged Optics Market Global Industry Analysis and Forecast (2026–2035)

Rising AI cluster power demand and 102.4 Tbps switch launches lift revenue from USD 180.00 Million in 2025 to USD 6,240.00 Million by 2035, a 31.8% CAGR over 2026–2035, with North America leading adoption.

Download Free Sample PDF
Base Year (2025)
$180.0 Million
Forecast (2035)
$6,240.0 Million
CAGR (2026-2035)
31.8%
Top Region
North America

What Is the Co-Packaged Optics Market Size?

The Co-Packaged Optics Market was valued at USD 180.00 Million in 2025 and is estimated at USD 520.00 Million in 2026, rising to USD 6,240.00 Million by 2035 at a 31.8% CAGR from 2026 to 2035. North America leads with roughly 56.7% share, while optical engines dominate with approximately 51.9% share.
Our findings suggest that revenue is concentrated in AI switching, optical engines and North American deployments.

Co-Packaged Optics Market Global Industry Analysis and Forecast (2026–2035) Revenue Forecast
Values in USD Million

2025 $180.0 Million
2025
2026 $520.0 Million
2026
2027 $685.4 Million
2027
2028 $903.3 Million
2028
2029 $1,190.6 Million
2029
2030 $1,569.2 Million
2030
2031 $2,068.1 Million
2031
2032 $2,725.8 Million
2032
2033 $3,592.6 Million
2033
2034 $4,735.1 Million
2034
2035 $6,240.0 Million
2035

Key Takeaways

By Component: Optical engines held the largest share, expanding from USD 95.00 Million in 2025 to USD 3,050.00 Million by 2035; Advanced packaging and integration is the fastest growing at 32.9% CAGR from 2026–2035.

By Application: AI scale out switching held the largest share, expanding from USD 165.00 Million in 2025 to USD 3,740.00 Million by 2035; AI scale up interconnect is the fastest growing at 50.7% CAGR from 2026–2035.

By Data Rate per Lane: 200G per lane held the largest share, expanding from USD 62.00 Million in 2025 to USD 2,800.00 Million by 2035; 400G per lane is the fastest growing at 65.2% CAGR from 2026–2035.

Dominant Region: North America held 56.7% of 2026 revenue, growing from USD 100.00 Million in 2025 to USD 2,860.00 Million by 2035 at 28.7% CAGR.

Fastest-Growing Region: Asia-Pacific expands at 35.2% CAGR from 2026–2035, reaching USD 3,020.00 Million by 2035.

Dominant Country: U.S. revenue of USD 275.00 Million in 2026 heads toward USD 2,640.00 Million by 2035, a 28.6% CAGR.

Fastest-Growing Country: South Korea advances at 37.1% CAGR from 2026–2035, rising from USD 21.00 Million in 2026 to USD 360.00 Million by 2035.

The market offers an absolute opportunity of USD 5,720.00 Million between 2026 and 2035 for suppliers that secure laser and packaging capacity.

According to NMSC analysis, accelerator optical I/O rises from 10.6% of 2026 revenue to 35.3% by 2035, shifting buyers beyond switch vendors.

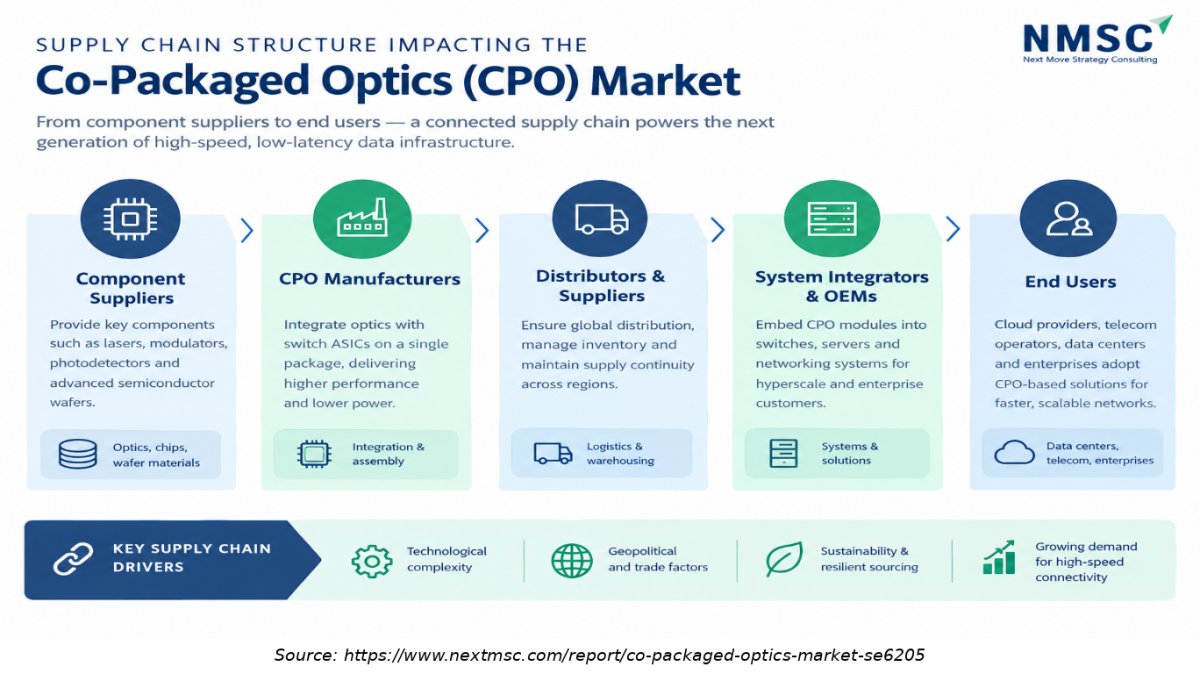
Supply Chain Structure Impacting the Co-Packaged Optics (CPO) Market

Supply Chain Structure Impacting the Co-Packaged Optics (CPO) Market
The Co-Packaged Optics Market supply chain connects component suppliers, CPO manufacturers, distributors, system integrators, and end users. Efficient coordination across these stages supports the integration of optical components with switching chips, helping enable high-speed data transmission, lower power consumption, and scalable data center infrastructure.
What Does the Co-Packaged Optics Market Encompass?
The Co-Packaged Optics Market covers optical engines, external laser sources and the advanced packaging and integration that place photonics beside switch ASICs and accelerators inside a single package. The scope excludes pluggable transceivers, active optical cables and system level switch chassis value. Revenue is counted separately for optical engines, external laser sources, and advanced packaging and integration only where their values can be independently identified. Bundled or overlapping component values must be excluded to avoid double counting
Technology adoption follows switch generations. Broadcom introduced its third-generation Tomahawk 6 – Davisson platform on October 8, 2025, and NVIDIA announced Spectrum-X Photonics and Quantum-X Photonics on March 18, 2025. Energy policy shapes demand indirectly, because the International Energy Agency projects data centre electricity use near 945 TWh by 2030, which raises the value of every watt saved in the network. We found that this power logic, rather than regulation, sets the pace of qualification.

Market Drivers & Dynamics

Interactive Dataset
AI data centre power constraints driver +7.5% Global, led by North America 2026–2032
Switch bandwidth moving to 102.4 Tbps driver +6.0% North America, Asia-Pacific 2026–2030
Hyperscale qualification and reliability milestones driver +4.5% North America 2026–2029
Strategic capacity commitments in lasers driver +3.0% North America, Asia-Pacific 2026–2030
Advanced packaging and optical engine yield limits restraint −5.5% Asia-Pacific 2026–2029
Serviceability and continued pluggable optics improvement restraint −4.0% Global 2026–2031
Ecosystem fragmentation across vendor architectures restraint −2.5% Global 2026–2030
Source: Next Move Strategy Consulting

Growth Drivers

What is the primary growth driver?

Power availability is the primary driver. The International Energy Agency projects that electricity demand from data centres worldwide will more than double to around 945 TWh by 2030, with AI optimised facilities more than quadrupling their demand. As AI data centres deploy higher-bandwidth networks, power consumption per bit becomes an important design consideration. CPO adoption depends on the power, cost, reliability and serviceability trade-offs of each network architecture. NVIDIA reports 3.5 times better power efficiency for its photonics switches than traditional networking, which supports this driver of the Co-Packaged Optics Market.

How is switch bandwidth growth driving the Co-Packaged Optics market growth?

Switch capacity is moving from 51.2 Tbps to 102.4 Tbps and beyond. Broadcom describes Davisson as the first 102.4 Tbps Ethernet switch with co packaged optics, using 16 optical engines of 6.4 Tbps each, while NVIDIA lists Spectrum-X Photonics configurations up to 400 Tbps. We observed that each step in capacity widens the cost and power gap against pluggable modules, which pulls datacenternetworking buyers toward integrated optics at the largest sites.

Growth Inhibitors

What is restraining the Co-Packaged Optics Market?

Yield and packaging capacity restrain near term growth. We estimate that engine yield and advanced packaging limits remove 5.5 percentage points from the CAGR through 2029 (industry derived estimate). Operators also value serviceability, and fixed optics change how failed links are replaced. Pluggable optics keep improving, which extends their useful life at moderate port counts. Together these factors explain why revenue stays below USD 1,000.00 Million until about 2029.

What Are the Growth Opportunities?

Where Does Accelerator Optical I/O Create New Revenue?

Accelerator optical I/O opens a buyer group beyond switch vendors. Custom accelerator designers can place engines beside compute dies and extend rack bandwidth without copper limits. The AI scale up interconnect segment grows from USD 55.00 Million in 2026 to USD 2,200.00 Million by 2035, and optical engine suppliers capture most of that value because every package requires engines.

How Can Laser and Fiber Attach Suppliers Capture Value?

Laser suppliers with qualified indium phosphide capacity hold the strongest position, because each package needs continuous wave light from an external source. Lumentum and Coherent both signed multiyear NVIDIA agreements in March 2026. The external laser sources segment reaches USD 1,640.00 Million by 2035, and suppliers that add fiber attach assemblies widen their share of each switch bill of materials.

Which Regions Offer Capacity Led Opportunities?

North America and Asia-Pacific offer the clearest capacity led openings. Lumentum plans a new fabrication facility and Coherent plans to expand its U.S. manufacturing footprint under the NVIDIA agreements, while TSMC anchors engine integration in Taiwan. Asia-Pacific grows at 35.2% CAGR, the fastest regional rate, and local assembly partners benefit from proximity to foundry packaging lines.

Segmentation Analysis

2025 (USD Million)
2035 (USD Million)
Optical engines 2025: $95.0 Million | 2035: $3,050.0 Million
Optical engi
External laser sources 2025: $45.0 Million | 2035: $1,640.0 Million
External las
Advanced packaging and integration 2025: $40.0 Million | 2035: $1,550.0 Million
Advanced pac
Optical engines $95.0 Million $3,050.0 Million 30.9%
External laser sources $45.0 Million $1,640.0 Million 32.5%
Advanced packaging and integration $40.0 Million $1,550.0 Million 32.9%

Segment Sizing: By Component

2025 (USD Million)
2035 (USD Million)
AI scale out
AI scale up
General data
Segment Item 2025 (USD Million) 2035 (USD Million) CAGR
AI scale out switching $10.0 USD Million $40.0 USD Million 25.0%
AI scale up interconnect $17.1 USD Million $51.1 USD Million 11.0%
General data center switching $24.2 USD Million $62.2 USD Million 25.0%

Segment-wise data is locked

Unlock complete segment-wise numbers for By Application.

Unlock Full Data
2025 (USD Million)
2035 (USD Million)
100G per lan
200G per lan
400G per lan
Segment Item 2025 (USD Million) 2035 (USD Million) CAGR
100G per lane $10.0 USD Million $40.0 USD Million 27.0%
200G per lane $17.1 USD Million $51.1 USD Million 9.0%
400G per lane $24.2 USD Million $62.2 USD Million 19.0%

Segment-wise data is locked

Unlock complete segment-wise numbers for By Data Rate per Lane.

Unlock Full Data
2025 (USD Million)
2035 (USD Million)
North Americ
Canada
Mexico
Europe: UK
Germany
Segment Item 2025 (USD Million) 2035 (USD Million) CAGR
North America: U.S. $10.0 USD Million $40.0 USD Million 14.0%
Canada $17.1 USD Million $51.1 USD Million 24.0%
Mexico $24.2 USD Million $62.2 USD Million 22.0%
Europe: UK $31.3 USD Million $73.3 USD Million 12.0%
Germany $38.4 USD Million $84.4 USD Million 27.0%

Segment-wise data is locked

Unlock complete segment-wise numbers for By Region.

Unlock Full Data

Growth Opportunities

We observed three opportunity pools where capacity, qualification and demand align through 2035.

Where Does Accelerator Optical I/O Create New Revenue?

Accelerator optical I/O opens a buyer group beyond switch vendors. Custom accelerator designers can place engines beside compute dies and extend rack bandwidth without copper limits. The AI scale up interconnect segment grows from USD 55.00 Million in 2026 to USD 2,200.00 Million by 2035, and optical engine suppliers capture most of that value because every package requires engines.

How Can Laser and Fiber Attach Suppliers Capture Value?

Laser suppliers with qualified indium phosphide capacity hold the strongest position, because each package needs continuous wave light from an external source. Lumentum and Coherent both signed multiyear NVIDIA agreements in March 2026. The external laser sources segment reaches USD 1,640.00 Million by 2035, and suppliers that add fiber attach assemblies widen their share of each switch bill of materials.

Which Regions Offer Capacity Led Opportunities?

North America and Asia-Pacific offer the clearest capacity led openings. Lumentum plans a new fabrication facility and Coherent plans to expand its U.S. manufacturing footprint under the NVIDIA agreements, while TSMC anchors engine integration in Taiwan. Asia-Pacific grows at 35.2% CAGR, the fastest regional rate, and local assembly partners benefit from proximity to foundry packaging lines.

Regional Outlook

2025 (USD Million)
2035 (USD Million)
North Americ
Europe
Asia-Pacific
Middle East
Latin Americ
Region 2025 (USD Million) 2035 (USD Million) CAGR (%)
North America $10.0 USD Million $40.0 USD Million 9.0%
Europe $17.1 USD Million $51.1 USD Million 27.0%
Asia-Pacific $24.2 USD Million $62.2 USD Million 25.0%
Middle East & Africa $31.3 USD Million $73.3 USD Million 23.0%
Latin America $38.4 USD Million $84.4 USD Million 12.0%

Regional data is locked

Unlock complete regional numbers for this market.

Unlock Full Data

Competitive Landscape

Our findings suggest that competition centres on who controls silicon photonics design, engine manufacturing and advanced packaging.

Key Market Players

NMSC's analysis indicates that seven companies met our verification standard, listed here in ranked order.

Broadcom Inc. NVIDIA Corporation Taiwan Semiconductor Manufacturing Company Limited Lumentum Holdings Inc. Coherent Corp. Marvell Technology, Inc. Ayar Labs, Inc.

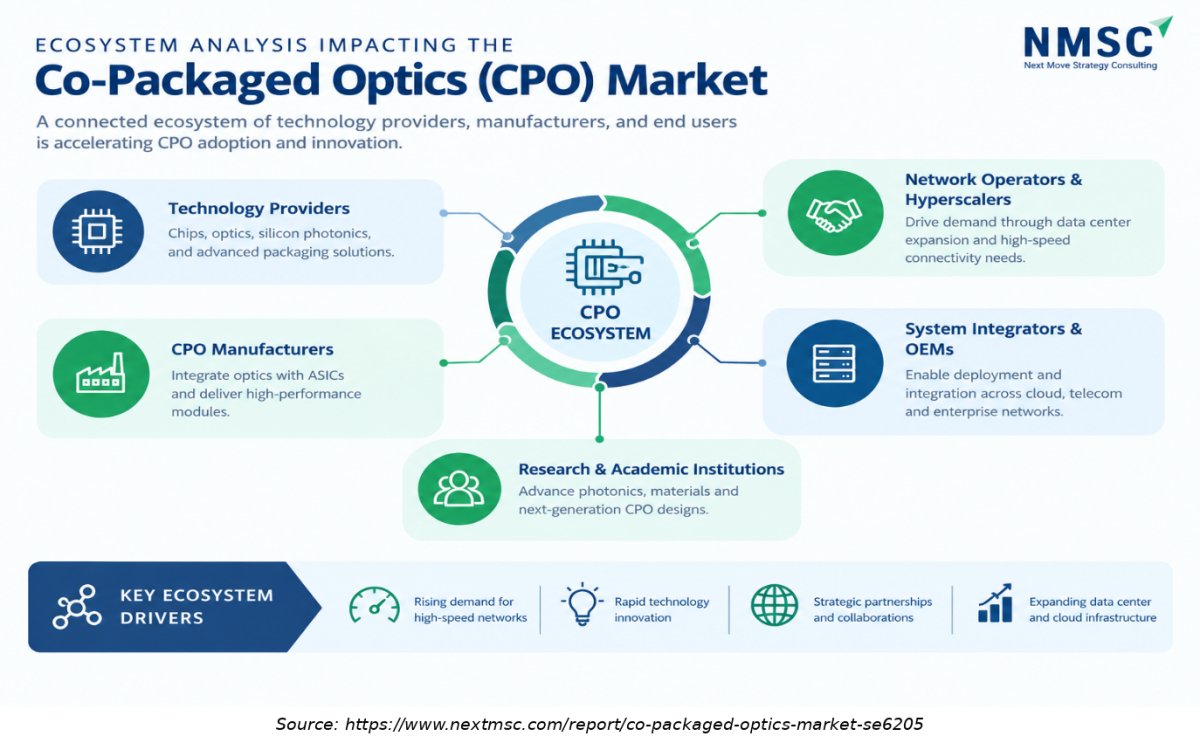
Ecosystem Analysis Impacting the Co-Packaged Optics (CPO) Market

The Co-Packaged Optics (CPO) market ecosystem brings together technology providers, manufacturers, network operators, system integrators, and research institutions. Collaboration among these stakeholders drives technological innovation, supports CPO adoption, and addresses the growing need for high-bandwidth, energy-efficient connectivity in data centers and advanced networking systems.

Latest Developments

We observed that recent announcements cluster around product launches, capacity agreements and acquisitions.

Date Event
March 18, 2025 NVIDIA unveiled Spectrum-X Photonics Ethernet and Quantum-X Photonics InfiniBand switches built on co packaged optics.
February 2026 Marvell completed its acquisition of Celestial AI and its Photonic Fabric optical interconnect technology.
March 2, 2026 NVIDIA announced a multiyear agreement and a USD 2,000.00 Million investment in Lumentum for lasers and optics.
March 2, 2026 NVIDIA announced a multiyear agreement and a USD 2,000.00 Million investment in Coherent for lasers and optical networking.

Expert Insights

Wendell Weeks

Wendell Weeks

Chairman and CEO | Corning Incorporated

"Customers are looking for the opportunity to move away from pluggables and toward co-packaged optics and near-package optics."

Analyst Interpretation

Weeks made this statement during an earnings-call discussion reported by SDxCentral, highlighting interest in optical technologies that can improve latency, power efficiency, reliability, and connection density.

Investment Opportunities

Where Is Capital Flowing in the Co-Packaged Optics Industry?

Capital flows to lasers, engines and packaging. NVIDIA invested USD 2,000.00 Million in each of Lumentum and Coherent in March 2026, and Marvell absorbed Celestial AI to add optical interconnect capability. Based on research conducted by NMSC, we found that investors favour suppliers with funded capacity and customer commitments, because these two features convert a technology lead into predictable revenue across the forecast period.

Which Infrastructure Investments Support Growth?

Infrastructure spending centres on indium phosphide fabrication, silicon photonics wafer lines and advanced packaging. Lumentum plans a new U.S. fabrication facility and Coherent is expanding U.S. manufacturing, while TSMC integrates photonic and electrical dies with its stacking technology. We observed that test and burn in capacity for optical engines is equally scarce, and operators that finance it gain earlier access to qualified supply.

What ESG Considerations Shape Investment Decisions?

ESG screens focus on energy use. The International Energy Agency expects data centre demand near 945 TWh by 2030, and NVIDIA claims 3.5 times better power efficiency for its photonics switches. Lower energy per bit supports operator emissions targets, though lasers and wafer fabs add manufacturing impact. Our assessment indicates that investors will favour suppliers that publish verified power savings and responsible sourcing for indium and other materials.

Key Benefits for Stakeholders

How Does This Report Help Enterprise and Hyperscale Leaders?

Operators gain a segment level view of when optical engines, lasers and packaging become available at volume. The forecast by lane rate helps planners time the move from pluggable modules to integrated optics, and the regional analysis highlights supply risk. We found that early qualification planning protects capacity access, and the report quantifies the cost of delay for sites that face fixed power budgets.

How Does This Report Help Investors and Financial Analysts?

Investors gain a reconciled forecast of USD 180.00 Million in 2025 and USD 6,240.00 Million by 2035, with clear segment and regional splits. The analysis separates revenue pools by component and application, so analysts can map exposure to engines, lasers or packaging. Restraint estimates and capacity commitments provide inputs for scenario models and for judging how quickly each supplier can convert design wins into recognized revenue.

How Does This Report Help Technology Vendors and Product Teams?

Product teams gain a benchmark of lane rate transitions, laser power needs and integration choices. The competitive analysis shows which archetypes dominate and where open architectures remain, particularly in accelerator optical I/O. Our assessment indicates that vendors can use the segment forecasts to prioritise engine density, serviceability and foundry partnerships, and to size capacity ahead of the volume deployments suppliers expect later in the decade.

Key Market Segments Evaluated

By Component

  • Optical engines
  • External laser sources
  • Advanced packaging and integration

By Application

  • AI scale out switching
  • AI scale up interconnect
  • General data center switching

By Data Rate per Lane

  • 100G per lane
  • 200G per lane
  • 400G per lane

By Region

  • North America 
    • U.S.
    • Canada
    • Mexico
  • Europe 
    • UK
    • Germany
    • France
    • Italy
    • Spain
    • Sweden
    • Denmark
    • Finland
    • Netherlands
    • Rest of Europe
  • Asia-Pacific 
    • China
    • India
    • Japan
    • South Korea
    • Taiwan
    • Indonesia
    • Vietnam
    • Australia
    • Philippines
    • Malaysia
    • Rest of APAC
  • Middle East & Africa 
    • Saudi Arabia
    • UAE
    • Egypt
    • Israel
    • Turkey
    • Nigeria
    • South Africa
    • Rest of MEA
  • Latin America 
    • Brazil
    • Argentina
    • Chile
    • Colombia
    • Rest of LATAM

Conclusion & Recommendations

The outlook is one of rapid expansion from a small base. Revenue climbs from USD 520.00 Million in 2026 to USD 6,240.00 Million by 2035, a 31.8% CAGR, as 200G and 400G per lane designs reach volume and accelerator optical I/O matures. Our findings suggest that growth of the Co-Packaged Optics Market is back loaded, because qualification cycles and capacity builds delay the steepest ramp until the second half of the forecast period.
What Strategic Positioning Recommendations Does NMSC Offer?

Suppliers should secure laser, engine and packaging capacity before volume orders arrive, and should tie that capacity to multiyear customer commitments. Switch vendors should publish reliability and serviceability evidence to reduce operator risk. Component makers should pursue engagement with accelerator designers, since open architectures reward early entrants. NMSC's analysis indicates that integrated control of the three layers is the most defensible position.

How Strong Is the Investment Attractiveness of the Co-Packaged Optics Market?

Attractiveness is high but selective. The USD 5,720.00 Million opportunity between 2026 and 2035 favours suppliers with funded capacity, named customers and qualified products. Investors should discount claims without shipment evidence, because the market is still early and revenue depends on a few buyers. We found that laser and packaging segments offer the strongest pricing power, while engine segments offer the largest absolute revenue.

What Are the Market Shifts and Key Risks in the Co-Packaged Optics Industry?

Key shifts include the move from 100G to 200G and 400G lanes and the rise of accelerator optical I/O. Key risks include engine yield, scarce packaging slots, laser supply and the continued improvement of pluggable optics. Our assessment indicates that a delay in hyperscale qualification would push the steepest growth years later, while a supply shortfall would shift share toward vendors with secured capacity.

What Are the Primary Growth Pathways Through 2035?

Three pathways drive growth. Scale out switching adds volume as 102.4 Tbps platforms ship, scale up interconnect adds a new buyer group, and regional capacity in North America and Asia-Pacific shortens lead times. Asia-Pacific grows at 35.2% CAGR and the scale up segment reaches USD 2,200.00 Million by 2035. During our market evaluation, we noticed that these pathways reinforce one another in the Co-Packaged Optics Market.

FAQs

Sources & References

1.

NVIDIA Corporation, Spectrum-X Photonics announcement (March 18, 2025)

investor.nvidia.com
2.

NVIDIA Corporation, Lumentum strategic partnership announcement (March 2, 2026)

investor.nvidia.com
3.

Coherent Corp., NVIDIA strategic partnership announcement (March 2, 2026)

coherent.com
4.

Coherent Corp., Form 8-K Exhibit 99.1 (March 2026)

sec.gov
5.

Broadcom Inc., Tomahawk 6 – Davisson announcement (October 8, 2025)

news.broadcom.com
6.

Marvell Technology, Inc., completion of Celestial AI acquisition

marvell.com
7.

Lumentum Holdings Inc., Form 8-K Exhibit 99.1, fiscal 2026 fourth quarter results

sec.gov
8.

Lumentum Holdings Inc., Annual Report to Shareholders, fiscal 2026

sec.gov
9.

International Energy Agency, Energy and AI

iea.org
10.

TSMC Research, Compact Universal Photonic Engine publication

research.tsmc.com

About the Author

Mayurima Roy

Mayurima Roy

Mayurima Roy is Research Analyst at Next Move Strategy Consulting, where she has spent 4 years working across the firm's full industry coverage rather than a single fixed vertical. Her work centers on structured research, ongoing trend tracking, competitive assessment, and insight-led content development, translating complex market data into clear, decision-ready narratives that support informed client decision-making across diverse global industries, market sectors, and world regions every day.

About the Reviewer

Supradip Baul

Supradip Baul

Supradip Baul is an accomplished business consultant and strategist with over a decade of rich experience in market intelligence, strategy, technology, and business transformation. His work has included rigorous qualitative and quantitative analysis across multiple industries, helping clients shape investment decisions and long-term roadmaps. Earlier in his career, he was associated with Gartner, where he contributed to industry-leading reports and market share analyses. He has worked with leading global companies and holds an MBA with a dual specialization in Marketing and Finance.

Download Free Sample

Rishabh Jogani

RISHABH JOGANI

Strategy Analyst

Accenture Japan

We are incredibly impressed with the market report on the real estate market in India provided by Next Move Strategy Consulting. The report was thorough, insightful, and well-structured, offering deep analysis and actionable recommendations. It not only captured the current trends and dynamics but also provided a forward-looking perspective that has been invaluable for our strategic planning. Their team demonstrated exceptional professionalism, attention to detail, and a profound understanding of the industry. The data-driven insights and clarity of presentation exceeded our expectations, making complex market trends easy to understand. We highly recommend Next Move Strategy Consulting to anyone looking for reliable and comprehensive market research services. Their expertise has given us the confidence to navigate the complexities of the Indian real estate market with clarity and foresight.

Gaurav Jaiswal

GAURAV JAISWAL

Founder & CEO

Yano Charge Private Limited

The EV Charging market research report provided by the NextMSC was exceptionally detailed and insightful. It offered a comprehensive analysis that proved to be a game-changer for our strategic planning. Truly a testament to the NextMSC’s expertise and thoroughness in EV market landscape & analysis.

Henri Knyphausen

HENRI KNYPHAUSEN

Partner at Singulier [Ex-BCG]

Singulier

I recently engaged NEXTMSC.com for a commercial due diligence project within the intralogistics sector, and I am pleased to provide a reference based on my experience. In utilizing NEXTMSC.com's services, I found their report to offer valuable insights into market dynamics and key industry players. The initial report provided a solid foundation for our analysis. However, as we were investigating a smaller target in the market, and I had specific customization requests requiring additional research. These requests included detailed information on product portfolios of various players and sub-market sizes, both inclusive and exclusive of certain product categories. NEXTMSC.com demonstrated commendable responsiveness and agility in accommodating these customization requests. Within a timeframe of 1-2 weeks, they delivered a revised report that met our specific needs. Furthermore, they were receptive to my follow-up inquiries, ensuring clarity and understanding of the data provided. The final deliverable significantly contributed to our due diligence efforts. One of NEXTMSC.com's notable strengths lies in their qualitative research capabilities. However, for future engagements, I would recommend the inclusion of a quantified market model in Excel format. Such a model would offer the ability to conduct in-depth analyses and explore various market segments, including country-specific data and subcomponent breakdowns. Based on my positive experience, I would not hesitate to work with NEXTMSC.com again. Their responsiveness, willingness to accommodate customization requests, and commitment to delivering actionable insights make them a reliable partner for commercial research projects.

Amos Chang

AMOS CHANG

Strategy Consultant

Kardex Group

I have bought the intralogistics market reports from NMSC two times so far. Joseph and his team are always very helpful and flexible in responding to any customization requirements on the report. Their expertise in market reports really helps us steer the day-to-day business. I will definitely recommend and come back myself whenever there is a need.

Ross J Mckenzie

ROSS J MCKENZIE

Business Insight Manager

Staysure Group

“Next MSC have been incredibly helpful in providing detailed & robust information on our market, alongside quantifying growth by different segments. The process to procure was simple and easy, with sample reports and regular contact to ensure we had what we needed. Succinct detail on their sources & methodologies is also greatly received, allowing transparency in this respect helps build trust in the detail you pay for. Joseph in particular was fantastic, and helped ensure efficient provision of the insight pack – thank you NMSC!”.

Custom Market Research Services

We will customize the research for you if the listed report does not fully match your requirements.

Get 30% Free Customization

Select License

This website uses cookies to ensure you get the best experience on our website. Learn more

✖