Data Center GPU Market Global Industry Analysis and Forecast (2026–2035)

Rising AI inference demand, hyperscale capital spending and sovereign compute programs lift the market from USD 168.00 Billion in 2025 to USD 840.00 Billion by 2035, led by North America and expanding at 12.1% CAGR from 2026 to 2035

Download Free Sample PDF
Base Year (2025)
$168.00 Billion
Forecast (2035)
$840.00 Billion
CAGR (2026-2035)
12.1%
Top Region
North America

What Is the Data Center GPU Market Size?
The global Data Center GPU Market reached USD 168.00 Billion in 2025 and is estimated at USD 300.00 Billion in 2026. It is forecast to reach USD 840.00 Billion by 2035, expanding at a 12.1% CAGR from 2026–2035. North America leads with approximately 62% share, while Training holds approximately 53% of workload revenue.
Our analysis shows that growth is concentrated in inference workloads, enterprise and AI cloud buyers, and Asia-Pacific deployments.

Data Center GPU Market Global Industry Analysis and Forecast (2026–2035) Revenue Forecast

Values in USD Billion

2025 $168.00 Billion
2025
2026 $300.00 Billion
2026
2027 $336.30 Billion
2027
2028 $376.99 Billion
2028
2029 $422.61 Billion
2029
2030 $473.74 Billion
2030
2031 $531.07 Billion
2031
2032 $595.33 Billion
2032
2033 $667.36 Billion
2033
2034 $748.11 Billion
2034
2035 $840.00 Billion
2035

Key Takeaways

By Workload: Training holds the largest share, expanding from USD 98.00 Billion in 2025 to USD 300.00 Billion by 2035; Inference is the fastest growing at 16.2% CAGR from 2026–2035.

By Form Factor: Module-based GPUs hold the largest share, expanding from USD 140.00 Billion in 2025 to USD 700.00 Billion by 2035; PCIe GPU cards are the fastest growing at 15.6% CAGR from 2026–2035.

By End User: Hyperscale cloud providers hold the largest share, expanding from USD 92.00 Billion in 2025 to USD 400.00 Billion by 2035; AI clouds and enterprises are the fastest growing at 13.6% CAGR from 2026–2035.

Dominant Region: North America, expanding from USD 106.00 Billion in 2025 to USD 460.00 Billion by 2035.

Fastest-Growing Region: Asia-Pacific at 15.0% CAGR from 2026–2035, reaching USD 190.00 Billion by 2035.

Dominant Country: U.S., expanding from USD 100.00 Billion in 2025 to USD 430.00 Billion by 2035.

Fastest-Growing Country: India at 20.0% CAGR from 2026–2035, reaching USD 18.00 Billion by 2035.

The market adds an absolute opportunity of USD 540.00 Billion between 2026 and 2035, which positions accelerator supply, packaging capacity and power ready sites as the highest priority investment themes.

According to NMSC analysis, inference spending will overtake training spending in absolute growth contribution before 2030, which shifts vendor differentiation from peak performance toward cost per token and memory capacity.

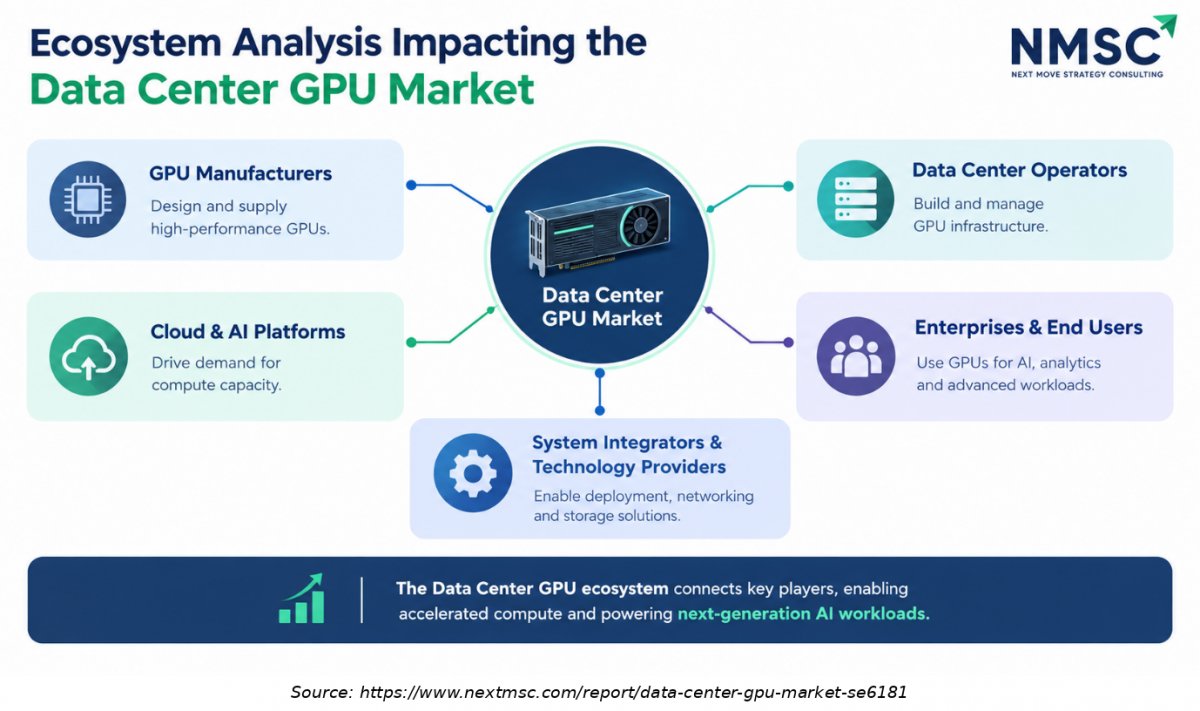
Ecosystem Analysis Impacting the Data Center GPU Market

The data center GPU ecosystem connects chip designers, semiconductor foundries, memory and networking suppliers, server manufacturers, cloud providers, software developers, and data center operators. Their coordination shapes GPU performance, scalability, deployment speed, and overall computing efficiency.

What Does the Data Center GPU Market Encompass?

The Market covers graphics processing units and general-purpose GPU accelerators sold as boards, modules and superchip packages for training and inference inside cloud, enterprise and sovereign facilities. Revenue is measured at the vendor sale point and excludes networking, host CPUs, servers, custom ASICs, TPUs and neural processing units. Rack scale systems enter the scope only for the GPU content they carry, which prevents double counting of switches, cabling and cooling.
During our market evaluation, we noticed that supply is concentrated in a few vendors while demand shifts from experimental clusters toward multi gigawatt facilities. NVIDIA reported fiscal 2026 Data Center revenue of USD 193.70 Billion, and the segment reached USD 89.00 Billion in a single quarter of fiscal 2027. Export controls reshape regional supply, since NVIDIA excludes China Data Center compute from its outlook, while power availability gates every new datacenterinfrastructure project.

Market Drivers & Dynamics

Interactive Dataset
Hyperscale and AI cloud capital spending driver +2.6% North America, Asia-Pacific 2026–2030
Shift from training to inference workloads driver +1.9% Global 2026–2035
Sovereign AI compute programs driver +1.2% Middle East & Africa, Europe, Asia-Pacific 2026–2032
Annual accelerator platform cadence driver +1.1% Global 2026–2029
Power and grid constraints restraint −2.4% North America, Europe 2026–2032
Export controls and regional decoupling restraint −1.0% China, Asia-Pacific 2026–2035
Customer financing and concentration risk restraint −0.9% North America 2026–2030
Source: Next Move Strategy Consulting

Growth Drivers

What Is the Primary Growth Driver in the Data Center GPU Market?

Capital spending by hyperscale and AI cloud operators is the primary driver. Strong quarterly earnings across major vendors demonstrate that purchasing of AI optimized data center infrastructure is accelerating, and we assess that supply, not demand, limits near term revenue. These results show that purchasing of AI optimized datacenterinfrastructure is still accelerating, and we assess that supply, not demand, limits near term revenue.

How Is Enterprise and Confidential Computing Adoption Driving the Market Growth?

Enterprise adoption widens the buyer base beyond cloud providers. NVIDIA disclosed that its GPUs with Confidential Computing now support confidential inference in Apple's Private Cloud Compute, which signals that regulated and privacy sensitive workloads accept accelerator-based architectures. Our findings suggest that such deployments favor PCIe GPU cards and air-cooled designs, which lifts that segment to 15.6% CAGR from 2026–2035 in the Data Center GPU Market.

Growth Inhibitors

What Is Restraining the Data Center GPU Market?

Power availability and trade policy restrain growth. The International Energy Agency expects global data centre electricity use to reach about 945 TWh by 2030, and the United States held 45% of consumption in 2024. Export policy also removes volume, as export restrictions restricted Data Center Hopper shipments to China, compared to USD 4.60 Billion in prior periods. We therefore apply a negative impact to the forecast.

What Are the Growth Opportunities?

Where Does Enterprise Inference at the Edge Create Room for PCIe GPU Cards?

Enterprises that run models near their data need accelerators that fit standard servers. This mechanism favors PCIe GPU cards, which we expect to grow at 15.6% CAGR from 2026–2035 to USD 140.00 Billion by 2035. Vendors that pair edge AI software tooling with air cooled cards, such as AMD and Intel, gain access to buyers who cannot adopt liquid cooled racks.

How Can Domestic GPU Vendors Capture Substitution Demand in China?

Export restrictions push Chinese buyers toward local suppliers. Moore Threads reported first half 2026 revenue of RMB 1.736 billion, up 147.42%, and Shanghai Biren Technology reported RMB 1,235.5 million, up 1,997.6%. These results show that domestic vendors capture substitution demand, so we project China to reach USD 18.00 Billion by 2035 at 18.2% CAGR from 2026–2035.

Which Sovereign and AI Cloud Programs Offer the Next Procurement Wave?

Governments and specialist operators are funding national compute capacity, often through sovereign cloud programs. Middle East & Africa grows at 14.0% CAGR from 2026–2035 to USD 78.00 Billion by 2035 in our forecast. Vendors able to supply complete racks, financing support and local partnerships benefit most, because buyers in these programs value fast deployment and supplier commitments over component price.

Segmentation Analysis

2025 (USD Billion)
2035 (USD Billion)
Training 2025: $98.00 Billion | 2035: $300.00 Billion
Training
Inference 2025: $70.00 Billion | 2035: $540.00 Billion
Inference
Training $98.00 Billion $300.00 Billion 7.2%
Inference $70.00 Billion $540.00 Billion 16.2%

Which Workload Segment Leads the Data Center GPU Market?

Training leads with approximately 53% of 2026 revenue, supported by frontier model clusters that still anchor the largest orders. Inference is the fastest growing segment at 16.2% CAGR from 2026–2035 because deployed models run continuously and serve more users each year. We observed that vendors now release inference tuned parts with large memory pools, which shows that product roadmaps follow the growth in token serving rather than model training alone.

2025 (USD Billion)
2035 (USD Billion)
Module based
PCIe GPU car
Segment Item 2025 (USD Billion) 2035 (USD Billion) CAGR
Module based GPUs $10.0 USD Billion $40.0 USD Billion 16.0%
PCIe GPU cards $17.1 USD Billion $51.1 USD Billion 26.0%

Segment-wise data is locked

Unlock complete segment-wise numbers for By Form Factor.

Unlock Full Data
2025 (USD Billion)
2035 (USD Billion)
Hyperscale c
AI clouds an
Segment Item 2025 (USD Billion) 2035 (USD Billion) CAGR
Hyperscale cloud providers $10.0 USD Billion $40.0 USD Billion 26.0%
AI clouds and enterprises $17.1 USD Billion $51.1 USD Billion 16.0%

Segment-wise data is locked

Unlock complete segment-wise numbers for By End User.

Unlock Full Data
2025 (USD Billion)
2035 (USD Billion)
North Americ
U.S.
Canada
Mexico
Europe
Segment Item 2025 (USD Billion) 2035 (USD Billion) CAGR
North America $10.0 USD Billion $40.0 USD Billion 26.0%
U.S. $17.1 USD Billion $51.1 USD Billion 16.0%
Canada $24.2 USD Billion $62.2 USD Billion 22.0%
Mexico $31.3 USD Billion $73.3 USD Billion 12.0%
Europe $38.4 USD Billion $84.4 USD Billion 27.0%

Segment-wise data is locked

Unlock complete segment-wise numbers for By Region.

Unlock Full Data

Growth Opportunities

Based on research conducted by NMSC, we found three opportunity areas where demand is visible and supply is still forming.

Where Does Enterprise Inference at the Edge Create Room for PCIe GPU Cards?

Enterprises that run models near their data need accelerators that fit standard servers. This mechanism favors PCIe GPU cards, which we expect to grow at 15.6% CAGR from 2026–2035 to USD 140.00 Billion by 2035. Vendors that pair edge AI software tooling with air cooled cards, such as AMD and Intel, gain access to buyers who cannot adopt liquid cooled racks.

How Can Domestic GPU Vendors Capture Substitution Demand in China?

Export restrictions push Chinese buyers toward local suppliers. Moore Threads reported first half 2026 revenue of RMB 1.736 billion, up 147.42%, and Shanghai Biren Technology reported RMB 1,235.5 million, up 1,997.6%. These results show that domestic vendors capture substitution demand, so we project China to reach USD 18.00 Billion by 2035 at 18.2% CAGR from 2026–2035.

Which Sovereign and AI Cloud Programs Offer the Next Procurement Wave?

Governments and specialist operators are funding national compute capacity, often through sovereign cloud programs. Middle East & Africa grows at 14.0% CAGR from 2026–2035 to USD 78.00 Billion by 2035 in our forecast. Vendors able to supply complete racks, financing support and local partnerships benefit most, because buyers in these programs value fast deployment and supplier commitments over component price.

Regional Outlook

2025 (USD Billion)
2035 (USD Billion)
North Americ
Europe
Asia-Pacific
Middle East
Latin Americ
Region 2025 (USD Billion) 2035 (USD Billion) CAGR (%)
North America $10.0 USD Billion $40.0 USD Billion 9.0%
Europe $17.1 USD Billion $51.1 USD Billion 27.0%
Asia-Pacific $24.2 USD Billion $62.2 USD Billion 25.0%
Middle East & Africa $31.3 USD Billion $73.3 USD Billion 23.0%
Latin America $38.4 USD Billion $84.4 USD Billion 12.0%

Regional data is locked

Unlock complete regional numbers for this market.

Unlock Full Data

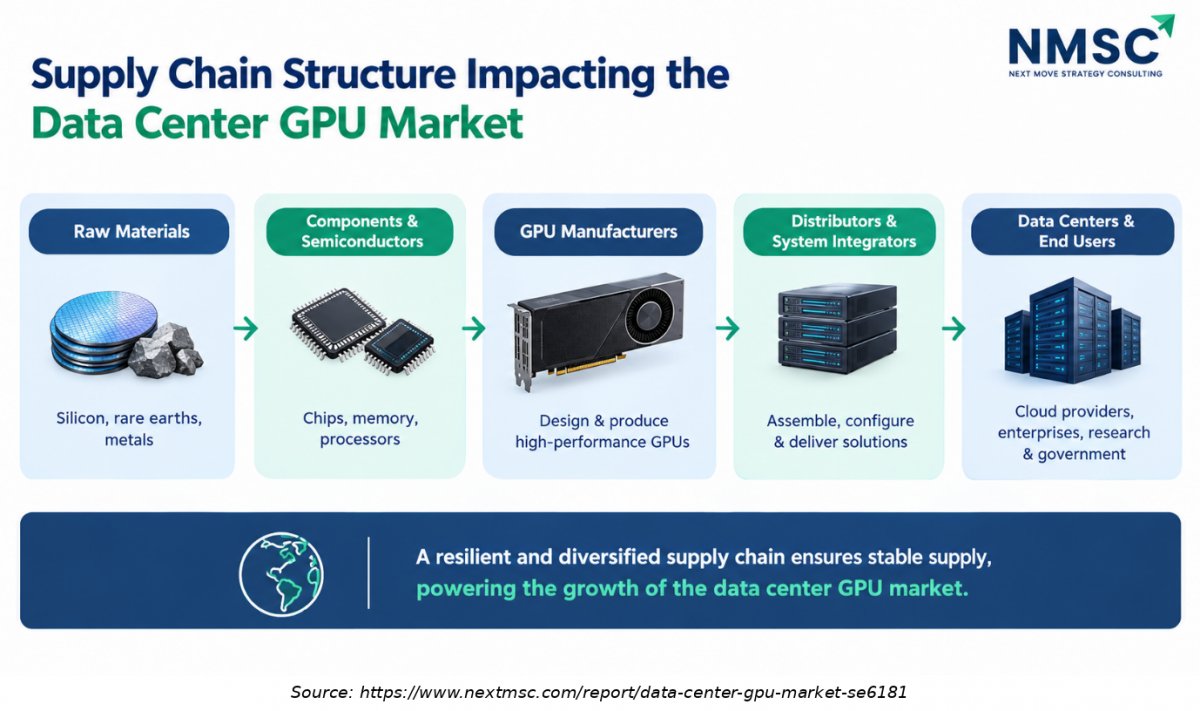
Supply Chain Structure Impacting the Data Center GPU Market

Supply Chain Structure Impacting the Data Center GPU Market

The data center GPU supply chain spans semiconductor materials and IP, chip design, wafer fabrication, advanced packaging, high-bandwidth memory integration, board and server assembly, distribution, and deployment. Manufacturing capacity, component availability, and logistics influence costs and delivery times

Competitive Landscape

Our findings suggest that competition centers on software ecosystems, memory capacity and system level integration rather than on silicon alone.

How Do Companies Compete in the Data Center GPU Market?

Competition combines performance, software maturity and supply assurance. NVIDIA reported fiscal 2026 Data Center revenue of USD 193.70 Billion, which funds an annual roadmap and a broad developer ecosystem. AMD answers with the Instinct line and its Helios rack, and challengers compete on price and availability. Buyers weigh cost per token, framework compatibility and delivery schedules, so supply commitments often decide awards before benchmark results do.

Which Company Archetypes Dominate the Data Center GPU Market?

Three archetypes dominate. The platform leader sells accelerators, interconnects and software as one stack. The open challenger emphasizes memory capacity, open software and lower acquisition cost, as AMD and Intel do. Regional champions such as Moore Threads and Shanghai Biren Technology rely on domestic demand and policy support. We found that differentiation themes center on ecosystem depth, rack scale design and assured supply.

How Do Leading Vendors Differentiate Through Innovation and Pricing?

Vendors differentiate through memory, precision formats and system design. Intel's Crescent Island offers 160 GB of LPDDR5X for air cooled servers, and Shanghai Biren Technology promotes optical interconnect for large clusters. Pricing remains premium for leading platforms, with NVIDIA reporting GAAP gross margin of 75.0% in its latest quarter, while challengers use bundled systems and financing to win share. Geographic expansion follows sovereign programs and cloud-region launches.

What Is the Role of M&A and Strategic Partnerships in the Data Center GPU Market?

Partnerships matter more than acquisitions because regulators scrutinize consolidation among accelerator designers. NVIDIA secured land, power and shell capacity through a partnership with SB Energy at the PORTS Pike Technology Campus in Ohio to host its compute, which shows that vendors now support customers' physical infrastructure. Shanghai Biren Technology raised approximately HK$7.04 Billion through a July 2026 share placement to expand production and research.

Key Market Players

Based on research conducted by NMSC, we ranked the verified vendors by market specific revenue and operating scale.

NVIDIA Corporation Advanced Micro Devices, Inc. Moore Threads Technology Co., Ltd. Intel Corporation Shanghai Biren Technology Co., Ltd.

Latest Developments

We observed that recent developments confirm accelerating revenue, expanding domestic supply in China and broader inference product portfolios.

Date Event
October 2026 NVIDIA and AMD GPUs were adapted for the llm-d distributed inference project, including prefill/decode-separated deployment.
August 2026 Biren, China Unicom’s Zhejiang and Wenzhou units, ZTE and Youyun announced a developer-computing cluster that had already been operating for several months
July 2026 AMD launched the Instinct MI400 family, including MI455X for frontier AI and MI430X for sovereign AI and high-performance computing
July 2026 AMD and Anthropic agreed to deploy up to 2 gigawatts of AMD Instinct MI450 Series GPUs in AMD Helios rack-scale systems
October 2025 Intel announced Crescent Island, a forthcoming data center GPU based on its Xe architecture and designed to support growing AI inference workloads

Expert Insights

Dr. Lisa Su

Chair and CEO | AMD

"AI adoption is accelerating from pilots to large-scale deployments, and that shift requires a new blueprint for compute infrastructure."

Analyst Interpretation

The statement highlights the transition from experimental AI projects to large-scale commercial deployments. This transition is increasing the need for data-center GPUs capable of supporting AI model training, inference, and other computationally intensive workloads. It is also encouraging the development of integrated GPU infrastructure that combines processing capacity, memory bandwidth, and high-speed networking to support scalable AI operations

Investment Opportunities

What Capital Inflows Are Supporting the Market?

Capital is flowing to both leaders and challengers. NVIDIA returned approximately USD 26.00 Billion to shareholders in the second quarter of fiscal 2027 and had approximately USD 99.00 Billion remaining under it repurchase authorization, which signals strong internal cash generation. Shanghai Biren Technology raised approximately HK$7.04 Billion in July 2026, and we observed that public listings of Chinese GPU designers broaden funding access for domestic capacity.

Where Is Infrastructure Investment Concentrated in the Market?

Investment concentrates in power, land and cooling alongside accelerators. NVIDIA's partnership with SB Energy to secure land, power and shell capacity in Ohio illustrates the trend, and the International Energy Agency notes that the largest data centres under construction consume about twenty times the electricity of a typical AI facility. We found that sites with secured grid capacity attract premium accelerator allocations.

What ESG Considerations Affect Investment in the Market?

Energy intensity is the central environmental issue. The International Energy Agency projects data centre electricity use of about 945 TWh in 2030 and about 1,200 TWh in 2035, with accelerated servers growing about 30% annually in its base case. Investors therefore Favor vendors that improve performance per watt and buyers that secure low carbon power, and we expect disclosure expectations on energy use to tighten.

Key Benefits for Stakeholders

How Does the Report Benefit Enterprise and Industry Leaders?

Enterprise and industry leaders gain a structured view of workload mix, form factor choices and regional supply conditions. The segmentation shows that PCIe GPU cards grow at 15.6% CAGR from 2026–2035, which helps planners match accelerator purchases to existing server estates. Our assessment indicates that country-level estimates for fifteen markets also support decisions on hosting location, supplier selection and multi-year capacity contracts.

How Does the Report Benefit Investors and Financial Analysts?

Investors and financial analysts receive a reconciled forecast that rises from USD 300.00 Billion in 2026 to USD 840.00 Billion by 2035. The analysis separates drivers such as inference demand from restraints such as power limits and export controls, and it quantifies each factor's effect on CAGR. We found that this structure supports scenario work on vendor revenue, supplier concentration and regional exposure.

How Does the Report Benefit Technology Vendors and Product Teams?

Technology vendors and product teams can identify which segments reward specific design choices. Inference grows at 16.2% CAGR from 2026–2035, which favors memory capacity and cost per token, while module-based GPUs still carry most revenue. Regional analysis shows where sovereign programs and domestic substitution create openings, and the competitive section clarifies how rivals combine software, systems and financing to win awards.

Key Market Segments Evaluated

By Workload

  • Training
  • Inference

By Form Factor

  • Module based GPUs
  • PCIe GPU cards

By End User

  • Hyperscale cloud providers
  • AI clouds and enterprises

By Region

  • North America 
    • U.S.
    • Canada
    • Mexico
  • Europe 
    • UK
    • Germany
    • France
    • Italy
    • Spain
    • Sweden
    • Denmark
    • Finland
    • Netherlands
    • Rest of Europe
  • Asia-Pacific 
    • China
    • India
    • Japan
    • South Korea
    • Taiwan
    • Indonesia
    • Vietnam
    • Australia
    • Philippines
    • Malaysia
    • Rest of APAC
  • Middle East & Africa 
    • Saudi Arabia
    • UAE
    • Egypt
    • Israel
    • Turkey
    • Nigeria
    • South Africa
    • Rest of MEA
  • Latin America 
    • Brazil
    • Argentina
    • Chile
    • Colombia
    • Rest of LATAM

Conclusion & Recommendations

The Data Center GPU Market is projected to grow from USD 300.00 Billion in 2026 to USD 840.00 Billion by 2035, a 12.1% CAGR. Growth is front loaded as current capacity shortages ease, then moderates as power and efficiency gains limit unit growth. We observed that inference and enterprise adoption sustain demand after the initial buildout, which keeps the outlook positive despite cyclical risk.

What Strategic Positioning Recommendations Does NMSC Offer?

NMSC recommends that vendors secure power-ready capacity partners, expand inference focused portfolios and invest in open software. Buyers should diversify suppliers, contract capacity in stages and prioritize performance per watt. Based on research conducted by NMSC, the winning strategy pairs assured supply with a credible software ecosystem, because customers value predictable delivery and developer productivity more than isolated benchmark gains.

How Does Investment Attractiveness Look for the Data Center GPU Market?

Attractiveness is high but uneven. Leading vendors report operating margins above 60% in recent filings, and the market adds USD 540.00 Billion between 2026 and 2035. Challengers offer higher growth from smaller bases, with Moore Threads and Shanghai Biren Technology growing revenue at triple digit rates in the first half of 2026. Investors should weigh customer concentration and policy exposure.

What Market Shifts and Key Risks Does the Data Center GPU Market Face?

Key shifts include the move from training to inference, rising enterprise and sovereign demand, and the localization of supply in China. Principal risks are grid constraints, export controls and customer financing, since several buyers expand faster than their balance sheets may support. We found that a slowdown in any large customer's spending would transmit quickly to suppliers because orders are concentrated.

What Are the Primary Growth Pathways Through 2035?

Growth pathways include inference at scale, PCIe based enterprise deployments, sovereign compute campuses and domestic substitution in China. Asia-Pacific at 15.0% CAGR and Middle East & Africa at 14.0% CAGR from 2026–2035 outpace North America at 10.6%. Vendors that combine accelerators, software and power ready deployment partners are best placed to capture these pathways through 2035.

FAQs

2. What is the Market forecast for 2035?

The market is forecast to reach USD 840.00 Billion by 2035.

3. What is the CAGR of the Data Center GPU Market from 2026 to 2035?

The market is expected to grow at a 12.1% CAGR from 2026 to 2035.

4. Which workload segment leads the Market?

Training leads with approximately 53% of 2026 revenue, equal to USD 160.00 Billion.

5. Which workload segment is growing fastest?

Inference is the fastest growing workload at 16.2% CAGR from 2026–2035, reaching USD 540.00 Billion by 2035.

6. Which region dominates the Data Center GPU Market?

North America dominates with approximately 62% share, or USD 186.00 Billion, in 2026.

7. Which region is growing fastest?

Asia-Pacific is the fastest growing region at 15.0% CAGR from 2026–2035.

8. Which country leads the Data Center GPU Market?

The U.S. leads with an estimated USD 176.00 Billion in 2026.

9. Who are the key players in the Data Center GPU Market?

Key players include NVIDIA Corporation, Advanced Micro Devices, Inc., Moore Threads Technology Co., Ltd., Intel Corporation and Shanghai Biren Technology Co., Ltd.

10. What are the main growth drivers of the Data Center GPU Market?

Hyperscale spending and inference demand lead, with NVIDIA Data Center revenue up 117% in the quarter ended July 2026.

11. What restrains the Data Center GPU Market?

Power limits and export controls restrain growth, and together they reduce forecast CAGR by about 3.4 percentage points in our model.

12. What opportunities exist in the Data Center GPU Market?

PCIe GPU cards offer the largest enterprise opportunity at 15.6% CAGR from 2026–2035, reaching USD 140.00 Billion by 2035.

13. How is AI shaping the Data Center GPU Market?

AI inference lifts the Inference segment from USD 140.00 Billion in 2026 to USD 540.00 Billion by 2035.

14. How do regulations affect the Data Center GPU Market?

Export controls removed Data Center Hopper shipments to China in the first quarter of fiscal 2027, against USD 4.60 Billion a year earlier.

15. How large is the India Data Center GPU Market?

India is estimated at USD 3.50 Billion in 2026 and USD 18.00 Billion by 2035, a 20.0% CAGR.

Sources & References

1.

NVIDIA Investor Relations: Second Quarter Fiscal 2027 Results

investor.nvidia.com
2.

NVIDIA CFO Commentary on First Quarter Fiscal 2027

s201.q4cdn.com
3.

NVIDIA Fourth Quarter and Fiscal 2026 Results (SEC filing)

sec.gov
4.

AMD Second Quarter 2026 Results (SEC Form 8-K)

sec.gov
5.

AMD Investor Relations: Second Quarter 2026 Results

ir.amd.com
6.

Shanghai Biren Technology: Interim Results Announcement 2026 (HKEX)

www1.hkexnews.hk
7.

Shanghai Biren Technology: Profit Alert Announcement (HKEX)

www1.hkexnews.hk
8.

Shanghai Stock Exchange English site: Moore Threads first half 2026 results

english.sse.com.cn
9.

Intel Newsroom: Crescent Island data center GPU announcement

newsroom.intel.com
10.

International Energy Agency: Energy and AI, Executive Summary

iea.org
11.

International Energy Agency: Energy and AI, Energy Demand from AI

iea.org

About the Author

Mayurima Roy

Mayurima Roy

Mayurima Roy is Research Analyst at Next Move Strategy Consulting, where she has spent 4 years working across the firm's full industry coverage rather than a single fixed vertical. Her work centers on structured research, ongoing trend tracking, competitive assessment, and insight-led content development, translating complex market data into clear, decision-ready narratives that support informed client decision-making across diverse global industries, market sectors, and world regions every day.

About the Reviewer

Supradip Baul

Supradip Baul

Supradip Baul is an accomplished business consultant and strategist with over a decade of rich experience in market intelligence, strategy, technology, and business transformation. His work has included rigorous qualitative and quantitative analysis across multiple industries, helping clients shape investment decisions and long-term roadmaps. Earlier in his career, he was associated with Gartner, where he contributed to industry-leading reports and market share analyses. He has worked with leading global companies and holds an MBA with a dual specialization in Marketing and Finance.

Download Free Sample

Semih Kavaklioglu

SEMIH KAVAKLIOGLU

Co-Founder & Sales Manager

Decortie

I work a lot in the marketing industry and I know that research is an essential part of any campaign. I have used Market research reports for my own products and I found them to be very informative and well-researched. The team here produces insightful reports for a good price

Mohit Agarwal

MOHIT AGARWAL

Chief Manager

DryChem India Pvt. Ltd.

Next Move Strategy Consulting is an amazing team of consultants. We required a market study report for our investors on top priority and the team went above and beyond our expectations to deliver the same with ample supporting data within a short time span enabling us to secure the investments and keep our project timeline maintained. Their professionalism, attention to detail, and timely delivery of actionable recommendations have left a lasting impression on our organization.

Gaurav Jaiswal

GAURAV JAISWAL

Founder & CEO

Yano Charge Private Limited

The EV Charging market research report provided by the NextMSC was exceptionally detailed and insightful. It offered a comprehensive analysis that proved to be a game-changer for our strategic planning. Truly a testament to the NextMSC’s expertise and thoroughness in EV market landscape & analysis.

Henri Knyphausen

HENRI KNYPHAUSEN

Partner at Singulier [Ex-BCG]

Singulier

I recently engaged NEXTMSC.com for a commercial due diligence project within the intralogistics sector, and I am pleased to provide a reference based on my experience. In utilizing NEXTMSC.com's services, I found their report to offer valuable insights into market dynamics and key industry players. The initial report provided a solid foundation for our analysis. However, as we were investigating a smaller target in the market, and I had specific customization requests requiring additional research. These requests included detailed information on product portfolios of various players and sub-market sizes, both inclusive and exclusive of certain product categories. NEXTMSC.com demonstrated commendable responsiveness and agility in accommodating these customization requests. Within a timeframe of 1-2 weeks, they delivered a revised report that met our specific needs. Furthermore, they were receptive to my follow-up inquiries, ensuring clarity and understanding of the data provided. The final deliverable significantly contributed to our due diligence efforts. One of NEXTMSC.com's notable strengths lies in their qualitative research capabilities. However, for future engagements, I would recommend the inclusion of a quantified market model in Excel format. Such a model would offer the ability to conduct in-depth analyses and explore various market segments, including country-specific data and subcomponent breakdowns. Based on my positive experience, I would not hesitate to work with NEXTMSC.com again. Their responsiveness, willingness to accommodate customization requests, and commitment to delivering actionable insights make them a reliable partner for commercial research projects.

Kishu Kanda

KISHU KANDA

Strategy Analyst

Accenture

We purchased the AI Consumer Market Report from this company. Not only did they customize the report to meet our specific requirements, but they also showed great flexibility in accommodating our budget. The report we received fully met our expectations. Additionally, they provided prompt and thorough responses to both our pre-purchase and follow-up questions. We look forward to working with this company again in the future.

Custom Market Research Services

We will customize the research for you if the listed report does not fully match your requirements.

Get 30% Free Customization

Select License

This website uses cookies to ensure you get the best experience on our website. Learn more

✖