AI Data Center Energy Management Market Global Industry Analysis and Forecast (2026–2035)

The global AI Data Center Energy Management Market size was valued at USD 2.70 billion in 2025 and is estimated at USD 3.50 billion in 2026, forecast to reach USD 22.00 billion by 2035, expanding at a 22.7% CAGR between 2026 and 2035. North America leads with approximately 43% share, while Software dominates all other offerings with approximately 45% share.

Download Free Sample PDF
Base Year (2025)
$2.70 Billion
Forecast (2035)
$22.00 Billion
CAGR (2026-2035)
22.7%
Top Region
North America

What Is the AI Data Center Energy Management Market Size?

The global AI Data Center Energy Management Market was valued at USD 2.70 Billion in 2025 and is estimated at USD 3.50 Billion in 2026. It is forecast to reach USD 22.00 Billion by 2035 at a 22.7% CAGR from 2026 to 2035. North America leads with approximately 43% share, while software holds approximately 45% of offerings.

We observed that electricity has become the binding constraint on AI capacity, which moves energy software from a reporting tool to a revenue protection layer. Operators now meter power at rack, row and hall level, forecast GPU load swings and shift workloads against grid signals. That discipline lets a fixed power allocation host more compute and lowers the cost of every training run.

Our assessment indicates that the largest segment and the fastest-growing segment differ across several categories. Software and hyperscale and cloud operators lead both in market size and growth within their respective categories, while mixed asset technology, onsite generation and grid integration, and the Middle East & Africa region offer the highest growth rates in their respective groups.

AI Data Center Energy Management Market Global Industry Analysis and Forecast (2026–2035) Revenue Forecast

Values in USD Billion

2025 $2.70 Billion
2025
2026 $3.50 Billion
2026
2027 $4.29 Billion
2027
2028 $5.27 Billion
2028
2029 $6.47 Billion
2029
2030 $7.93 Billion
2030
2031 $9.73 Billion
2031
2032 $11.94 Billion
2032
2033 $14.65 Billion
2033
2034 $17.98 Billion
2034
2035 $22.00 Billion
2035

Key Takeaways

By Offering: Software held the largest share, expanding from USD 1.19 Billion in 2025 to USD 11.60 Billion by 2035, and is also the fastest growing at 24.8% CAGR from 2026–2035.

By Application: Power and load management led with USD 1.45 Billion in 2025 and USD 10.20 Billion by 2035; onsite generation and grid integration is fastest at 27.9% CAGR from 2026–2035.

By End User: Hyperscale and cloud operators dominated, rising from USD 1.38 Billion in 2025 to USD 11.80 Billion by 2035, and are the fastest growing at 23.1% CAGR from 2026–2035.

Dominant Region: North America accounted for USD 1.17 Billion in 2025, approximately 43% of the global total, reaching USD 8.70 Billion by 2035.

Fastest-Growing Region: Middle East & Africa, at 28.1% CAGR from 2026–2035, rising from USD 0.10 Billion in 2025 to USD 1.30 Billion by 2035.

Dominant Country: The U.S., at approximately USD 1.03 Billion in 2025, reaching USD 7.55 Billion by 2035.

Fastest-Growing Country: India, at 29.9% CAGR from 2026–2035, rising from USD 0.07 Billion in 2025 to USD 1.05 Billion by 2035.

The AI Data Center Energy Management Market is projected to expand by approximately USD 18.50 billion between 2026 and 2035, rising from USD 3.50 billion to USD 22.00 billion. This projected expansion creates potential growth opportunities for energy control software, metering, workload orchestration and integrated power management solutions. Actual investment returns will depend on adoption rates, project economics and competitive conditions.

According to NMSC analysis, software led by power orchestration platforms will convert stranded grid capacity into usable compute, and that conversion will decide which operators scale fastest through 2035.

What Does the AI Data Center Energy Management Market Encompass?

The AI Data Center Energy Management Market covers software, hardware and services that monitor, forecast and control electricity, cooling and on site energy assets inside facilities built for AI training and inference. Scope includes energy and power management platforms, smart meters, sensors, intelligent power distribution controllers, load orchestration engines and the consulting and managed services that run them. Generic data center infrastructure such as bare power equipment and chillers sits outside the definition unless it ships with a control layer, which separates this market from the wider AI optimized datacenterinfrastructure category.
This market report notes that structural change comes from rack densities moving beyond 100 kilowatts, the arrival of 800 volt DC power designs and the pairing of data centers with turbines, engines and batteries. Regulators in Europe and Asia are tightening efficiency and reporting rules, so operators treat measurement as a compliance requirement. Digital twins and predictive analytics are now standard in tenders for new AI campuses.

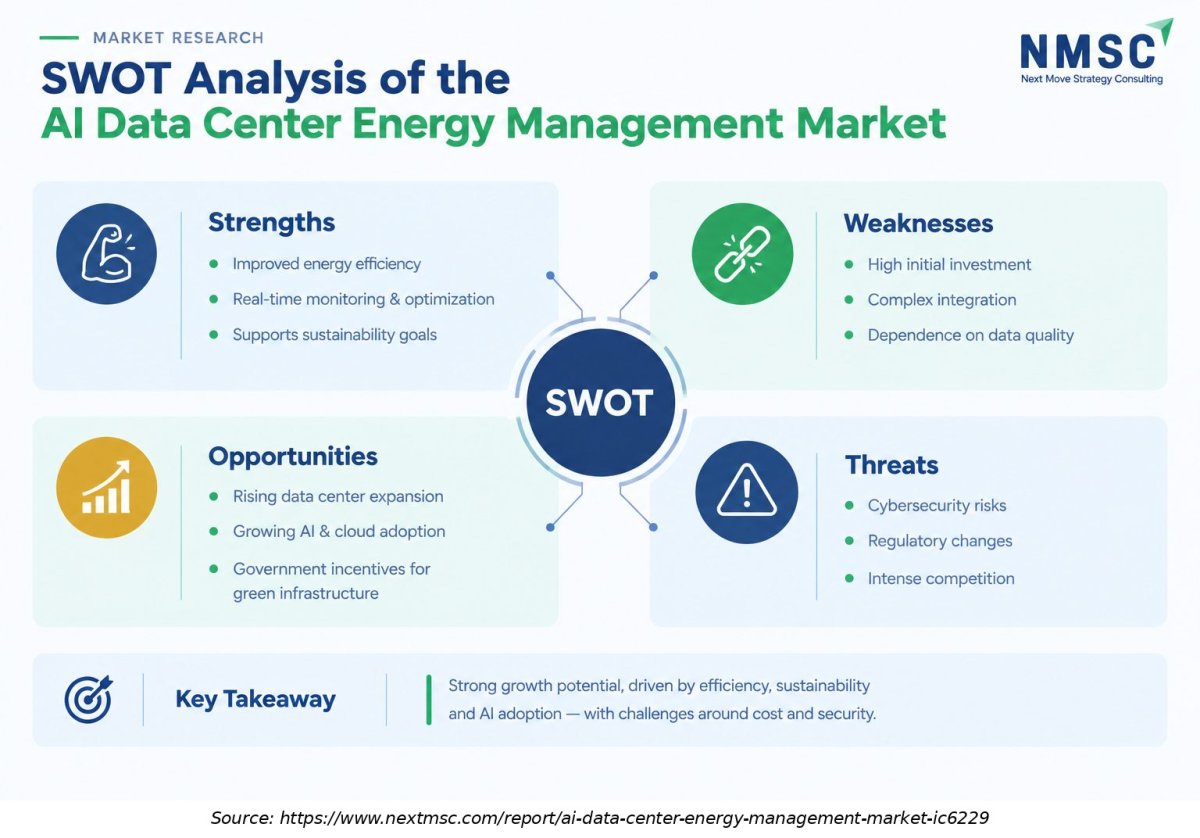
SWOT Analysis

This SWOT view highlights structural strengths, strategic gaps, expansion headroom, and external risks shaping outcomes in the AI Data Center Energy Management Market Global Industry Analysis and Forecast (2026–2035).

Strengths

The AI data center energy management market benefits from improved energy efficiency, real-time monitoring, and AI-driven optimization.

Weaknesses

However, high initial investment, integration complexity, and data quality requirements can hinder adoption.

Opportunities

Growing data center expansion, cloud computing, and sustainability initiatives create new opportunities,

Threats

while cybersecurity threats, regulatory changes, and intense competition remain key challenges for market participants.

Market Drivers & Dynamics

Interactive Dataset
Surge in AI compute power demand driver +6.2% Global, led by North America 2026–2035
Grid connection delays and power scarcity driver +4.8% North America, Europe 2026–2031
Efficiency and reporting regulation driver +2.9% Europe, Asia-Pacific 2026–2033
Adoption of 800 volt DC and liquid cooling driver +2.4% Global 2027–2035
Integration complexity with legacy building systems restraint −2.7% Enterprise sites worldwide 2026–2030
Uncertainty in long term demand forecasts restraint −2.1% Global 2026–2035
Operational technology cybersecurity exposure restraint −1.4% Global 2026–2032
Source: Next Move Strategy Consulting

Growth Drivers

What is the primary growth driver?

Electricity demand from AI data centers is the primary growth driver. The International Energy Agency's 2026 assessment estimates global data center electricity consumption at 485 TWh in 2025 and projects it to reach approximately 950 TWh by 2030. Electricity consumption from AI-focused data centers is expected to triple over the same period. Rising power requirements increase the need for energy monitoring, load forecasting, workload orchestration and cooling optimization, supporting demand for specialized energy management solutions.

How is regulation and grid scarcity driving market growth?

Grid operators in the United States and Europe now require load studies, flexibility commitments and efficiency reporting before approving large connections. The IEA states that data centres account for nearly half of United States electricity demand growth to 2030. Operators that can document consumption and shift load obtain power sooner, which pushes buyers toward integrated platforms from Schneider Electric, Siemens, Eaton and ABB.

Growth Inhibitors

What is restraining the market?

Demand uncertainty and integration effort restrain adoption. The IEA shows 2035 data centre electricity demand ranging from 700 to 1,700 TWh across its cases, which makes buyers cautious about long contracts. Our industry derived estimate indicates that retrofitting legacy building controls at enterprise sites adds months to deployment, and operational technology security reviews slow approvals for cloud connected energy software.

What Are the Growth Opportunities?

Where does energy orchestration for on site generation create value?

Campuses that add turbines, engines and battery energy storage need software to dispatch each asset against price, emissions and grid limits. The beneficiary segment is onsite generation and grid integration, which grows fastest in this report. Vendors that certify integrations with generator and storage makers can sell recurring optimization contracts rather than one time controllers.

How can colocation providers monetize energy visibility?

Colocation operators sell power by the kilowatt, so tenant level metering and transparent efficiency reporting directly support pricing and renewal. Providers can package carbon and energy dashboards for AI tenants that face reporting duties. Software and services vendors that white label these views to colocation landlords gain a path into hundreds of facilities.

What potential exists in retrofitting enterprise sites?

Enterprise data centers are converting halls to host dense AI clusters and need sensors and controls added to existing power chains. Retrofit programs favor modular meters, wireless sensors and cloud analytics that avoid shutdowns. Hardware and services providers focused on this segment can capture steady project demand while hyperscale buildouts compete for equipment supply.

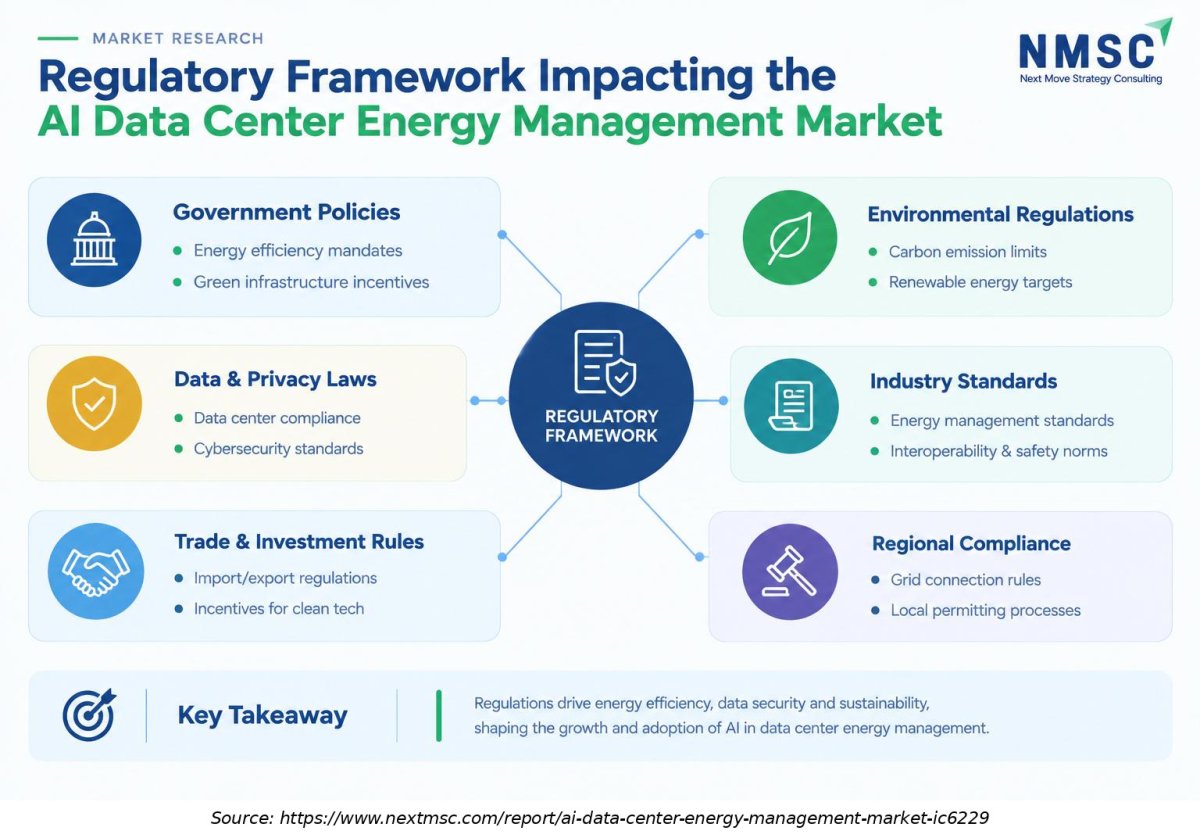
Regulatory Framework Impacting the AI Data Center Energy Management Market

The AI data center energy management market is shaped by energy efficiency policies, environmental regulations, data protection laws, and industry standards. Government incentives for green infrastructure can encourage investment, while cybersecurity requirements and compliance obligations influence technology deployment. Regional permitting procedures, grid interconnection rules, and trade regulations also affect implementation, making regulatory compliance essential for secure, efficient, and sustainable data center operations.

Segmentation Analysis

2025 (USD Billion)
2035 (USD Billion)
Software 2025: $1.19 Billion | 2035: $11.60 Billion
Software
Hardware 2025: $0.97 Billion | 2035: $6.30 Billion
Hardware
Services 2025: $0.54 Billion | 2035: $4.10 Billion
Services
Software $1.19 Billion $11.60 Billion 24.8%
Hardware $0.97 Billion $6.30 Billion 20.0%
Services $0.54 Billion $4.10 Billion 21.7%

Which offering segment leads the market?

We found that software is the dominant offering, with USD 1.19 Billion in 2025 rising to USD 11.60 Billion by 2035. It is also the fastest growing offering at 24.8% CAGR from 2026 to 2035. Operators prefer platforms that unify power, cooling and generation data, and vendors such as Schneider Electric and Vertiv add predictive analytics and managed services to lock in recurring revenue.

2025 (USD Billion)
2035 (USD Billion)
Category A
Category B
Category C
Category D
Segment Item 2025 (USD Billion) 2035 (USD Billion) CAGR
Category A $10.0 USD Billion $40.0 USD Billion 18.0%
Category B $17.1 USD Billion $51.1 USD Billion 16.0%
Category C $24.2 USD Billion $62.2 USD Billion 22.0%
Category D $31.3 USD Billion $73.3 USD Billion 12.0%

Segment-wise data is locked

Unlock complete segment-wise numbers for By Application.

Unlock Full Data
2025 (USD Billion)
2035 (USD Billion)
Category A
Category B
Category C
Category D
Segment Item 2025 (USD Billion) 2035 (USD Billion) CAGR
Category A $10.0 USD Billion $40.0 USD Billion 26.0%
Category B $17.1 USD Billion $51.1 USD Billion 16.0%
Category C $24.2 USD Billion $62.2 USD Billion 18.0%
Category D $31.3 USD Billion $73.3 USD Billion 8.0%

Segment-wise data is locked

Unlock complete segment-wise numbers for By End User.

Unlock Full Data
2025 (USD Billion)
2035 (USD Billion)
Category A
Category B
Category C
Category D
Segment Item 2025 (USD Billion) 2035 (USD Billion) CAGR
Category A $10.0 USD Billion $40.0 USD Billion 10.0%
Category B $17.1 USD Billion $51.1 USD Billion 8.0%
Category C $24.2 USD Billion $62.2 USD Billion 18.0%
Category D $31.3 USD Billion $73.3 USD Billion 8.0%

Segment-wise data is locked

Unlock complete segment-wise numbers for By Region.

Unlock Full Data

Growth Opportunities

NMSC's analysis indicates that three opportunity areas offer the clearest paths to incremental revenue.

Where does energy orchestration for on site generation create value?

Campuses that add turbines, engines and battery energy storage need software to dispatch each asset against price, emissions and grid limits. The beneficiary segment is onsite generation and grid integration, which grows fastest in this report. Vendors that certify integrations with generator and storage makers can sell recurring optimization contracts rather than one time controllers.

How can colocation providers monetize energy visibility?

Colocation operators sell power by the kilowatt, so tenant level metering and transparent efficiency reporting directly support pricing and renewal. Providers can package carbon and energy dashboards for AI tenants that face reporting duties. Software and services vendors that white label these views to colocation landlords gain a path into hundreds of facilities.

What potential exists in retrofitting enterprise sites?

Enterprise data centers are converting halls to host dense AI clusters and need sensors and controls added to existing power chains. Retrofit programs favor modular meters, wireless sensors and cloud analytics that avoid shutdowns. Hardware and services providers focused on this segment can capture steady project demand while hyperscale buildouts compete for equipment supply.

Regional Outlook

2025 (USD Billion)
2035 (USD Billion)
North Americ
Europe
Asia-Pacific
Middle East
Latin Americ
Region 2025 (USD Billion) 2035 (USD Billion) CAGR (%)
North America $10.0 USD Billion $40.0 USD Billion 9.0%
Europe $17.1 USD Billion $51.1 USD Billion 27.0%
Asia-Pacific $24.2 USD Billion $62.2 USD Billion 25.0%
Middle East & Africa $31.3 USD Billion $73.3 USD Billion 23.0%
Latin America $38.4 USD Billion $84.4 USD Billion 12.0%

Regional data is locked

Unlock complete regional numbers for this market.

Unlock Full Data

Competitive Landscape

Our findings suggest that the AI Data Center Energy Management Market is moderately concentrated, with global electrical and infrastructure groups competing against software specialists.

Dimension Description
Market Structure Moderately concentrated, led by global electrical and power infrastructure groups with software add ons
Innovation Focus 800 volt DC readiness, predictive analytics, digital twins and orchestration of on site generation and storage
M&A Activity Active, with infrastructure vendors acquiring software, services and fluid management capabilities

How do companies compete in this industry?

Competition centers on breadth of installed base, engineering depth and control software quality. Schneider Electric and Siemens bundle energy software with electrical and building systems, while Vertiv ties monitoring to power and cooling equipment. Eaton and ABB differentiate through power distribution and electrification expertise. Pricing is project based, and service contracts increasingly bundle analytics and uptime guarantees.

What is the innovation and differentiation strategy?

Vendors invest in AI driven forecasting, predictive maintenance and simulation to reduce downtime and energy waste. ABB has committed to support NVIDIA 800 VDC architecture, and Siemens positions its portfolio across chip design, power distribution and grid software. Differentiation increasingly depends on validated reference architectures with chip and cloud partners, which shorten design time for operators.

How active is M&A in the market?

Infrastructure vendors pursue acquisitions of software, services and specialized equipment to fill portfolio gaps in monitoring and thermal management. Partnerships with generation suppliers, such as the Vertiv and Caterpillar collaboration signed in November 2025, extend reach into on site energy. These alliances widen competitive boundaries and favor suppliers that can validate interfaces across power, cooling and generation.

Key Market Players

During our market evaluation, we validated the following companies through official filings and company releases, listed in ranked order by verifiable data center scale.

Schneider Electric SE Vertiv Holdings Co Eaton Corporation plc Siemens AG ABB Ltd

Latest Developments

We observed that development activity in the past twelve months concentrates on power architecture, partnerships with generation suppliers and capacity expansion.

Date Event
August 2026 Siemens announced more than USD 200 million in new U.S. manufacturing investments, including facilities in Pendergrass, Georgia, and Grand Prairie, Texas. The sites will expand production of low-voltage electrical infrastructure and critical power distribution equipment for AI-ready data centers, with the investment expected to create more than 1,500 jobs.
June 2026 ABB announced the next phase of its collaboration with NVIDIA, integrating ABB's SimReady 3D digital assets for medium-voltage switchgear, electrical distribution equipment and UPS systems into NVIDIA Omniverse DSX Blueprint. The digital twins enable operators to model and validate electrical, thermal and compute systems before ordering prefabricated modules.

Investment Opportunities

What capital inflows are supporting the market?

Capital flows through hyperscaler capex, colocation financing and vendor acquisitions. The IEA reports that global data centre investment reached about half a trillion dollars in 2024, and energy management captures a growing fraction as sites become power limited. Hyperscale datacenter operators fund software and metering to protect large infrastructure commitments, while investors back specialist software that raises utilization.

Where is infrastructure investment directed?

Infrastructure spending flows to prefabricated power and cooling modules, battery storage, on site generation and grid interconnection equipment that must be controlled by software. Vertiv, Eaton, Schneider Electric and Siemens are expanding manufacturing capacity for these systems. Investors should favor offerings that embed monitoring and orchestration, because control layers carry higher margins and recurring revenue than equipment alone.

How do ESG considerations influence investment?

Sustainability reporting duties and customer net zero targets make verified energy data a financing condition. Operators use platforms to track power usage effectiveness, carbon intensity and heat reuse. Green data certification and renewable matching increasingly influence lending terms, which strengthens the case for software that produces auditable consumption records across sites.

Key Benefits for Stakeholders

How does the report help enterprise and industry leaders?

Enterprise and cloud leaders gain a segmented view of this market by offering, application and end user, with regional and country forecasts to 2035. The analysis helps them benchmark spending, decide between platform and point solutions, and time retrofits. Planning teams can align capacity expansion with grid timelines using the report's demand and technology outlook.

What value does the report offer investors and financial analysts?

Investors receive reconciled size and growth estimates, a view of margin structure across hardware, software and services, and an assessment of vendor positioning. The forecast shows where recurring revenue concentrates and which regions grow fastest. Analysts can test scenarios against IEA demand cases and company disclosures to evaluate valuation and risk.

How can technology vendors and product teams use the report?

Vendors can identify high growth applications, partner needs and regional entry points. The competitive analysis clarifies archetypes, innovation priorities and acquisition patterns. Product teams can prioritize roadmaps for 800 volt DC support, digital twins and generation orchestration, and sales teams can target hyperscale, colocation and enterprise buyers with tailored value propositions.

Key Market Segments Evaluated

By Offering

  • Software
  • Hardware
  • Services

By Application

  • Power and load management
  • Cooling and thermal optimization
  • Onsite generation and grid integration

By End User

  • Hyperscale and cloud operators
  • Colocation providers
  • Enterprise data centers

By Region

  • North America 
    • U.S.
    • Canada
    • Mexico
  • Europe 
    • UK
    • Germany
    • France
    • Italy
    • Spain
    • Sweden
    • Denmark
    • Finland
    • Netherlands
    • Rest of Europe
  • Asia-Pacific 
    • China
    • India
    • Japan
    • South Korea
    • Taiwan
    • Indonesia
    • Vietnam
    • Australia
    • Philippines
    • Malaysia
    • Rest of APAC
  • Middle East & Africa 
    • Saudi Arabia
    • UAE
    • Egypt
    • Israel
    • Turkey
    • Nigeria
    • South Africa
    • Rest of MEA
  • Latin America 
    • Brazil
    • Argentina
    • Chile
    • Colombia
    • Rest of LATAM

Conclusion & Recommendations

NMSC's analysis indicates that the market expands from USD 3.50 Billion in 2026 to USD 22.00 Billion by 2035. Growth is anchored by IEA projections for rising data centre electricity use and by the shift of buyers from equipment toward control software and services. We expect steady double digit expansion as AI campuses multiply.

What Strategic Positioning Recommendations Does NMSC Offer?

We recommend that vendors build open orchestration platforms that connect power, cooling and generation, and certify integrations with chip, generator and battery partners. Services should shift toward managed analytics. Operators should standardize metering at rack level early, because retrofitting visibility costs more than designing it into new halls. Procurement teams should also require open data interfaces so that energy information can move between vendors.

What Is the Investment Attractiveness of the AI Data Center Energy Management Market?

Our assessment indicates high attractiveness, supported by recurring software revenue, strong demand visibility from hyperscalers and regulatory pull. Software offers the best growth at 24.8% CAGR from 2026 to 2035, while services secure customer relationships. Investors should weigh concentration risk in a few large buyers and the possibility of slower AI deployments.

What Are the Market Shifts and Key Risks in the AI Data Center Energy Management Market?

Key shifts include 800 volt DC designs, on site generation and demand flexibility as a condition of grid access. Risks include demand forecast uncertainty, integration complexity in legacy sites, operational technology cybersecurity and supplier lead times. Operators and vendors that plan for modular upgrades and secure by design architectures will manage these risks best.

What Are the Primary Growth Pathways Through 2035?

Growth pathways include expansion into Asia-Pacific and Middle East campuses, adoption of orchestration for batteries and turbines, and bundled managed services for colocation tenants. Retrofits of enterprise halls provide a steady base. We found that vendors combining hardware credibility with software depth capture the largest share of these pathways. Partnerships with chip makers and power equipment suppliers should accelerate adoption in new regions.

FAQs

About the Author

Mihul Sharma

Mihul Sharma

Mihul Sharma is Research Associate at Next Move Strategy Consulting, where he has covered technology, industrial, and healthcare markets for 3 years. His work applies structured business research, market analysis, and secondary-source review to assess market trends, competitive developments, and growth opportunities. He supports report development by fully synthesizing industry data, company information, and market signals into concise findings for strategy and investment-focused research teams.

About the Reviewer

Supradip Baul

Supradip Baul

Supradip Baul is an accomplished business consultant and strategist with over a decade of rich experience in market intelligence, strategy, technology, and business transformation. His work has included rigorous qualitative and quantitative analysis across multiple industries, helping clients shape investment decisions and long-term roadmaps. Earlier in his career, he was associated with Gartner, where he contributed to industry-leading reports and market share analyses. He has worked with leading global companies and holds an MBA with a dual specialization in Marketing and Finance.

Download Free Sample

Diana Trejo

DIANA TREJO

Assistant Manager

Sumitomo Corporation de Mexico, S.A. de C.V.

Recently, we purchased a report on the Mexico Data Center Market from Next Move Strategy Consulting. The service has been excellent, with support that is always timely and thoroughly professional. The information provided is interesting, highly useful, and delivered with clarity. I would highly recommend NextMSC for anyone seeking insightful and dependable analysis.

Kevin Coker

KEVIN COKER

Founder, CEO and Board Diector

Proxima Clinical Research

I have been using Next MSC reports for product positioning in a new geography for a long time. They have by far the best reports I have found and the price is reasonable too!

Gaurav Jaiswal

GAURAV JAISWAL

Founder & CEO

Yano Charge Private Limited

The EV Charging market research report provided by the NextMSC was exceptionally detailed and insightful. It offered a comprehensive analysis that proved to be a game-changer for our strategic planning. Truly a testament to the NextMSC’s expertise and thoroughness in EV market landscape & analysis.

Mohit Agarwal

MOHIT AGARWAL

Chief Manager

DryChem India Pvt. Ltd.

Next Move Strategy Consulting is an amazing team of consultants. We required a market study report for our investors on top priority and the team went above and beyond our expectations to deliver the same with ample supporting data within a short time span enabling us to secure the investments and keep our project timeline maintained. Their professionalism, attention to detail, and timely delivery of actionable recommendations have left a lasting impression on our organization.

Robert Sean Trevino

ROBERT SEAN TREVINO

Sr. Director, Head of Strategic Insights & Analytics

Foundation Medicine

I realized that it was a reliable source of information. These days, there are many people who are looking for authentic data, and this is one of the only sources that can offer them with what they need;

Custom Market Research Services

We will customize the research for you if the listed report does not fully match your requirements.

Get 30% Free Customization

Select License

This website uses cookies to ensure you get the best experience on our website. Learn more

✖