Drone Payload Market Global Industry Analysis and Forecast (2026–2035)

Drone Payload Market size was USD 12.74 Billion in 2025, projected to reach USD 50.02 Billion by 2035, growing at a CAGR of 13.1% from 2026 to 2035. Key drivers include defense surveillance demand, commercial inspection fleets and lighter sensors, with North America leading the market.

Download Free Sample PDF
Base Year (2025)
$12.74 Billion
Forecast (2035)
$50.02 Billion
CAGR (2026-2035)
13.1%
Top Region
North America

What Is the Drone Payload Market Size?

The global Drone Payload Market reached USD 12.74 Billion in 2025 and is estimated at USD 16.47 Billion in 2026, forecast to reach USD 50.02 Billion by 2035 at a CAGR of 13.1% between 2026 and 2035. North America leads with approximately 41% revenue share in 2025, while Imaging Payloads is the dominant payload type, holding approximately 27% of total market revenue.

We observed that demand is moving from standalone cameras toward payloads that combine imaging, ranging, radar and onboard processing on aircraft weighing less than 25 kg. Operators now buy mission outcomes rather than individual sensors, which favors suppliers that control stabilization, calibration and data handling. During our evaluation, defense surveillance programs and commercial inspection fleets shaped most unit demand, while aircraft sourcing rules in the United States redirected purchasing toward trusted supply chains.

Drone Payload Market Global Industry Analysis and Forecast (2026–2035) Revenue Forecast

Values in USD Billion

2025 $12.74 Billion
2025
2026 $16.47 Billion
2026
2027 $18.63 Billion
2027
2028 $21.07 Billion
2028
2029 $23.83 Billion
2029
2030 $26.95 Billion
2030
2031 $30.48 Billion
2031
2032 $34.47 Billion
2032
2033 $38.99 Billion
2033
2034 $44.10 Billion
2034
2035 $50.02 Billion
2035

Key Takeaways

By Payload Type: Imaging Payloads held the largest share, expanding from USD 3.49 Billion in 2025 to USD 11.76 Billion by 2035; Signals Intelligence and Electronic Warfare Payloads is the fastest growing at 16.2% CAGR from 2026–2035.

By Platform Type: Fixed-Wing UAVs held the largest share, expanding from USD 5.68 Billion in 2025 to USD 19.51 Billion by 2035; Hybrid VTOL UAVs is the fastest growing at 19.9% CAGR from 2026–2035.

By Payload Weight: Under 25 kg held the largest share, expanding from USD 8.00 Billion in 2025 to USD 27.51 Billion by 2035; 300 kg and Above is the fastest growing at 17.5% CAGR from 2026–2035.

By Sales Channel: OEM held the largest share, expanding from USD 9.48 Billion in 2025 to USD 35.01 Billion by 2035; Aftermarket is the fastest growing at 15.0% CAGR from 2026–2035.

By End User: Defense held the largest share, expanding from USD 7.47 Billion in 2025 to USD 26.01 Billion by 2035; Commercial and Industrial is the fastest growing at 15.4% CAGR from 2026–2035.

Dominant Region: North America held the largest share at 41.4% in 2025, expanding from USD 5.28 Billion to USD 18.51 Billion by 2035.

Fastest-Growing Region: Asia-Pacific expands quickest at 15.8% CAGR from 2026–2035, rising from USD 2.73 Billion in 2025 to USD 13.51 Billion by 2035.

Dominant Country: The U.S. leads with USD 4.55 Billion in 2025, projected to reach USD 15.73 Billion by 2035.

Fastest-Growing Country: India is the fastest growing at 20.3% CAGR from 2026–2035, rising from USD 0.23 Billion in 2025 to USD 1.69 Billion by 2035.

The Drone Payload Market offers an absolute opportunity of approximately USD 33.55 Billion between 2026 and 2035 for investors.

According to NMSC analysis, Hybrid VTOL UAVs will gain the most share, rising from 15% in 2025 to 27% in 2035.

Ecosystem Analysis of the Drone Payload Industry

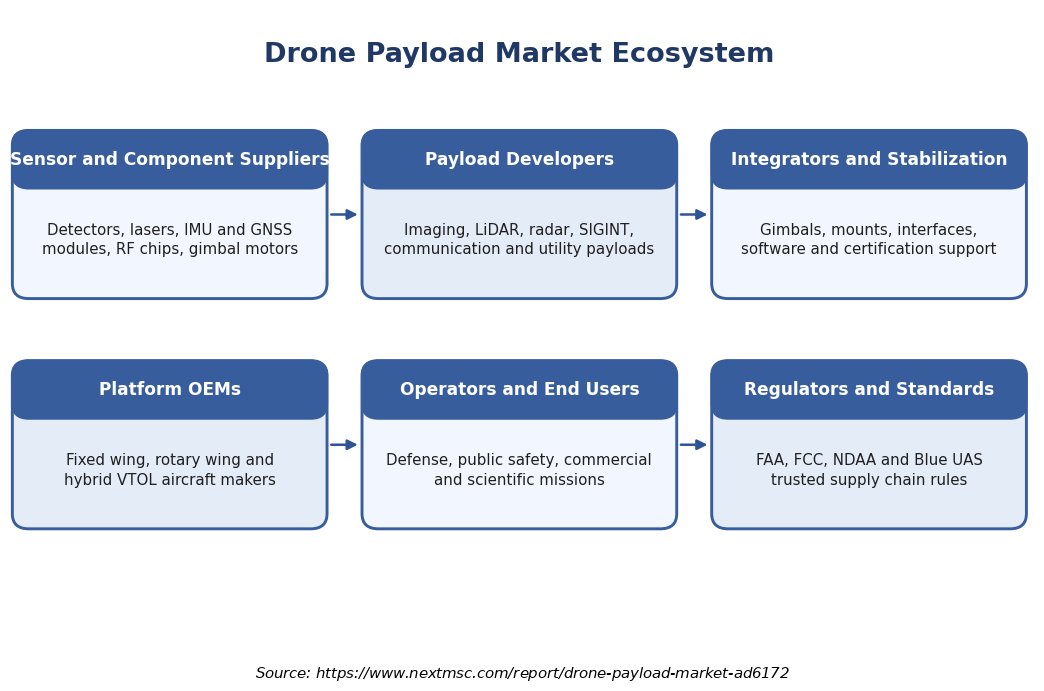
The above infographic presents the Drone Payload Market ecosystem in a simpler format, focusing on six participant groups: component suppliers, payload developers, integrators, platform OEMs, operators and regulators. Value concentrates with developers that own sensor performance and stabilization, while regulators influence which payloads reach customers through trusted ecosystem rules. Operators increasingly specify open interfaces so that one payload can move across several aircraft types.

What does the Drone Payload Market Encompass?

The Drone Payload Market covers sensors, mission equipment and stabilization systems that mount on unmanned aircraft and perform a defined task, from imaging and ranging to radar, signals collection, communications relay and cargo release. It excludes the airframe, flight controller, propulsion and kinetic weapons. Payloads are classified by function, aircraft platform, weight class, sales channel and end user, which allows demand to be tracked across defense, public safety, commercial and scientific missions.
Regulation shapes both demand and sourcing. The FAA and TSA proposed Part 108 in August 2025 to enable routine operations beyond visual line of sight, and about 3,100 comments had been received when the comment period reopened in 2026. The FCC added foreign produced aircraft and critical components to its Covered List in December 2025, which favors trusted payload suppliers. Technology adoption is moving toward lighter sensors with onboard processing.

Market Drivers & Dynamics

Interactive Dataset
Defense surveillance and unmanned fleet expansion driver +3.4% Global, led by North America and Europe 2026–2035
Growth of commercial inspection, mapping and agriculture fleets driver +2.2% North America, Europe, Asia-Pacific 2026–2032
Miniaturization of LiDAR, radar and thermal sensors driver +2.0% Global 2026–2035
Onboard AI processing and payload autonomy driver +1.8% Global 2027–2035
Trusted supply chain procurement under NDAA and Blue UAS rules driver +1.2% North America, Europe 2026–2030
FCC Covered List limits on foreign produced aircraft and components restraint −1.6% North America, global suppliers 2026–2028
Delayed final BVLOS rule slows commercial scale restraint −1.3% North America 2026–2027
Certification and integration cost for heavier payloads restraint −0.9% Global 2026–2030
Source: Next Move Strategy Consulting

Growth Drivers

What Is the Primary Growth Driver in the Drone Payload Industry?

Defense and security surveillance demand, including military drone programs, is the primary structural driver. NextVision raised its 2026 revenue growth target to 87% over 2025 in May and to 111% in August for stabilized cameras sold to unmanned aircraft makers. We estimate defense revenue at USD 9.55 Billion in 2026, which anchors the CAGR of 13.1% for the market.

How Is Commercial Drone Adoption Driving the Market Growth?

The FAA reported 837,513 registered drones in November 2025, including 453,635 commercial registrations and 481,760 certificated remote pilots, which shows a large installed fleet that needs inspection and mapping payloads. The FAA 2026 forecast expects cumulative Part 107 registrations to rise from 1.07 million in 2025 to 1.49 million by 2030, a CAGR of 6.8%. Operators add LiDAR, thermal and gimbal payloads to these aircraft, so payload spending grows faster than fleet size.

Growth Inhibitors

What Is Restraining the Drone Payload Market?

Sourcing limits and delayed regulation restrain growth. The FCC Covered List now blocks new equipment authorizations for foreign produced aircraft and critical components, which complicates payload sales into U.S. programs. The FAA had received about 3,100 comments on Part 108 when it reopened comments in 2026, and industry tracking showed the final rule still under federal review in September 2026, which delays routine BVLOS drone operations. We estimate these constraints reduce the CAGR by roughly 2.9 percentage points through 2028.

What Are the Growth Opportunities?

Can Part 108 Approvals Unlock Commercial Payload Volumes?

Routine operations beyond visual line of sight would let operators fly longer inspection, drone delivery and survey routes, which raises payload utilization. Commercial and Industrial customers grow at 15.4% through 2035, and LiDAR, thermal and cargo release payloads benefit most. Suppliers that certify payloads against FAA accepted consensus standards can reach utilities and pipeline operators first.

Does the Aftermarket Offer a Retrofit Pathway for Existing Fleets?

Aftermarket revenue grows at 15.0% against 12.4% for OEM sales, because fleet owners replace or upgrade payloads on aircraft already in service. Limits on new foreign produced equipment authorizations push public safety and enterprise operators toward compliant replacement cameras and gimbals. Payload makers with open interfaces and software updates can capture this retrofit demand without waiting for new aircraft.

Can Heavier Payload Classes Open Maritime and Border Surveillance Missions?

Payloads of 100 kg and above grow at 16.8% to 17.5%, compared with 11.6% for payloads under 25 kg. Hybrid VTOL UAVs, growing at 19.9%, can launch without runways and carry radar and multimode sensors for coastal and border patrol. Suppliers of lightweight radar and satellite communication payloads gain from this shift toward longer endurance aircraft.

Segmentation Analysis

2025 (USD Billion)
2035 (USD Billion)
Imaging Payloads 2025: $3.49 Billion | 2035: $11.76 Billion
Imaging Payl
LiDAR and Laser Payloads 2025: $1.14 Billion | 2035: $4.60 Billion
LiDAR and La
Geophysical Payloads 2025: $0.21 Billion | 2035: $0.70 Billion
Geophysical
Radar Payloads 2025: $1.32 Billion | 2035: $5.75 Billion
Radar Payloa
Signals Intelligence and Electronic Warfare Payloads 2025: $1.05 Billion | 2035: $5.40 Billion
Signals Inte
Communication Payloads 2025: $0.94 Billion | 2035: $4.30 Billion
Communicatio
Specialized Sensing Payloads 2025: $0.63 Billion | 2035: $2.80 Billion
Specialized
Gimbal and Stabilization Payloads 2025: $1.63 Billion | 2035: $4.75 Billion
Gimbal and S
Mission Utility Payloads 2025: $0.82 Billion | 2035: $3.20 Billion
Mission Util
Integrated Mission Payloads 2025: $1.51 Billion | 2035: $6.76 Billion
Integrated M
Imaging Payloads $3.49 Billion $11.76 Billion 11.4%
LiDAR and Laser Payloads $1.14 Billion $4.60 Billion 13.4%
Geophysical Payloads $0.21 Billion $0.70 Billion 11.6%
Radar Payloads $1.32 Billion $5.75 Billion 14.3%
Signals Intelligence and Electronic Warfare Payloads $1.05 Billion $5.40 Billion 16.2%
Communication Payloads $0.94 Billion $4.30 Billion 14.8%
Specialized Sensing Payloads $0.63 Billion $2.80 Billion 14.6%
Gimbal and Stabilization Payloads $1.63 Billion $4.75 Billion 9.7%
Mission Utility Payloads $0.82 Billion $3.20 Billion 13.2%
Integrated Mission Payloads $1.51 Billion $6.76 Billion 14.6%

Which Payload Types Dominate and Grow Fastest in the Market?

Imaging Payloads is the largest payload type at USD 3.49 Billion in 2025, supported by Integrated Imaging, which expands from USD 1.41 Billion to USD 5.41 Billion by 2035. Signals Intelligence and Electronic Warfare Payloads grows fastest at 16.2%, led by Electronic Attack at 19.4%, as armed forces expand electronic warfare missions on small aircraft. Gimbal and Stabilization Payloads is the slowest grower at 9.7% because stabilization increasingly arrives inside integrated payloads.

2025 (USD Billion)
2035 (USD Billion)
Fixed-Wing U
Rotary-Wing
Hybrid VTOL
Segment Item 2025 (USD Billion) 2035 (USD Billion) CAGR
Fixed-Wing UAVs $10.0 USD Billion $40.0 USD Billion 25.0%
Rotary-Wing UAVs $17.1 USD Billion $51.1 USD Billion 11.0%
Hybrid VTOL UAVs $24.2 USD Billion $62.2 USD Billion 25.0%

Segment-wise data is locked

Unlock complete segment-wise numbers for By Platform Type.

Unlock Full Data
2025 (USD Billion)
2035 (USD Billion)
Under 25 kg
Under 2 kg
2 kg to Unde
10 kg to Und
25 kg to Und
Segment Item 2025 (USD Billion) 2035 (USD Billion) CAGR
Under 25 kg $10.0 USD Billion $40.0 USD Billion 27.0%
Under 2 kg $17.1 USD Billion $51.1 USD Billion 9.0%
2 kg to Under 10 kg $24.2 USD Billion $62.2 USD Billion 19.0%
10 kg to Under 25 kg $31.3 USD Billion $73.3 USD Billion 17.0%
25 kg to Under 50 kg $38.4 USD Billion $84.4 USD Billion 18.0%

Segment-wise data is locked

Unlock complete segment-wise numbers for By Payload Weight.

Unlock Full Data

Which Payload Weight Classes Lead the Drone Payload Market?

Under 25 kg is the dominant class at USD 8.00 Billion in 2025, growing to USD 27.51 Billion by 2035, because most commercial, public safety and tactical aircraft cannot carry heavier loads. Within it, 2 kg to Under 10 kg is the largest band at USD 3.85 Billion in 2025. Payloads of 300 kg and Above grow fastest at 17.5% from a small base of USD 0.61 Billion, led by maritime and border surveillance on larger aircraft.

2025 (USD Billion)
2035 (USD Billion)
OEM
Aftermarket
Segment Item 2025 (USD Billion) 2035 (USD Billion) CAGR
OEM $10.0 USD Billion $40.0 USD Billion 14.0%
Aftermarket $17.1 USD Billion $51.1 USD Billion 24.0%

Segment-wise data is locked

Unlock complete segment-wise numbers for By Sales Channel.

Unlock Full Data
2025 (USD Billion)
2035 (USD Billion)
Defense
Government a
Commercial a
Scientific a
Segment Item 2025 (USD Billion) 2035 (USD Billion) CAGR
Defense $10.0 USD Billion $40.0 USD Billion 24.0%
Government and Public Safety $17.1 USD Billion $51.1 USD Billion 22.0%
Commercial and Industrial $24.2 USD Billion $62.2 USD Billion 20.0%
Scientific and Environmental $31.3 USD Billion $73.3 USD Billion 22.0%

Segment-wise data is locked

Unlock complete segment-wise numbers for By End User.

Unlock Full Data

Which End Users Drive Demand in the Drone Payload Market?

Defense leads at USD 7.47 Billion in 2025 and reaches USD 26.01 Billion by 2035, because armed forces buy surveillance, electronic support and communications relay payloads in volume. Commercial and Industrial grows fastest at 15.4%, driven by energy inspection, mapping, precision agriculture and construction monitoring. Government and Public Safety follows at 14.8% as police and emergency agencies add thermal and searchlight payloads to response fleets.

Supply Chain Analysis of the Drone Payload Industry

The above infographic maps the Drone Payload Market supply chain across materials and components, sensor modules, payload assembly, platform integration, distribution and operation. Margins concentrate in sensor modules and calibrated assembly, where detectors, lasers and radar electronics set performance. Origin of components has become a procurement test in the United States, so suppliers that document manufacturing location and offer retrofit upgrades through the aftermarket gain access to fleet owners.

Growth Opportunities

Our analysis shows that three opportunities are positioned to generate outsized revenue growth beyond the baseline forecast.

Can Part 108 Approvals Unlock Commercial Payload Volumes?

Routine operations beyond visual line of sight would let operators fly longer inspection, drone delivery and survey routes, which raises payload utilization. Commercial and Industrial customers grow at 15.4% through 2035, and LiDAR, thermal and cargo release payloads benefit most. Suppliers that certify payloads against FAA accepted consensus standards can reach utilities and pipeline operators first.

Does the Aftermarket Offer a Retrofit Pathway for Existing Fleets?

Aftermarket revenue grows at 15.0% against 12.4% for OEM sales, because fleet owners replace or upgrade payloads on aircraft already in service. Limits on new foreign produced equipment authorizations push public safety and enterprise operators toward compliant replacement cameras and gimbals. Payload makers with open interfaces and software updates can capture this retrofit demand without waiting for new aircraft.

Can Heavier Payload Classes Open Maritime and Border Surveillance Missions?

Payloads of 100 kg and above grow at 16.8% to 17.5%, compared with 11.6% for payloads under 25 kg. Hybrid VTOL UAVs, growing at 19.9%, can launch without runways and carry radar and multimode sensors for coastal and border patrol. Suppliers of lightweight radar and satellite communication payloads gain from this shift toward longer endurance aircraft.

Regional Outlook

2025 (USD Billion)
2035 (USD Billion)
North Americ
Europe
Asia-Pacific
Middle East
Latin Americ
Region 2025 (USD Billion) 2035 (USD Billion) CAGR (%)
North America $10.0 USD Billion $40.0 USD Billion 9.0%
Europe $17.1 USD Billion $51.1 USD Billion 27.0%
Asia-Pacific $24.2 USD Billion $62.2 USD Billion 25.0%
Middle East & Africa $31.3 USD Billion $73.3 USD Billion 23.0%
Latin America $38.4 USD Billion $84.4 USD Billion 12.0%

Regional data is locked

Unlock complete regional numbers for this market.

Unlock Full Data

Competitive Landscape

Our assessment indicates that the industry is moderately fragmented, with defense primes, sensor specialists and platform groups competing.

Dimension Description
Market Structure Moderately fragmented; defense primes lead radar, signals and integrated payloads while specialists lead gimbals, LiDAR and thermal modules
Innovation Focus Lower size, weight and power, onboard AI, sensor integration and trusted supply chain compliance
M&A Activity Selective; integration partnerships and capacity expansion are more common than large acquisitions

How Do Companies Compete in the Drone Payload Market?

Companies compete on sensor performance per kilogram, stabilization quality, integration ease, certification status and delivery time. Defense primes such as L3Harris, RTX and Elbit Systems bundle payloads with ground systems and long term support, while specialists such as NextVision, RIEGL and YellowScan compete on weight, accuracy and speed of delivery. Pricing ranges from commercial thermal modules sold in volume to bespoke radar payloads priced by program.

Which Competitive Archetypes Dominate the Drone Payload Market?

Three archetypes dominate. Defense primes, including Northrop Grumman, Lockheed Martin, Thales, BAE Systems, Leonardo and General Atomics Aeronautical Systems, lead radar, signals and multifunction payloads. Sensor specialists such as Teledyne FLIR, RIEGL, IMSAR and CONTROP lead imaging, LiDAR and radar. Platform led groups such as SZ DJI and AeroVironment sell payloads attached to their own aircraft. Differentiation themes are weight, accuracy, sourcing origin and software.

What Innovation and Differentiation Strategies Are Companies Pursuing?

We observed that suppliers are shrinking sensors, embedding AI and opening interfaces. IMSAR's NanoSAR D lowers radar size, weight and power, RIEGL's miniVUX-4UAV raises LiDAR accuracy to 12 mm, and Teledyne FLIR Defense certifies third party payloads such as Emesent Hovermap. NextVision is doubling production capacity by the end of 2026 to shorten delivery times, which shows that manufacturing scale is also a differentiator.

What M&A and Partnership Activity Is Shaping the Market?

Our findings suggest that partnerships and capacity investment shape the market more than large acquisitions. Teledyne FLIR OEM and Gremsy launched NDAA compliant payloads together, Teledyne FLIR Defense widened its payload integration program, and NextVision reported an order backlog of about USD 0.27 Billion in August 2026. Geographic expansion toward allied markets and price pressure on commodity thermal cameras complete the competitive picture.

Key Market Players

Based on research conducted by NMSC, the following 20 companies represent the validated leading participants in the market.

Teledyne FLIR, LLC L3Harris Technologies, Inc. RTX Corporation Elbit Systems Ltd. Leonardo S.p.A. SZ DJI Technology Co., Ltd. Northrop Grumman Corporation Lockheed Martin Corporation Thales S.A. Israel Aerospace Industries Ltd. General Atomics Aeronautical Systems, Inc. Safran S.A. BAE Systems plc ASELSAN Elektronik Sanayi ve Ticaret A.Ş. AeroVironment, Inc. NextVision Stabilized Systems Ltd. CONTROP Precision Technologies Ltd. RIEGL Laser Measurement Systems GmbH IMSAR LLC YellowScan SAS

Latest Developments

During our market evaluation, we noticed that 2025–2026 activity centered on trusted sourcing, sensor miniaturization and supplier capacity.

Date Event
September 2026 RIEGL introduced the miniVUX-4UAV UAV LiDAR sensor at INTERGEO 2026 in Munich, with selectable pulse rates up to 400 kHz, 12 mm accuracy and 8 mm precision.
April 2026 Teledyne FLIR Defense added the Emesent Hovermap LiDAR payload to its Third-Party Payload Integration Program at Modern Day Marine 2026.
April 2026 IMSAR completed the first flight of its NanoSAR D radar electronics assembly, demonstrating reduced size, weight and power for airborne radar.
December 2025 The FCC added foreign produced uncrewed aircraft systems and critical components to its Covered List; later notices exempted Blue UAS Cleared List items and domestic end products.

Investment Opportunities

Where Are Capital Inflows Concentrating in the Drone Payload Market?

Capital is concentrating in stabilized imaging, thermal, LiDAR and radar suppliers that show order backlogs and manufacturing scale. NextVision expanded capacity plans while raising targets twice in 2026, which signals confidence in payload demand. We expect Signals Intelligence and Electronic Warfare Payloads and Integrated Mission Payloads to attract the fastest capital growth, at 16.2% and 14.6% CAGR.

How Is Infrastructure Investment Shaping Market Capacity?

Infrastructure spending is moving toward production lines for thermal cores, gimbals and LiDAR engines, test ranges for payload certification, and data processing with drone software for LiDAR and multispectral outputs. Programs such as the FAA BEYOND initiative and Blue UAS testing increase demand for compliant payloads. Suppliers that expand assembly in North America and allied countries can shorten deliveries across the market.

What ESG Considerations Are Influencing Market Investment?

Environmental, social and governance factors influence payload investment through mission outcomes and supply chain governance. Emissions monitoring, CBRN detection, wildfire detection and search and rescue payloads deliver measurable environmental and social benefits. Governance concerns focus on data security, origin of components and export compliance, so buyers favor suppliers with transparent sourcing. Investors also monitor battery waste and responsible use of surveillance sensors.

Key Benefits for Stakeholders

How Does This Report Benefit Industry Leaders and Platform OEMs?

Platform manufacturers, defense program managers and operations leaders gain a reconciled model at USD 12.74 Billion in 2025, USD 16.47 Billion in 2026 and USD 50.02 Billion by 2035. The segmentation shows which payload types, weight classes and aircraft platforms grow fastest, helping teams plan integration roadmaps, supplier qualification and fleet upgrades.

How Does This Report Benefit Investors and Financial Analysts?

Investors and financial analysts gain regional and country forecasts, including Asia-Pacific at 15.8% CAGR and India at 20.3%, and visibility into USD 33.55 Billion of incremental revenue through 2035. The report separates fast growing payload types from mature ones, which supports portfolio decisions, supplier valuation and entry timing for new capital.

How Does This Report Benefit Payload Vendors and Product Teams?

Payload vendors and product teams gain evidence on which sensors justify research spending, from Electronic Attack at 19.4% to Multimode Radar at 17.4% CAGR. They also see how trusted sourcing rules, Aftermarket growth of 15.0% and Hybrid VTOL adoption affect product requirements, certification plans, pricing and channel strategy across the planning horizon.

Key Market Segments Evaluated

By Payload Type

  • Imaging Payloads 
    • Visible Imaging
      • RGB Cameras
      • High-Resolution Photogrammetry Cameras
      • Low-Light Cameras
    • Infrared Imaging
      • LWIR Cameras
      • MWIR Cameras
      • SWIR Cameras
    • Multispectral Imaging
      • Agricultural Multispectral Cameras
      • Environmental Multispectral Cameras
      • Other Multispectral Cameras
    • Hyperspectral Imaging
      • VNIR Hyperspectral Cameras
      • SWIR Hyperspectral Cameras
      • Other Hyperspectral Cameras
    • Integrated Imaging
      • EO and IR Payloads
      • EO and Multispectral Payloads
      • EO, IR and Laser Payloads
      • Other Integrated Imaging Payloads
  • LiDAR and Laser Payloads 
    • LiDAR
      • Topographic LiDAR
      • Corridor and Infrastructure LiDAR
      • Bathymetric LiDAR
      • Other Airborne LiDAR
    • Laser Sensing
      • Laser Rangefinders
      • Laser Altimeters
    • Laser Targeting
      • Laser Designators
      • Laser Illuminators
      • Laser Spot Trackers
  • Geophysical Payloads 
    • Magnetic Sensing
      • Magnetometers
      • Magnetic Gradiometers
    • Electromagnetic Sensing
      • Electromagnetic Survey Sensors
      • Other Electromagnetic Survey Sensors
    • Gravity Sensing
      • Gravimeters
      • Gravity Gradiometers
  • Radar Payloads 
    • Synthetic Aperture Radar
      • SAR
      • SAR and GMTI
      • SAR and ISAR
    • Surveillance Radar
      • Ground Surveillance Radar
      • Maritime Surveillance Radar
      • Air Surveillance Radar
    • Multimode Radar
      • AESA Radar
      • Multimode Radar
      • Maritime Multimode Radar
    • Other Mission Radar
      • Weather Radar
      • Sense-and-Avoid Radar
      • Other Airborne Radar
  • Signals Intelligence and Electronic Warfare Payloads 
    • Signals Intelligence
      • Communications Intelligence
      • Electronic Intelligence
    • Electronic Support
      • Electronic Support Measures
      • RF Emitter Detection
      • Direction Finding
      • RF Geolocation
    • Electronic Attack
      • Communications Jamming
      • Radar Jamming
      • RF Denial
      • Other Electronic Attack
  • Communication Payloads 
    • Data Links
      • Airborne Data Links
      • Tactical Data Links
    • Communications Relay
      • Cellular Relay
      • Tactical Communications Relay
      • Network Extension
    • Satellite Communications
      • SATCOM Terminals
      • Airborne SATCOM Modules
  • Specialized Sensing Payloads 
    • CBRN Detection
      • Chemical Detection
      • Biological Detection
      • Radiological Detection
      • Nuclear Detection
    • Environmental Sensing
      • Gas Sensing
      • Particulate Sensing
      • Air Quality Sensing
      • Emissions Monitoring
    • Radiation Sensing
      • Gamma Detection
      • Neutron Detection
      • Other Radiation Detection
    • Atmospheric Sensing
      • Weather Sensors
      • Temperature Sensors
      • Humidity Sensors
      • Pressure Sensors
      • Atmospheric Composition Sensors
    • Acoustic Sensing
      • Microphone Arrays
      • Acoustic Monitoring
    • Other Specialized Sensing
      • Other Chemical Sensors
      • Other Physical Sensors
  • Gimbal and Stabilization Payloads 
    • Standalone Gimbals
      • Two-Axis Gimbals
      • Three-Axis Gimbals
      • Multi-Axis Gimbals
  • Mission Utility Payloads 
    • Cargo and Delivery
      • Cargo Release Systems
      • Package Delivery Systems
      • Winch Delivery Systems
    • Spraying and Spreading
      • Liquid Sprayers
      • Granular Spreaders
    • Acoustic and Illumination
      • Loudspeakers
      • Searchlights
      • Floodlights
    • Beacon and Locator
      • Search and Rescue Beacons
      • Location Beacons
    • Dispensing
      • Sample Dispensers
      • Marker Dispensers
      • Other Non-Weapon Dispensers
    • Maritime Utility
      • Sonobuoy Deployment Systems
      • Sonobuoy Monitoring Systems
    • Other Mission Utility
  • Integrated Mission Payloads 
    • Multi-INT Payloads
      • EO and Radar
      • EO and SIGINT
      • Radar and SIGINT
      • EO, Radar and SIGINT
    • Multifunction Mission Payloads
      • Integrated Surveillance Pods
      • Cross-Domain Sensing Pods
      • Other Inseparable Multifunction Payloads

By Platform Type

  • Fixed-Wing UAVs
  • Rotary-Wing UAVs
  • Hybrid VTOL UAVs

By Payload Weight

  • Under 25 kg 
    • Under 2 kg
    • 2 kg to Under 10 kg
    • 10 kg to Under 25 kg
  • 25 kg to Under 50 kg
  • 50 kg to Under 100 kg
  • 100 kg to Under 300 kg
  • 300 kg and Above

By Sales Channel

  • OEM
  • Aftermarket

By End User

  • Defense
  • Government and Public Safety
  • Commercial and Industrial
  • Scientific and Environmental

By Region

  • North America 
    • U.S.
    • Canada
    • Mexico.
  • Europe 
    • UK
    • Germany
    • France
    • Italy
    • Spain
    • Sweden
    • Denmark
    • Finland
    • Netherlands
    • Rest of Europe.
  • Asia-Pacific 
    • China
    • India
    • Japan
    • South Korea
    • Taiwan
    • Indonesia
    • Vietnam
    • Australia
    • Philippines
    • Malaysia
    • Rest of APAC.
  • Middle East & Africa 
    • Saudi Arabia
    • UAE
    • Egypt
    • Israel
    • Turkey
    • Nigeria
    • South Africa
    • Rest of MEA.
  • Latin America 
    • Brazil
    • Argentina
    • Chile
    • Colombia
    • Rest of LATAM.

Conclusion & Recommendations

The long term outlook for the Drone Payload Market is positive, with revenue rising from USD 16.47 Billion in 2026 to USD 50.02 Billion by 2035 at a CAGR of 13.1%. Growth rests on defense surveillance demand, commercial inspection fleets and lighter sensors, and it is moderated by sourcing restrictions and slower regulation. We expect Hybrid VTOL UAVs and Asia-Pacific to gain share across the forecast period.

What Strategic Positioning Recommendations Does NMSC Offer?

Payload suppliers should prioritize low size, weight and power designs, onboard AI, open interfaces and documented component origin. Defense primes should package payloads with data processing and long term support, while specialists should certify products for Blue UAS and NDAA requirements and build aftermarket upgrade paths. Platform OEMs should qualify at least two payload suppliers per mission class to reduce sourcing risk.

What Is the Investment Attractiveness of the Drone Payload Market?

Investment attractiveness is high, supported by incremental revenue of USD 33.55 Billion through 2035 and by supplier order backlogs that extend into 2027. The most attractive pockets are Signals Intelligence and Electronic Warfare Payloads, Integrated Mission Payloads and the Aftermarket channel. Risk is higher in markets that depend on imported sensors, where currency and sourcing rules affect margins.

What Are the Market Shifts and Key Risks in the Drone Payload Market?

Key shifts include the move from single sensor cameras to integrated payloads, from ground processing to onboard AI, and from global sourcing to trusted supply chains. Main risks are the FCC Covered List, delays in the final BVLOS rule, export controls on advanced sensors and price pressure on commodity thermal cameras. Suppliers should monitor Part 108 publication and Blue UAS exemption windows.

What Are the Primary Growth Pathways Through 2035?

Primary growth pathways include electronic support and attack payloads at 15.0% to 19.4% CAGR, Hybrid VTOL aircraft at 19.9%, heavier payloads above 100 kg, and Asia-Pacific expansion at 15.8%. Aftermarket upgrades and commercial inspection fleets add volume, while integrated payloads raise average selling prices. Suppliers that combine these pathways with trusted sourcing and onboard processing can outgrow the baseline forecast.

FAQs

Sources & References

1.

Federal Aviation Administration and Transportation Security Administration – Normalizing Unmanned Aircraft Systems Beyond Visual Line of Sight Operations, notice of proposed rulemaking (90 FR 38212, 7 August 2025)

federalregister.gov
2.

Federal Aviation Administration – BVLOS rulemaking, reopening of comment period (FR Doc. 2026-02649)

public-inspection.federalregister.gov/2026-02649.pdf
3.

Federal Aviation Administration – Drones by the Numbers (as of November 2025)

faa.gov/node/54496
4.

Federal Aviation Administration – Aerospace Forecast Fiscal Years 2026–2046, Emerging Aviation Entrants (UAS and AAM)

faa.gov
5.

Federal Communications Commission – Covered List

fcc.gov
6.

Federal Communications Commission – Public Notice DA 26-253, UAS and UAS Critical Components exemption (18 March 2026)

docs.fcc.gov
7.

The White House – Executive Order 14307, Unleashing American Drone Dominance (6 June 2025)

whitehouse.gov
8.

NextVision Stabilized Systems Ltd. – 2026 sales target announcement (5 January 2026)

prnewswire.com
9.

NextVision Stabilized Systems Ltd. – first quarter 2026 results and updated target (11 May 2026)

prnewswire.com
10.

NextVision Stabilized Systems Ltd. – second quarter 2026 results (10 August 2026)

prnewswire.com
11.

RIEGL Laser Measurement Systems GmbH – company website (miniVUX-4UAV, INTERGEO 2026)

riegl.com
12.

IMSAR LLC – company website (NanoSAR D)

imsar.com
13.

Teledyne FLIR – company website (Third Party Payload Integration Program; Gremsy collaboration)

flir.com

About the Author

Mayurima Roy

Mayurima Roy

Mayurima Roy is Research Analyst at Next Move Strategy Consulting, where she has spent 4 years working across the firm's full industry coverage rather than a single fixed vertical. Her work centers on structured research, ongoing trend tracking, competitive assessment, and insight-led content development, translating complex market data into clear, decision-ready narratives that support informed client decision-making across diverse global industries, market sectors, and world regions every day.

About the Reviewer

Supradip Baul

Supradip Baul

Supradip Baul is an accomplished business consultant and strategist with over a decade of rich experience in market intelligence, strategy, technology, and business transformation. His work has included rigorous qualitative and quantitative analysis across multiple industries, helping clients shape investment decisions and long-term roadmaps. Earlier in his career, he was associated with Gartner, where he contributed to industry-leading reports and market share analyses. He has worked with leading global companies and holds an MBA with a dual specialization in Marketing and Finance.

Download Free Sample

Kishu Kanda

KISHU KANDA

Strategy Analyst

Accenture

We purchased the AI Consumer Market Report from this company. Not only did they customize the report to meet our specific requirements, but they also showed great flexibility in accommodating our budget. The report we received fully met our expectations. Additionally, they provided prompt and thorough responses to both our pre-purchase and follow-up questions. We look forward to working with this company again in the future.

Melanie Samko

MELANIE SAMKO

Director of Marketing

TOSOH BIOSCIENCE, INC.

The information provided by NMSC is incredibly valuable, thank you so much for such a excellent work. I really appreciate it. I will make sure to reference all of it, in my summary document.

Gustaf Hummel Burstrom

GUSTAF HUMMEL BURSTROM

Founder

Revline Tools AB

Joseph and the team at Next Move Strategy Consulting have been excellent to work with, in supplying us with relevant market data and forecasts for our specific category. We had some special requirements and they were able to do a custom package to suit our needs. We would definitely recommend them to any other company needing market data and forecasts

Henri Knyphausen

HENRI KNYPHAUSEN

Partner at Singulier [Ex-BCG]

Singulier

I recently engaged NEXTMSC.com for a commercial due diligence project within the intralogistics sector, and I am pleased to provide a reference based on my experience. In utilizing NEXTMSC.com's services, I found their report to offer valuable insights into market dynamics and key industry players. The initial report provided a solid foundation for our analysis. However, as we were investigating a smaller target in the market, and I had specific customization requests requiring additional research. These requests included detailed information on product portfolios of various players and sub-market sizes, both inclusive and exclusive of certain product categories. NEXTMSC.com demonstrated commendable responsiveness and agility in accommodating these customization requests. Within a timeframe of 1-2 weeks, they delivered a revised report that met our specific needs. Furthermore, they were receptive to my follow-up inquiries, ensuring clarity and understanding of the data provided. The final deliverable significantly contributed to our due diligence efforts. One of NEXTMSC.com's notable strengths lies in their qualitative research capabilities. However, for future engagements, I would recommend the inclusion of a quantified market model in Excel format. Such a model would offer the ability to conduct in-depth analyses and explore various market segments, including country-specific data and subcomponent breakdowns. Based on my positive experience, I would not hesitate to work with NEXTMSC.com again. Their responsiveness, willingness to accommodate customization requests, and commitment to delivering actionable insights make them a reliable partner for commercial research projects.

Rishabh Jogani

RISHABH JOGANI

Strategy Analyst

Accenture Japan

We are incredibly impressed with the market report on the real estate market in India provided by Next Move Strategy Consulting. The report was thorough, insightful, and well-structured, offering deep analysis and actionable recommendations. It not only captured the current trends and dynamics but also provided a forward-looking perspective that has been invaluable for our strategic planning. Their team demonstrated exceptional professionalism, attention to detail, and a profound understanding of the industry. The data-driven insights and clarity of presentation exceeded our expectations, making complex market trends easy to understand. We highly recommend Next Move Strategy Consulting to anyone looking for reliable and comprehensive market research services. Their expertise has given us the confidence to navigate the complexities of the Indian real estate market with clarity and foresight.

Custom Market Research Services

We will customize the research for you if the listed report does not fully match your requirements.

Get 30% Free Customization

Select License

This website uses cookies to ensure you get the best experience on our website. Learn more

✖