E-Mobility Market Global Industry Analysis and Forecast (2026–2035)

E-Mobility Market size was USD 688.84 Billion in 2025, projected to reach USD 3,402.25 Billion by 2035, growing at a CAGR of 15.1% from 2026 to 2035. Key drivers include falling battery costs, energy security concerns, fast charging platforms, and fleet electrification, with Asia-Pacific leading the market.

Download Free Sample PDF
Base Year (2025)
$688.84 Billion
Forecast (2035)
$3,402.25 Billion
CAGR (2026-2035)
15.1%
Top Region
Asia-Pacific

What Is the E-Mobility Market Size?

The global E-Mobility Market reached USD 688.84 Billion in 2025 and is estimated at USD 960.18 Billion in 2026. It is forecast to reach USD 3,402.25 Billion by 2035, growing at a CAGR of 15.1% from 2026 to 2035. Asia-Pacific led with about a 63.5% share in 2025, while Electric Passenger Vehicles held about 84.0% of vehicle segment revenue.

Our findings suggest that commercial vehicles, higher voltage platforms and new battery chemistries are growing faster than the wider market.

E-Mobility Market Global Industry Analysis and Forecast (2026–2035) Revenue Forecast

Values in USD Billion

2025 $688.84 Billion
2025
2026 $960.18 Billion
2026
2027 $1,105.17 Billion
2027
2028 $1,272.05 Billion
2028
2029 $1,464.13 Billion
2029
2030 $1,685.21 Billion
2030
2031 $1,939.68 Billion
2031
2032 $2,232.57 Billion
2032
2033 $2,569.69 Billion
2033
2034 $2,957.71 Billion
2034
2035 $3,402.25 Billion
2035

Key Takeaways

By Vehicles and Devices: Electric Passenger Vehicles held the largest share, expanding from USD 578.62 Billion in 2025 to USD 2,718.40 Billion by 2035. Electric Commercial Vehicles is the fastest-growing segment at 18.8% CAGR from 2026–2035.

By Powertrain Technology: BEV held the largest share, expanding from USD 489.08 Billion in 2025 to USD 2,459.83 Billion by 2035. EREV is the fastest-growing powertrain segment at 21.0% CAGR from 2026–2035.

By Traction Battery Chemistry: Li-Ion held the largest share, expanding from USD 646.13 Billion in 2025 to USD 3,041.60 Billion by 2035. Sodium-Ion is the fastest-growing chemistry segment at 35.3% CAGR from 2026–2035.

By Traction System Voltage: 60 V to 400 V held the largest share, expanding from USD 427.08 Billion in 2025 to USD 1,394.92 Billion by 2035. Above 800 V is the fastest-growing voltage segment at 34.3% CAGR from 2026–2035.

By End Use Application: Personal Commuting held the largest share, expanding from USD 489.08 Billion in 2025 to USD 2,075.39 Billion by 2035. Freight and Logistics is the fastest-growing application segment at 20.6% CAGR from 2026–2035.

By Customer Type: Individual Consumers held the largest share, expanding from USD 495.96 Billion in 2025 to USD 2,007.33 Billion by 2035. Private Sector Buyers is the fastest-growing customer segment at 19.6% CAGR from 2026–2035.

Dominant Region: Asia-Pacific dominated with approximately 63.5% revenue share in 2025, anchored by China's manufacturing base and strong domestic demand.

Fastest-Growing Region: Latin America is expected to register the highest CAGR of 22.8% during 2026–2035, after regional electric car sales rose 75% in the first quarter of 2026.

Dominant Country: China led the market with an estimated USD 376.17 Billion in 2025, supported by 16.49 million new energy vehicle sales.

Fastest-Growing Country: India is projected to expand from USD 20.89 Billion in 2026 to USD 170.62 Billion by 2035, a 26.3% CAGR, aided by PM E-DRIVE incentives.

The E-Mobility Market offers an absolute opportunity of about USD 2,442.07 Billion between 2026 and 2035, a signal of sustained capital demand.

According to NMSC analysis, Chinese exports are the swing factor because they carry affordable electric cars into markets without domestic production.

Ecosystem Analysis of the E-Mobility Industry

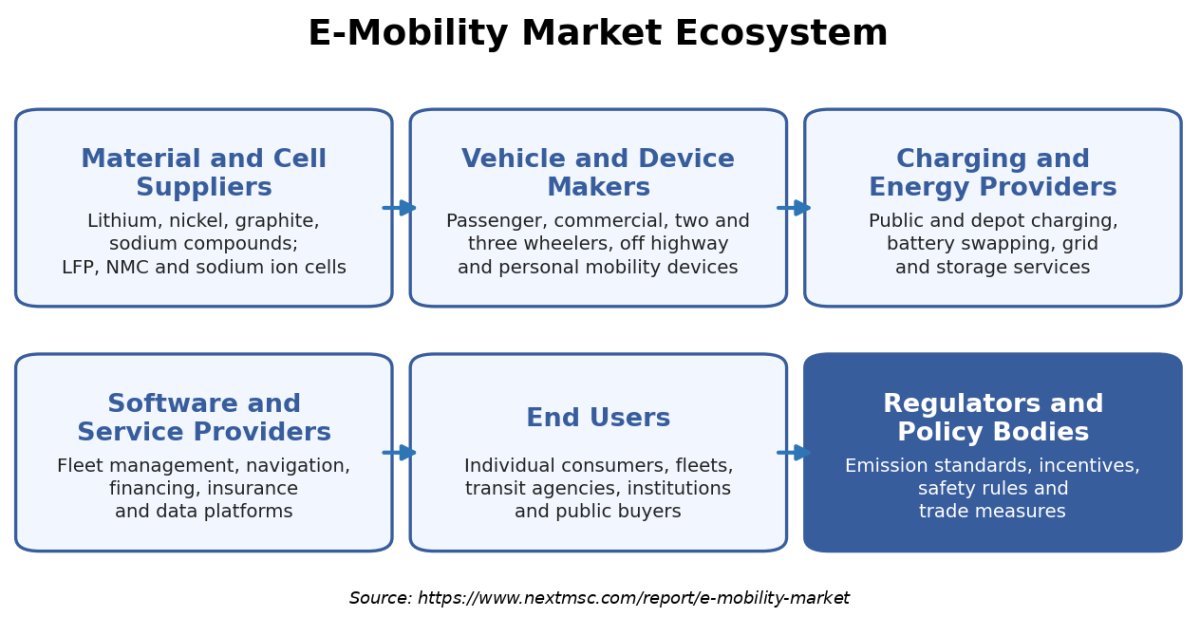
The above infographic presents the E-Mobility Market ecosystem in a simpler format, focusing on six participant groups. Material and cell suppliers feed vehicle and device makers, who rely on charging and energy providers to serve end users. Software and service providers connect the chain through navigation, fleet management, and financing. Regulators sit across every layer by setting emission rules, incentives, and safety standards. This structure shows why battery access, charging availability, and policy support jointly decide how quickly each group can scale.

What does the E-Mobility Market Encompass?

The E-Mobility Market covers vehicles and personal devices propelled by electric traction systems, including battery electric, plug-in hybrid, extended-range electric, and fuel cell powertrains. Its scope spans passenger cars, commercial vehicles, two-wheelers, three-wheelers, off-highway equipment, and personal mobility devices. Values reflect vehicle and device sales revenue at the manufacturer level across 38 countries. Charging infrastructure, energy services, and aftermarket repairs sit outside the scope to prevent double counting with adjacent markets.
Policy has shaped the E-Mobility Market structure further. China moved from a full purchase-tax exemption to a 50% reduction for new energy vehicles in 2026–2027, subject to a cap of approximately USD 2,243 per eligible passenger vehicle. The European Commission proposed changes to the 2035 vehicle CO2 framework in December 2025; the proposal remains subject to the EU legislative process. India’s PM E-DRIVE scheme has a total outlay of approximately USD 1.25 billion and runs through 31 March 2028. Public charging stations exceeded seven million points worldwide at the end of 2025.

Market Drivers & Dynamics

Interactive Dataset
Falling battery prices improving cost competitiveness with combustion vehicles driver +3.4% Global 2026–2035
Energy security response to the 2026 oil supply shock driver +2.6% Asia-Pacific, Europe, Latin America 2026–2030
Chinese export expansion lowering prices in emerging markets driver +2.1% Latin America, Middle East & Africa, Asia-Pacific 2026–2035
Commercial fleet electrification on total cost of ownership driver +1.9% China, Europe, India 2026–2035
Fast charging and 800 V platforms shortening charging time driver +1.6% China, Europe, North America 2026–2032
Incentive withdrawal and tax changes in the United States and China restraint −1.8% North America, China 2026–2028
Concentrated battery supply chain and trade barriers restraint −1.1% Global 2026–2035
Proposed easing of the EU 2035 car CO2 target restraint −0.9% Europe 2026–2035
Uneven public charging availability and grid constraints restraint −0.7% India, Latin America, Middle East & Africa 2026–2032
Source: Next Move Strategy Consulting

Growth Drivers

What Is the Primary Growth Driver in the E-Mobility Market?

Falling battery prices and improving cost competitiveness are the primary drivers. The IEA reports that electric car sales exceeded 20 million in 2025, a 20% rise that lifted the share of new car sales to 25%. The agency expects 23 million sales in 2026, or 28% of the market. As lithium-ion battery costs decline, price gaps with combustion vehicles narrow, which draws in buyers beyond early adopters and expands volume across segments.

How Is Energy Security Driving E-Mobility Market Growth?

The 2026 energy crisis has made oil dependence a policy concern for many importers. The IEA describes the situation as the largest oil supply shock in history and notes that the global EV fleet avoided about 1.7 million barrels of oil use per day in 2025. Vietnam, the largest EV market in Southeast Asia, has announced plans to expand or extend tax incentives. We found that fuel price volatility now supports adoption in emerging markets.

Growth Inhibitors

What Is Restraining the E-Mobility Market?

Policy withdrawal is the main restraint in the E-Mobility Market. The IEA found that global electric car sales fell 8% in the first quarter of 2026 compared with a year earlier, following policy changes in China and the United States. China moved from a full NEV purchase-tax exemption to a 50% reduction for 2026–2027, capped at RMB 15,000 per eligible passenger vehicle, while the United States ended federal consumer clean-vehicle credits for vehicles acquired after 30 September 2025. Ford, General Motors and Stellantis have also booked large charges against EV programs, reflecting changes in product plans and demand expectations

What Are the Growth Opportunities?

Where Does Emerging Market Electrification Create Opportunity?

Emerging markets are scaling quickly from a low base. The IEA reports first-quarter 2026 electric car sales growth of 80% in Asia Pacific excluding China and 75% in Latin America. Southeast Asia could lift its electric car share from close to 20% to 60% by 2035. Makers of affordable passenger cars, two-wheelers, and three-wheelers benefit most, because local buyers weigh fuel costs heavily.

How Can Commercial Fleet Electrification Open New Revenue Pools?

Freight and Logistics is the fastest-growing application at 20.6% CAGR, and Private Sector Buyers expand at 19.6% as operators chase lower running costs. Last-mile delivery fleets lead early adoption, while regional and long-haul freight accelerates as charging for heavy trucks matures. Vehicle makers, leasing firms and charging operators gain from depot electrification contracts that bundle vehicles, energy and financing.

What Opportunity Does Battery Chemistry Diversification Create?

The European Commission's proposed battery booster of EUR 1.8 Billion, including EUR 1.5 Billion in interest-free loans, shows how governments want to build local cell supply. Sodium-ion and LFP cells open lower-cost vehicle tiers, while second-life packs can feed battery energy storage projects. Cell makers, recyclers and affordable vehicle brands are the main beneficiaries.

Segmentation Analysis

2025 (USD Billion)
2035 (USD Billion)
Electric Passenger Vehicles 2025: $578.62 Billion | 2035: $2,718.40 Billion
Electric Pas
Electric Commercial Vehicles 2025: $58.55 Billion | 2035: $408.27 Billion
Electric Com
Electric Two-wheelers 2025: $26.18 Billion | 2035: $136.09 Billion
Electric Two
Electric Three-wheelers 2025: $6.20 Billion | 2035: $34.02 Billion
Electric Thr
Off-Highway EV 2025: $11.02 Billion | 2035: $78.25 Billion
Off-Highway
Electric Personal Mobility Devices 2025: $8.27 Billion | 2035: $27.22 Billion
Electric Per
Electric Passenger Vehicles $578.62 Billion $2,718.40 Billion 14.6%
Electric Commercial Vehicles $58.55 Billion $408.27 Billion 18.8%
Electric Two-wheelers $26.18 Billion $136.09 Billion 15.4%
Electric Three-wheelers $6.20 Billion $34.02 Billion 15.8%
Off-Highway EV $11.02 Billion $78.25 Billion 18.6%
Electric Personal Mobility Devices $8.27 Billion $27.22 Billion 10.0%

Which Vehicle and Device Segment Leads the E-Mobility Market?

Electric Passenger Vehicles lead the E-Mobility Market with about 84.0% of 2025 revenue, equal to USD 578.62 Billion. Electric Commercial Vehicles are the fastest-growing segment at 18.8% CAGR from 2026 to 2035, rising from USD 86.42 Billion to USD 408.27 Billion. The IEA notes that electric truck sales doubled in 2025, and electric buses already hold a strong position in China. Within passenger cars, SUVs and Crossovers capture the largest share because buyers favor larger body styles.

2025 (USD Billion)
2035 (USD Billion)
Category A
Category B
Category C
Category D
Segment Item 2025 (USD Billion) 2035 (USD Billion) CAGR
Category A $10.0 USD Billion $40.0 USD Billion 25.0%
Category B $17.1 USD Billion $51.1 USD Billion 11.0%
Category C $24.2 USD Billion $62.2 USD Billion 25.0%
Category D $31.3 USD Billion $73.3 USD Billion 11.0%

Segment-wise data is locked

Unlock complete segment-wise numbers for By Powertrain Technology.

Unlock Full Data
2025 (USD Billion)
2035 (USD Billion)
Category A
Category B
Category C
Category D
Segment Item 2025 (USD Billion) 2035 (USD Billion) CAGR
Category A $10.0 USD Billion $40.0 USD Billion 27.0%
Category B $17.1 USD Billion $51.1 USD Billion 9.0%
Category C $24.2 USD Billion $62.2 USD Billion 19.0%
Category D $31.3 USD Billion $73.3 USD Billion 17.0%

Segment-wise data is locked

Unlock complete segment-wise numbers for By Traction Battery Chemistry.

Unlock Full Data
2025 (USD Billion)
2035 (USD Billion)
Category A
Category B
Category C
Category D
Segment Item 2025 (USD Billion) 2035 (USD Billion) CAGR
Category A $10.0 USD Billion $40.0 USD Billion 14.0%
Category B $17.1 USD Billion $51.1 USD Billion 24.0%
Category C $24.2 USD Billion $62.2 USD Billion 22.0%
Category D $31.3 USD Billion $73.3 USD Billion 12.0%

Segment-wise data is locked

Unlock complete segment-wise numbers for By Traction System Voltage.

Unlock Full Data
2025 (USD Billion)
2035 (USD Billion)
Category A
Category B
Category C
Category D
Segment Item 2025 (USD Billion) 2035 (USD Billion) CAGR
Category A $10.0 USD Billion $40.0 USD Billion 24.0%
Category B $17.1 USD Billion $51.1 USD Billion 22.0%
Category C $24.2 USD Billion $62.2 USD Billion 20.0%
Category D $31.3 USD Billion $73.3 USD Billion 22.0%

Segment-wise data is locked

Unlock complete segment-wise numbers for By End Use Application.

Unlock Full Data
2025 (USD Billion)
2035 (USD Billion)
Category A
Category B
Category C
Category D
Segment Item 2025 (USD Billion) 2035 (USD Billion) CAGR
Category A $10.0 USD Billion $40.0 USD Billion 23.0%
Category B $17.1 USD Billion $51.1 USD Billion 9.0%
Category C $24.2 USD Billion $62.2 USD Billion 19.0%
Category D $31.3 USD Billion $73.3 USD Billion 13.0%

Segment-wise data is locked

Unlock complete segment-wise numbers for Customer Type.

Unlock Full Data

Supply Chain Analysis of the E-Mobility Market

Supply Chain Analysis of the E-Mobility Market
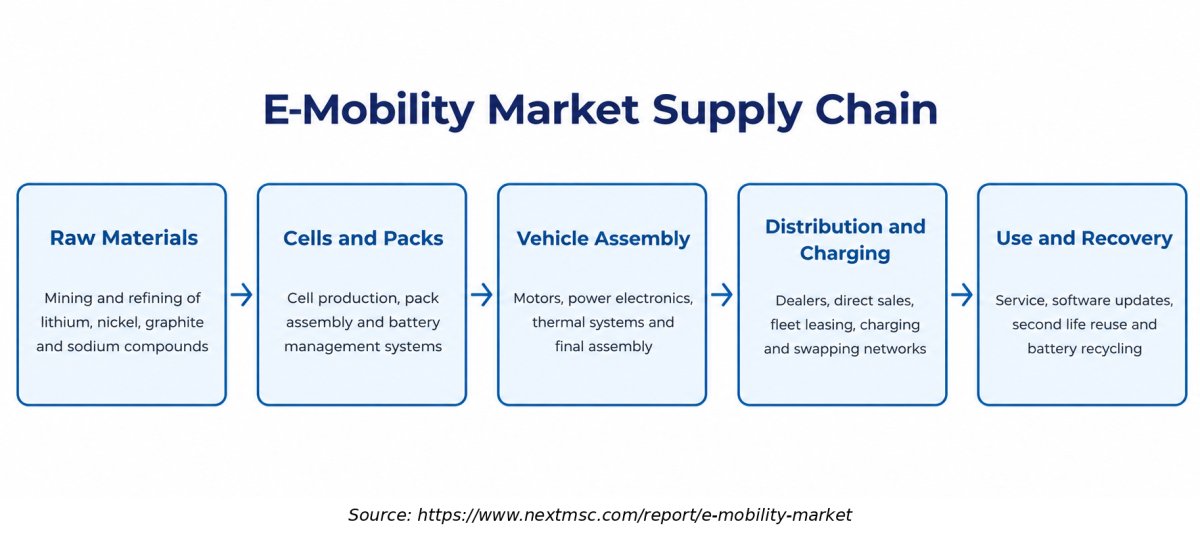
The above infographic traces the E-Mobility Market supply chain through five stages, from raw materials to end-of-life recovery. Mining and refining of lithium, nickel, graphite, and sodium compounds feed cell and pack production. Vehicle and device assembly follows, supported by motors, power electronics, and thermal systems. Distribution, charging and service networks then connect products to users. Recovery through battery recycling closes the loop. China held over 80% of global battery cell production in 2025, which concentrates risk at the cell stage.

Growth Opportunities

Our findings suggest that three opportunities offer the clearest path to value creation through 2035.

Where Does Emerging Market Electrification Create Opportunity?

Emerging markets are scaling quickly from a low base. The IEA reports first-quarter 2026 electric car sales growth of 80% in Asia Pacific excluding China and 75% in Latin America. Southeast Asia could lift its electric car share from close to 20% to 60% by 2035. Makers of affordable passenger cars, two-wheelers, and three-wheelers benefit most, because local buyers weigh fuel costs heavily.

How Can Commercial Fleet Electrification Open New Revenue Pools?

Freight and Logistics is the fastest-growing application at 20.6% CAGR, and Private Sector Buyers expand at 19.6% as operators chase lower running costs. Last-mile delivery fleets lead early adoption, while regional and long-haul freight accelerates as charging for heavy trucks matures. Vehicle makers, leasing firms and charging operators gain from depot electrification contracts that bundle vehicles, energy and financing.

What Opportunity Does Battery Chemistry Diversification Create?

The European Commission's proposed battery booster of EUR 1.8 Billion, including EUR 1.5 Billion in interest-free loans, shows how governments want to build local cell supply. Sodium-ion and LFP cells open lower-cost vehicle tiers, while second-life packs can feed battery energy storage projects. Cell makers, recyclers and affordable vehicle brands are the main beneficiaries.

Regional Outlook

2025 (USD Billion)
2035 (USD Billion)
North Americ
Europe
Asia-Pacific
Middle East
Latin Americ
Region 2025 (USD Billion) 2035 (USD Billion) CAGR (%)
North America $10.0 USD Billion $40.0 USD Billion 9.0%
Europe $17.1 USD Billion $51.1 USD Billion 27.0%
Asia-Pacific $24.2 USD Billion $62.2 USD Billion 25.0%
Middle East & Africa $31.3 USD Billion $73.3 USD Billion 23.0%
Latin America $38.4 USD Billion $84.4 USD Billion 12.0%

Regional data is locked

Unlock complete regional numbers for this market.

Unlock Full Data

Competitive Landscape

Our findings suggest that scale, battery control, and software define competitive positions in the E-Mobility Market.

Dimension Description
Market Structure Moderately concentrated at the top. BYD and Tesla lead battery electric volume, Chinese makers supply 60% of global electric car sales, and legacy groups defend regional positions.
Innovation Focus Fast charging platforms above 800 V, sodium-ion and LFP cells, software-defined vehicles and affordable vehicle architectures.
M&A Activity Partnerships and portfolio resets, including Stellantis with Leapmotor International, a Canadian battery plant stake sale to LG Energy Solution, and the CATL supply agreement with Changan.

How Do Companies Compete in the E-Mobility Market?

Competition rests on price, scale, and speed of product launches. BYD sold about 4.6 million vehicles in 2025 and 3,131,576 in the first nine months of 2026, while exports lifted overseas sales to 1,342,960 units. Leapmotor delivered more than 100,000 vehicles a month from July through September 2026. Chinese automakers supplied 60% of global electric car sales in 2025, and fierce price competition at home pushes them toward exports.

Which Company Archetypes Dominate the E-Mobility Market?

Five archetypes dominate. Vertically integrated battery and vehicle makers such as BYD control cost. Software-led brands including Tesla, XPeng, NIO, Li Auto and Xiaomi differentiate through user experience. Legacy global groups, namely Volkswagen, BMW, Mercedes-Benz, Stellantis, GM, Ford, Hyundai and Renault, bring scale and dealer networks. State-linked Chinese groups, including SAIC, Changan, Chery and Geely, combine volume with export reach. Specialists such as Yadea lead light electric mobility.

How Are Companies Differentiating Through Innovation?

Charging speed has become a headline feature. BYD is rolling out flash charging with its second generation Blade Battery, and Geely has unveiled a faster charging system. Changan and CATL pair sodium-ion cells with cold-weather performance claims. Ford is building a new architecture for a USD 30,000 pickup in 2027. The IEA also highlights software and artificial intelligence as a growing source of vehicle differentiation.

What Is the M&A and Partnership Activity in the E-Mobility Market?

Activity centers on partnerships and portfolio resets rather than large acquisitions. Stellantis works with Leapmotor through Leapmotor International for sales outside China and sold its 49% stake in a Canadian battery plant to LG Energy Solution. Ford ended its battery joint venture with SK On as it cancelled programs. BYD plans local production in Hungary from the fourth quarter of 2026, with plants already operating in Brazil, Indonesia, Thailand, and Uzbekistan.

Key Market Players

NMSC's analysis indicates that the leading participants span Chinese, European, North American, Korean, and Japanese groups.

BYD Company Limited Tesla, Inc. Volkswagen AG Zhejiang Geely Holding Group Co., Ltd. SAIC Motor Corporation Limited BMW AG Mercedes-Benz Group AG Stellantis N.V. Chongqing Changan Automobile Co., Ltd. Chery Automobile Co., Ltd. Li Auto Inc. Xiaomi Corporation Hyundai Motor Company NIO Inc. XPeng Inc. General Motors Company Zhejiang Leapmotor Technology Co., Ltd. Ford Motor Company Renault S.A. Yadea Group Holdings Ltd.

Latest Developments

Our assessment indicates that recent developments cluster around Chinese export growth, policy resets, and battery innovation.

Date Event
October 2026 Tesla reported third-quarter 2026 deliveries of 486,532 vehicles and 13.7 GWh of energy storage deployments.

October 2026 Leapmotor delivered 105,656 vehicles in September 2026, up 59% year on year and a third month above 100,000.
August 2026 India's Ministry of Heavy Industries extended electric two-wheeler incentives under PM E-DRIVE to 31 March 2028 and raised the outlay to approximately USD 1.25 billion.
February 2026 The Changan Nevo A06 debuted with CATL Naxtra cells, marking sodium-ion entry into passenger car production.

Expert Insights

Xavier Dupont

Xavier Dupont

CEO of Valeo Power Division | Valeo

"“For the local market, the biggest growth will be in India… perhaps also in South America, but India, for me, will be the market with the biggest growth in EVs.”"

Analyst Interpretation

The statement highlights India's importance as an emerging growth market for electric mobility. Rising demand for electric two-wheelers, three-wheelers, passenger vehicles, and commercial fleets is creating opportunities across the EV value chain. Market expansion is supported by the need for cost-effective transportation, domestic manufacturing capabilities, and the development of charging infrastructure. These factors position India as an important market for electric vehicle manufacturers, battery suppliers, charging infrastructure providers, and mobility service operators.

Investment Opportunities

Where Are Capital Inflows Concentrating in the E-Mobility Market?

Capital is flowing toward batteries, localized assembly, and affordable platforms. The European Commission proposed a EUR 1.8 billion battery booster, India raised its PM E-DRIVE outlay to INR 11,900 crore, and CATL has invested nearly RMB 10 billion in sodium-ion research. BYD is adding a Hungarian plant. Meanwhile, legacy automakers have written down tens of billions of dollars, which shows capital is being redirected toward programs with proven electric vehicle demand.

How Is Infrastructure Investment Supporting E-Mobility Market Growth?

Public charging provides the base for adoption. The IEA reports that the global public network added about 1.8 million points in 2025, a 33% rise, to exceed seven million. China holds over 65% of the stock, and its fast and ultra-fast points grew from 1.5 million to 2.2 million. India allocates INR 2,000 crore for about 72,300 fast chargers. Investors can find returns in charging operators, grid upgrades, and battery swapping networks.

What ESG Considerations Matter in the E-Mobility Market?

ESG performance depends on energy sources, materials, and end-of-life handling. The IEA estimates that the global EV fleet avoided about 1.7 million barrels of oil use per day in 2025. Concentrated battery supply chains raise security questions, as China produced over 80% of cells. The European Commission also links compliance credits to low-carbon steel made in the Union. Recycling, responsible mineral sourcing and grid decarbonization will shape investor confidence.

Key Benefits for Stakeholders

How Does the E-Mobility Market Report Benefit Enterprise and Industry Leaders?

Enterprise and industry leaders gain a segmented view of USD 960.18 Billion in 2026 revenue and the path to USD 3,402.25 Billion by 2035. The report links vehicle classes, powertrains, and customer types to growth rates, which helps leaders prioritize fleet electrification and procurement timing. Country-level insights show where policy support and charging availability are strongest, so planners can sequence market entry and localize product plans with greater confidence.

How Does the Report Help Investors and Financial Analysts?

Investors and financial analysts can compare growth pools, such as Freight and Logistics at 20.6% CAGR and Sodium Ion at 35.3% CAGR. Revenue is set to rise by about USD 2,442.07 Billion from 2026 to 2035, and our risk matrix separates policy-driven restraints from structural drivers. Company profiles and developments help assess balance sheet resilience after recent EV-related charges at major automakers.

How Does the Report Support Technology Vendors and Product Teams?

Technology vendors and product teams can map demand for higher voltage platforms, new battery chemistries, and software features against segment growth. The analysis shows Above 800 V growing at 34.3% CAGR and LFP gaining share within lithium-ion cells. Regional chapters explain where charging speeds, regulation and buyer preferences differ, which supports product roadmaps, partner selection, and pricing decisions across emerging and mature markets.

Key Market Segments Evaluated

By Vehicles and Devices

  • Sedans and Hatchbacks
  • SUVs and Crossovers
  • MPVs and Minivans
  • Other Passenger Cars
  • LCV
  • MHCV
  • Buses and Coaches
  • Electric Motorcycles
  • Electric Mopeds
  • Seated Electric Scooters
  • Electric Bicycles
  • Passenger Three-wheelers
  • Cargo Three-wheelers
  • Agricultural EV
  • Construction EV
  • Mining EV
  • Industrial Transport EV
  • Other Off-Highway EV
  • Electric Kick Scooters
  • Electric Skateboards and Personal Boards
  • Self-Balancing Devices
  • Powered Wheelchairs
  • Accessibility Mobility Scooters
  • Other Qualifying Mobility Devices

By Traction Battery Chemistry

  • LFP
  • NMC
  • NCA
  • Other Li-Ion Chemistries

By End Use Application

  • Taxi and Ride-Hailing
  • Car Rental and Shared Mobility
  • Other Commercial Passenger Services
  • Last-Mile Delivery
  • Regional and Long-Haul Freight
  • Other Freight and Logistics
  • Agriculture
  • Construction and Mining
  • Industrial Site Transport
  • Mobility Service Operators
  • Freight and Logistics Operators
  • Other Corporate and Industrial Buyers

By Region

  • North America 
    • U.S.
    • Canada
    • Mexico
  • Europe 
    • UK
    • Germany
    • France
    • Italy
    • Spain
    • Sweden
    • Denmark
    • Finland
    • Netherlands
    • Rest of Europe
  • Asia-Pacific 
    • China
    • India
    • Japan
    • South Korea
    • Taiwan
    • Indonesia
    • Vietnam
    • Australia
    • Philippines
    • Malaysia
    • Rest of APAC
  • Middle East & Africa 
    • Saudi Arabia
    • UAE
    • Egypt
    • Israel
    • Turkey
    • Nigeria
    • South Africa
    • Rest of MEA
  • Latin America 
    • Brazil
    • Argentina
    • Chile
    • Colombia
    • Rest of LATAM

Conclusion & Recommendations

The outlook is positive despite near-term policy noise. The E-Mobility Market is forecast to reach USD 3,402.25 Billion by 2035 from USD 960.18 Billion in 2026. The IEA projects that the global EV fleet, excluding two and three-wheelers, could reach as high as 510 million by 2035 from nearly 80 million today. Growth will be broad-based, with Asia-Pacific retaining scale while Latin America and the Middle East & Africa gain share.

What Strategic Positioning Recommendations Does NMSC Offer?

Automakers should prioritize affordable platforms, higher voltage charging, and flexible powertrain portfolios that include battery electric and extended range options. Suppliers should secure diversified cell sources across LFP and sodium-ion chemistries. Operators should target commercial fleets, where Freight and logistics grow at a 20.6% CAGR. Western makers should partner on cost and technology, while Chinese makers should localize production to manage tariffs and trade barriers.


What Is the Investment Attractiveness of the E-Mobility Market?

Investment attractiveness is high but selective. Commercial fleets, charging networks, and battery supply chains offer the strongest returns, because demand there rests on operating cost savings rather than subsidies. Returns look best where policy is stable and charging is available, such as China, Europe, and India. Investors should weigh the slower profile of Electric Personal Mobility Devices at 10.0% CAGR and the volatility created by incentive changes.

What Are the Market Shifts and Key Risks in the E-Mobility Market?

Key shifts include rising Chinese exports, the move from private to fleet demand, and a pivot by Western automakers toward hybrids and cheaper platforms. Key risks include incentive withdrawal, shown by the 8% fall in global electric car sales in the first quarter of 2026. Tariff barriers, concentrated battery supply, and the proposed easing of the EU 2035 target add pressure. Charging gaps in emerging regions could also slow adoption.

What Are the Growth Pathways Through 2035?

Primary growth pathways include fleet and freight electrification, emerging market adoption in Southeast Asia, Latin America and Africa, and the rollout of 800 V platforms with faster charging. Sodium-ion cells offer a lower-cost pathway, while energy services add value beyond the vehicle. Companies that combine scale, local production, and software will capture the largest share of the USD 3,402.25 Billion market in 2035.

FAQs

Sources & References

1.

International Energy Agency, Global EV Outlook 2026

iea.org
2.

International Energy Agency, Global EV Outlook 2026 press release (20 May 2026)

iea.org
3.

International Energy Agency, Global EV Outlook 2026, Trends in electric cars

iea.org
4.

International Energy Agency, Global EV Outlook 2026, Executive summary

iea.org
5.

European Commission, CO2 standards for cars and vans (Automotive Package)

climate.ec.europa.eu
6.

Tesla, Inc., Form 8-K, Third Quarter 2026 Production, Deliveries and Deployments (SEC)

sec.gov
7.

Ministry of Heavy Industries, Government of India (PM E-DRIVE)

heavyindustries.gov.in
8.

China Association of Automobile Manufacturers (CAAM)

caam.org.cn
9.

BYD Company Limited, investor and sales disclosures

bydglobal.com
10.

Contemporary Amperex Technology Co., Limited (CATL)

catl.com
11.

Hong Kong Exchanges and Clearing, HKEXnews (BYD, Leapmotor, NIO, XPeng, Li Auto disclosures)

hkexnews.hk
12.

Stellantis N.V., corporate and investor relations

stellantis.com
13.

Ford Motor Company, corporate and investor relations

corporate.ford.com
14.

General Motors Company, investor relations

investor.gm.com
15.

U.S. Internal Revenue Service, clean vehicle credits

irs.gov

About the Author

Mayurima Roy

Mayurima Roy

Mayurima Roy is Research Analyst at Next Move Strategy Consulting, where she has spent 4 years working across the firm's full industry coverage rather than a single fixed vertical. Her work centers on structured research, ongoing trend tracking, competitive assessment, and insight-led content development, translating complex market data into clear, decision-ready narratives that support informed client decision-making across diverse global industries, market sectors, and world regions every day.

About the Reviewer

Supradip Baul

Supradip Baul

Supradip Baul is an accomplished business consultant and strategist with over a decade of rich experience in market intelligence, strategy, technology, and business transformation. His work has included rigorous qualitative and quantitative analysis across multiple industries, helping clients shape investment decisions and long-term roadmaps. Earlier in his career, he was associated with Gartner, where he contributed to industry-leading reports and market share analyses. He has worked with leading global companies and holds an MBA with a dual specialization in Marketing and Finance.

Mohit Agarwal

MOHIT AGARWAL

Chief Manager

DryChem India Pvt. Ltd.

Next Move Strategy Consulting is an amazing team of consultants. We required a market study report for our investors on top priority and the team went above and beyond our expectations to deliver the same with ample supporting data within a short time span enabling us to secure the investments and keep our project timeline maintained. Their professionalism, attention to detail, and timely delivery of actionable recommendations have left a lasting impression on our organization.

Nishant Awate

NISHANT AWATE

Business Development Global Sales

Zehnder Group Deutschland GmbH

Our experience working with Next Move Strategy Consulting was positive. The team was responsive, professional, and open to incorporating our specific requirements throughout the project. The India AHU market study was comprehensive and well structured, covering market value and volume forecasts, product and application segments, and key industry trends. The inclusion of both AHU and residential MVHR market insights made the study particularly relevant for our strategic market assessment. Overall, the report provides a solid foundation for evaluating market potential, identifying priority segments, and supporting business-development decisions in India.

Amos Chang

AMOS CHANG

Strategy Consultant

Kardex Group

I have bought the intralogistics market reports from NMSC two times so far. Joseph and his team are always very helpful and flexible in responding to any customization requirements on the report. Their expertise in market reports really helps us steer the day-to-day business. I will definitely recommend and come back myself whenever there is a need.

Semih Kavaklioglu

SEMIH KAVAKLIOGLU

Co-Founder & Sales Manager

Decortie

I work a lot in the marketing industry and I know that research is an essential part of any campaign. I have used Market research reports for my own products and I found them to be very informative and well-researched. The team here produces insightful reports for a good price

Gaurav Jaiswal

GAURAV JAISWAL

Founder & CEO

Yano Charge Private Limited

The EV Charging market research report provided by the NextMSC was exceptionally detailed and insightful. It offered a comprehensive analysis that proved to be a game-changer for our strategic planning. Truly a testament to the NextMSC’s expertise and thoroughness in EV market landscape & analysis.

Custom Market Research Services

We will customize the research for you if the listed report does not fully match your requirements.

Get 30% Free Customization

Select License

This website uses cookies to ensure you get the best experience on our website. Learn more

✖