Optics Market Global Industry Analysis and Forecast (2026–2035)

The optics market size was USD 65.90 billion in 2025 and is projected to reach USD 128.66 billion by 2035, growing at a CAGR of 6.57% from 2026 to 2035. Key drivers include AI data center fiber buildout, growing semiconductor lithography and inspection demand, and rising vision care and infrared sensing adoption, with Asia-Pacific leading the market.

Download Free Sample PDF
Base Year (2025)
$65.90 Billion
Forecast (2035)
$128.66 Billion
CAGR (2026-2035)
6.6%
Top Region
Asia-Pacific

What Is the Optics Market Size?

The global Optics Market reached USD 65.90 Billion in 2025 and is estimated at USD 72.56 Billion in 2026, forecast to reach USD 128.66 Billion by 2035 at a CAGR of 6.57% between 2026 and 2035. Asia-Pacific leads with approximately 39% revenue share in 2025, while Optical Elements is the dominant offering, holding approximately 58% of total market revenue.

Our analysis shows that the market is led by Optical Elements and Visible spectrum products, while fiber and infrared categories deliver the fastest expansion through 2035.

Optics Market Global Industry Analysis and Forecast (2026–2035) Revenue Forecast

Values in USD Billion

2025 $65.90 Billion
2025
2026 $72.56 Billion
2026
2027 $77.33 Billion
2027
2028 $82.41 Billion
2028
2029 $87.82 Billion
2029
2030 $93.59 Billion
2030
2031 $99.74 Billion
2031
2032 $106.29 Billion
2032
2033 $113.28 Billion
2033
2034 $120.72 Billion
2034
2035 $128.66 Billion
2035

Key Takeaways

By Offering: Optical Elements held the largest share, expanding from USD 38.22 Billion in 2025 to USD 69.48 Billion by 2035; Passive Fiber Optics is the fastest growing at 8.44% CAGR from 2026–2035.

By Material: Glass held the largest share, expanding from USD 23.72 Billion in 2025 to USD 39.88 Billion by 2035; Chalcogenide Materials is the fastest growing at 9.26% CAGR from 2026–2035.

By Spectral Type: Visible held the largest share, expanding from USD 34.27 Billion in 2025 to USD 57.90 Billion by 2035; Short Wave Infrared is the fastest growing at 9.82% CAGR from 2026–2035.

By Customer Type: Original Equipment Manufacturers held the largest share, expanding from USD 25.04 Billion in 2025 to USD 47.60 Billion by 2035; Government and Defense Organizations is the fastest growing at 7.87% CAGR from 2026–2035.

By Sales Channel: Direct Sales held the largest share, expanding from USD 27.68 Billion in 2025 to USD 50.18 Billion by 2035; E-commerce Sales is the fastest growing at 10.95% CAGR from 2026–2035.

By End-Use Industry: Semiconductor held the largest share, expanding from USD 9.23 Billion in 2025 to USD 19.94 Billion by 2035; Data Centers is the fastest growing at 10.72% CAGR from 2026–2035.

Dominant Region: Asia-Pacific dominated the global market with approximately 39.0% revenue share (USD 25.70 Billion) in 2025, anchored by established lens, optical fiber, and semiconductor manufacturing ecosystems.

Fastest-Growing Region: Middle East & Africa is expected to register the highest CAGR of 7.68% during 2026–2035, driven by Gulf data center, defense and telecom investment.

Dominant Country: The U.S. led the market with an estimated USD 14.50 Billion in 2025, supported by hyperscale data centers and defense programs.

Fastest-Growing Country: India is projected to expand from USD 1.41 Billion in 2025 at a CAGR of 11.43%, driven by telecom, electronics and defense localization.

Market Opportunity: The Optics Market offers an absolute dollar opportunity of approximately USD 56.10 Billion between 2026 and 2035, calculated as the difference between the 2035 forecast of USD 128.66 Billion and the 2026 base of USD 72.56 Billion. Optical Elements represents the largest absolute revenue opportunity, while Passive Fiber Optics is the fastest-growing top-level offering, expanding at an 8.44% CAGR from 2026 to 2035.

According to our market analysis, we identified a structural transition from discrete components toward integrated fiber and assembly formats. This shift is driven by AI data centers, lithography equipment, and defense sensors transitioning to pre-tested subsystems rather than individual optical elements.

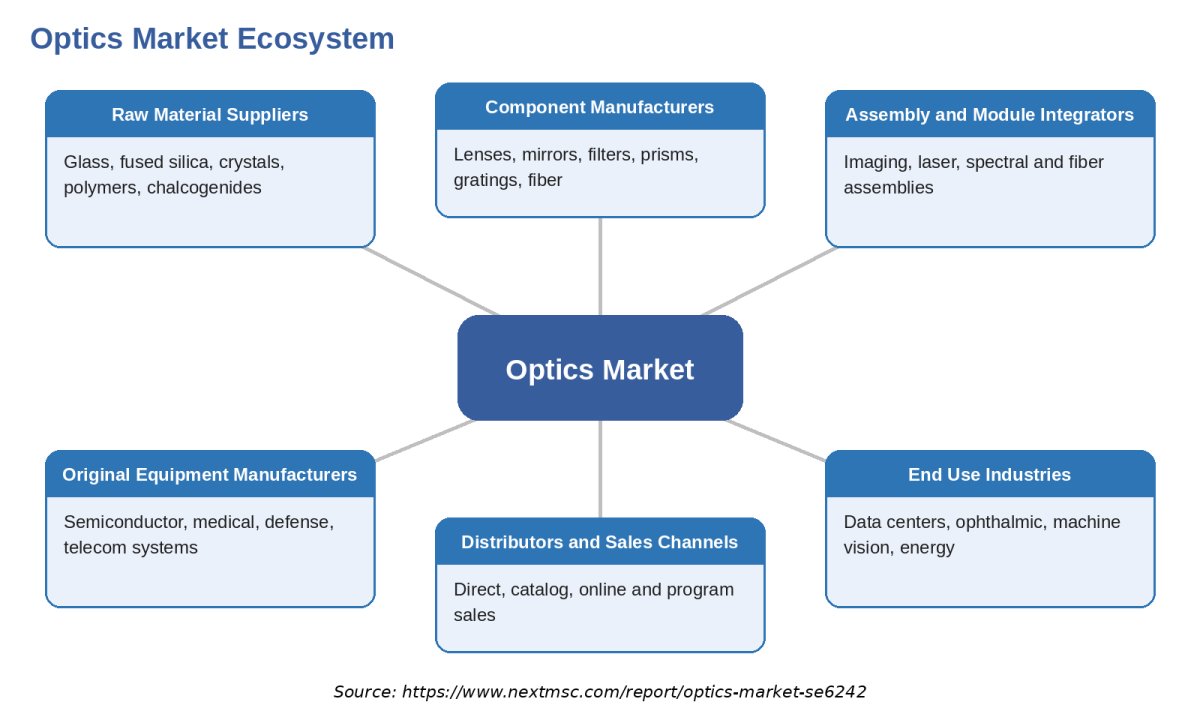
Ecosystem Analysis of the Optics Industry

The above infographic presents the Optics Market ecosystem in a simpler format, focusing on six core stakeholder groups: raw material suppliers, component manufacturers, assembly and module integrators, original equipment manufacturers, distributors, and end use industries. It shows how these participants convert glass, crystal and polymer inputs into precision optical products while contributing to quality, yield, qualification and innovation across imaging, laser, fiber and spectral systems.

What does the Optics Market Encompass?

The Optics Market covers passive optical elements, passive fiber optics, optical assemblies and other passive optical modules that guide, shape, filter, split, polarize or transmit light across ultraviolet to long wave infrared wavelengths. It includes lenses, mirrors, filters, prisms, beamsplitters, gratings, polarization optics, windows, optical fiber, fiber components and fiber assemblies. The market excludes active photonic devices such as lasers, detectors and transceivers, capturing only the passive optical layer that sits inside and around them.
The regulatory and technical environment is shaped by optical surface and drawing standards, laser safety rules, medical device regulation for ophthalmic lenses, and export controls on critical materials such as germanium. Technology adoption is moving toward aspheric and freeform surfaces, advanced finishing, multicore fiber and diffractive structures, which raise performance per element and expand design freedom for system builders across imaging, sensing and communication platforms.

Market Drivers & Dynamics

Interactive Dataset
AI data center fiber and connector buildout driver +1.20% North America, Asia-Pacific 2026–2032
Semiconductor lithography and inspection optics driver +0.90% Asia-Pacific, Europe 2026–2035
Vision care demand and myopia control lenses driver +0.60% Asia-Pacific, Global 2026–2035
Defense electro optical and laser programs driver +0.50% North America, Europe, Middle East 2026–2033
Machine vision and factory automation driver +0.40% Asia-Pacific, Europe 2026–2034
Germanium and critical material supply controls restraint −0.70% Global 2026–2029
Precision finishing cost and low yields restraint −0.50% Global 2026–2030
Soft consumer electronics lens demand restraint −0.30% Asia-Pacific 2026–2028
Source: Next Move Strategy Consulting

Growth Drivers

What Is the Primary Growth Driver in the Optics Market?

AI infrastructure spending is the primary structural driver, because every additional accelerator cluster multiplies the number of fiber links, connectors, isolators and lens arrays needed to move data. Lumentum reported fiscal 2026 revenue of USD 3.01 Billion, up 83.2%, with fourth quarter revenue up 109.3%, and Corning committed new North Carolina cable capacity. These signals show that passive optical content scales with active transceiver volume, which supports the 10.72% CAGR we estimate for the Data Centers end use industry.

How Is Semiconductor and Vision Care Demand Driving Market Growth?

Based on industry market observations, global semiconductor equipment spending is forecast to reach USD 165.9 Billion in 2026 (a 23.2% year-over-year increase), directly expanding demand for high-precision lithography and inspection optics. In vision care, at least 2.2 billion people live with vision impairment and 826 million have unaddressed presbyopia, so prescription and myopia control lenses keep a stable volume base. Together these two demand pools anchor Semiconductor at 7.44% CAGR and underpin Ophthalmic revenue of USD 6.59 Billion in 2025, giving the market a balance of cyclical and less cyclical demand.

Growth Inhibitors

What Is Restraining the Optics Market?

Critical material exposure is the main restraint. The United States reported net import reliance above 50% for germanium in 2025, while the annual average price reached USD 4,100 per kilogram, more than double the 2024 level. Although China suspended its U.S.-specific germanium export prohibition through November 27, 2026, broader export-licensing requirements remain in place. Precision finishing also depends on skilled labor and processes with low yields for aspheric and freeform surfaces, keeping manufacturing costs high. Our assessment indicates that material exposure and production costs can constrain infrared optics margins and slow adoption in price-sensitive consumer applications.

What Are the Growth Opportunities?

Can Multicore and High-Density Fiber Capture AI Network Spending?

Multicore fibre, micro cables with 1,728 fibres, and detachable fibre-to-chip connectors let operators raise capacity without new duct space. Suppliers that qualify these formats early can secure multiyear programs with hyperscalers and equipment makers. The main beneficiary is Fiber Assemblies, growing at 9.55% CAGR from 2026 to 2035, with Fiber Components close behind at 9.30%, as data centre infrastructure operators standardize on denser, lower loss interconnects.

Can Chalcogenide and Alternative Infrared Materials Close the Germanium Gap?

Thermal imaging for vehicles, buildings, industrial inspection and security needs affordable long wave lenses that do not depend on germanium. Chalcogenide glass, molded silicon and zinc sulfide variants allow volume production at lower material risk. Chalcogenide Materials is the clear beneficiary at 9.26% CAGR from 2026 to 2035, while Long Wave Infrared optics grow at 8.97%, rewarding suppliers that offer qualified, drop in substitutes with stable pricing.

Can Defense and Directed Energy Programs Create a Premium Optics Niche?

Directed energy, targeting and surveillance programs require large aperture mirrors, high damage threshold coatings and precision beam handling that few suppliers can certify. Government contracts typically run for several years and carry higher margins than catalog sales. Government and Defense Organizations lead customer growth at 7.87% CAGR from 2026 to 2035, and Program Sales expand at 8.16%, favoring vendors with security cleared facilities and proven laser optics assemblies.

Segmentation Analysis

2025 (USD Billion)
2035 (USD Billion)
Optical Elements 2025: $38.22 Billion | 2035: $69.48 Billion
Optical Elem
Passive Fiber Optics 2025: $15.82 Billion | 2035: $37.31 Billion
Passive Fibe
Optical Assemblies 2025: $8.57 Billion | 2035: $16.08 Billion
Optical Asse
Other Passive Optics 2025: $3.29 Billion | 2035: $5.79 Billion
Other Passiv
Optical Elements $38.22 Billion $69.48 Billion 5.83%
Passive Fiber Optics $15.82 Billion $37.31 Billion 8.44%
Optical Assemblies $8.57 Billion $16.08 Billion 6.11%
Other Passive Optics $3.29 Billion $5.79 Billion 6.06%

Which Offering Segment Leads the Optics Market?

Optical Elements dominates with USD 38.22 Billion in 2025, rising to USD 69.48 Billion by 2035, because lenses alone account for USD 20.64 Billion and serve imaging, ophthalmic, semiconductor and laser systems. Passive Fiber Optics is the fastest growing offering at 8.44% CAGR from 2026 to 2035, led by Fiber Assemblies at 9.55% and Fiber Components at 9.30% as data center links densify. Optical Elements itself grows more slowly at 5.83%, which reflects maturing glass lens volumes.

2025 (USD Billion)
2035 (USD Billion)
Glass
Fused Silica
Crystalline
Semiconducto
Optical Cera
Segment Item 2025 (USD Billion) 2035 (USD Billion) CAGR
Glass $10.0 USD Billion $40.0 USD Billion 25.0%
Fused Silica $17.1 USD Billion $51.1 USD Billion 11.0%
Crystalline Materials $24.2 USD Billion $62.2 USD Billion 25.0%
Semiconductor Materials $31.3 USD Billion $73.3 USD Billion 11.0%
Optical Ceramics $38.4 USD Billion $84.4 USD Billion 16.0%

Segment-wise data is locked

Unlock complete segment-wise numbers for By Material.

Unlock Full Data
2025 (USD Billion)
2035 (USD Billion)
Ultraviolet
Visible
Near Infrare
Short Wave I
Mid Wave Inf
Segment Item 2025 (USD Billion) 2035 (USD Billion) CAGR
Ultraviolet $10.0 USD Billion $40.0 USD Billion 27.0%
Visible $17.1 USD Billion $51.1 USD Billion 9.0%
Near Infrared $24.2 USD Billion $62.2 USD Billion 19.0%
Short Wave Infrared $31.3 USD Billion $73.3 USD Billion 17.0%
Mid Wave Infrared $38.4 USD Billion $84.4 USD Billion 18.0%

Segment-wise data is locked

Unlock complete segment-wise numbers for By Spectral Type.

Unlock Full Data
2025 (USD Billion)
2035 (USD Billion)
Original Equ
System Integ
Industrial D
Research Ins
Government a
Segment Item 2025 (USD Billion) 2035 (USD Billion) CAGR
Original Equipment Manufacturers $10.0 USD Billion $40.0 USD Billion 14.0%
System Integrators $17.1 USD Billion $51.1 USD Billion 24.0%
Industrial Distributors $24.2 USD Billion $62.2 USD Billion 22.0%
Research Institutions $31.3 USD Billion $73.3 USD Billion 12.0%
Government and Defense Organizations $38.4 USD Billion $84.4 USD Billion 27.0%

Segment-wise data is locked

Unlock complete segment-wise numbers for By Customer Type.

Unlock Full Data
2025 (USD Billion)
2035 (USD Billion)
Direct Sales
Distributor
E-commerce S
Representati
Program Sale
Segment Item 2025 (USD Billion) 2035 (USD Billion) CAGR
Direct Sales $10.0 USD Billion $40.0 USD Billion 24.0%
Distributor Sales $17.1 USD Billion $51.1 USD Billion 22.0%
E-commerce Sales $24.2 USD Billion $62.2 USD Billion 20.0%
Representative Sales $31.3 USD Billion $73.3 USD Billion 22.0%
Program Sales $38.4 USD Billion $84.4 USD Billion 13.0%

Segment-wise data is locked

Unlock complete segment-wise numbers for By Sales Channel.

Unlock Full Data
2025 (USD Billion)
2035 (USD Billion)
Semiconducto
Industrial M
Medical and
Aerospace an
Automotive
Segment Item 2025 (USD Billion) 2035 (USD Billion) CAGR
Semiconductor $10.0 USD Billion $40.0 USD Billion 23.0%
Industrial Manufacturing $17.1 USD Billion $51.1 USD Billion 9.0%
Medical and Life Sciences $24.2 USD Billion $62.2 USD Billion 19.0%
Aerospace and Defense $31.3 USD Billion $73.3 USD Billion 13.0%
Automotive $38.4 USD Billion $84.4 USD Billion 10.0%

Segment-wise data is locked

Unlock complete segment-wise numbers for By End-Use Industry.

Unlock Full Data
2025 (USD Billion)
2035 (USD Billion)
North Americ
Europe
Asia-Pacific
Middle East
Latin Americ
Segment Item 2025 (USD Billion) 2035 (USD Billion) CAGR
North America $10.0 USD Billion $40.0 USD Billion 21.0%
Europe $17.1 USD Billion $51.1 USD Billion 23.0%
Asia-Pacific $24.2 USD Billion $62.2 USD Billion 25.0%
Middle East & Africa $31.3 USD Billion $73.3 USD Billion 15.0%
Latin America $38.4 USD Billion $84.4 USD Billion 16.0%

Segment-wise data is locked

Unlock complete segment-wise numbers for By Region.

Unlock Full Data

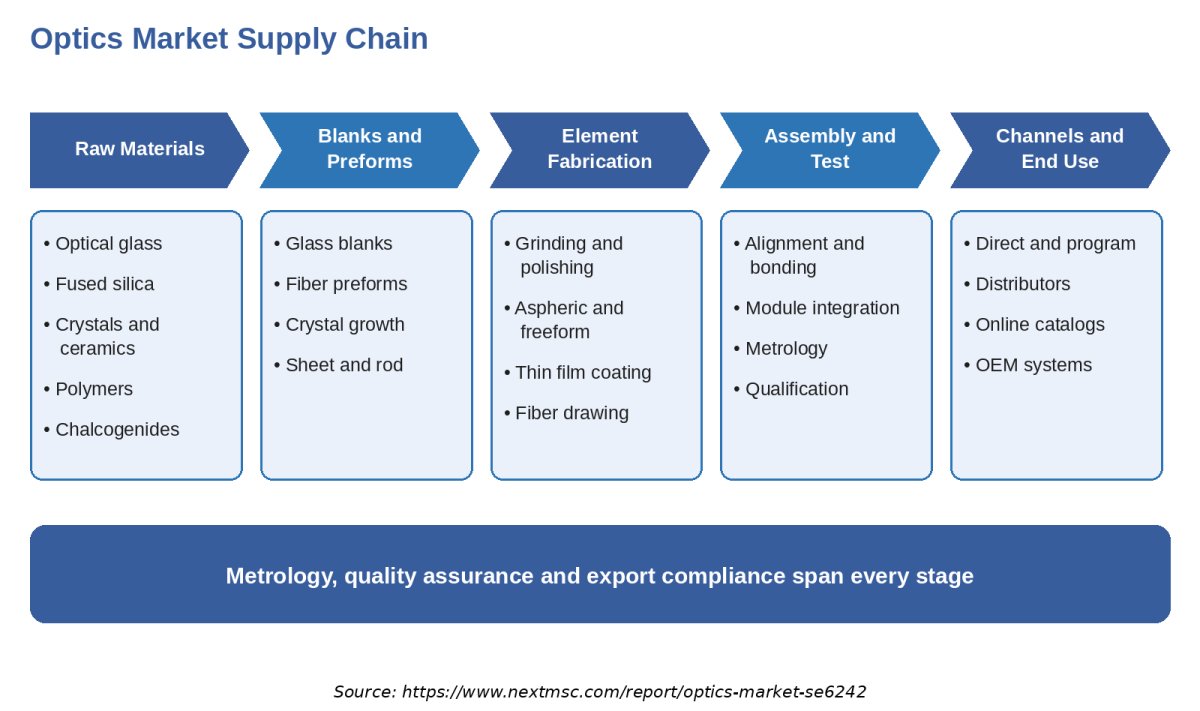
Supply Chain Analysis of the Optics Industry

Supply Chain Analysis of the Optics Industry
The above infographic maps the Optics Market supply chain across raw material suppliers, blank and preform producers, element fabricators and coaters, assembly and module integrators, and end users, with distributors and metrology providers supporting each stage. It highlights where value concentrates in precision finishing, coating and testing, and where concentration risk in germanium and specialty crystals affects continuity of supply.

Growth Opportunities

Our analysis shows that three whitespace opportunities are positioned to generate disproportionate returns for suppliers over the forecast period.

Can Multicore and High-Density Fiber Capture AI Network Spending?

Multicore fibre, micro cables with 1,728 fibres, and detachable fibre-to-chip connectors let operators raise capacity without new duct space. Suppliers that qualify these formats early can secure multiyear programs with hyperscalers and equipment makers. The main beneficiary is Fiber Assemblies, growing at 9.55% CAGR from 2026 to 2035, with Fiber Components close behind at 9.30%, as data centre infrastructure operators standardize on denser, lower loss interconnects.

Can Chalcogenide and Alternative Infrared Materials Close the Germanium Gap?

Thermal imaging for vehicles, buildings, industrial inspection and security needs affordable long wave lenses that do not depend on germanium. Chalcogenide glass, molded silicon and zinc sulfide variants allow volume production at lower material risk. Chalcogenide Materials is the clear beneficiary at 9.26% CAGR from 2026 to 2035, while Long Wave Infrared optics grow at 8.97%, rewarding suppliers that offer qualified, drop in substitutes with stable pricing.

Can Defense and Directed Energy Programs Create a Premium Optics Niche?

Directed energy, targeting and surveillance programs require large aperture mirrors, high damage threshold coatings and precision beam handling that few suppliers can certify. Government contracts typically run for several years and carry higher margins than catalog sales. Government and Defense Organizations lead customer growth at 7.87% CAGR from 2026 to 2035, and Program Sales expand at 8.16%, favoring vendors with security cleared facilities and proven laser optics assemblies.

Regional Outlook

2025 (USD Billion)
2035 (USD Billion)
North Americ
Europe
Asia-Pacific
Middle East
Latin Americ
Region 2025 (USD Billion) 2035 (USD Billion) CAGR (%)
North America $10.0 USD Billion $40.0 USD Billion 9.0%
Europe $17.1 USD Billion $51.1 USD Billion 27.0%
Asia-Pacific $24.2 USD Billion $62.2 USD Billion 25.0%
Middle East & Africa $31.3 USD Billion $73.3 USD Billion 23.0%
Latin America $38.4 USD Billion $84.4 USD Billion 12.0%

Regional data is locked

Unlock complete regional numbers for this market.

Unlock Full Data

Competitive Landscape

Our assessment indicates that the Optics Market industry comprises diversified conglomerates, specialist component makers and vision care leaders that compete across very different product and customer layers.

Dimension Description
Market Structure Moderately fragmented: a handful of global groups lead in lenses, glass, fiber and lithography optics, while many specialists serve niche catalog and custom demand.
Innovation Focus Aspheric and freeform surfaces, multicore fiber, copackaged optics connectivity, chalcogenide and silicon infrared materials, and integrated tested assemblies.
M&A Activity Selective, capability-driven acquisitions and partnerships. EssilorLuxottica completed its acquisition of PUcore's ophthalmic lens-material assets in November 2025, while Corning's multiyear agreement with Meta supports optical-fiber, cable and connectivity capacity for AI data centers.

How Do Companies Compete in the Optics Market?

Companies compete on surface accuracy, coating performance, material access, lead time and qualification track record rather than list price alone. Large groups use scale in glass melting, fiber drawing and ophthalmic lens networks, while specialists win with custom design and fast prototyping. Distributors and online catalogs have widened access for small buyers, which pressures margins on standard elements. Our analysis shows that long qualification cycles at semiconductor and medical customers favor incumbents.

Which Competitive Archetypes Dominate the Optics Market?

Three archetypes dominate. Integrated materials groups such as Corning, SCHOTT, AGC and OHARA control glass and fiber scale. Precision system leaders such as Carl Zeiss, Nikon, Canon, JENOPTIK, HOYA and EssilorLuxottica differentiate through metrology, brand strength and vision care reach. Specialists such as Thorlabs, Edmund Optics, Excelitas, Gooch & Housego, Meopta and LightPath compete on breadth, speed and application engineering, while Coherent, Lumentum, MKS Instruments and Hamamatsu bundle passive optics with active devices.

What Innovation and Differentiation Strategies Are Companies Pursuing?

We observed that leading suppliers are investing in multicore fiber, detachable fiber to chip connectors, freeform surfaces, diffractive structures and advanced coatings that cut loss and element count. Capacity is expanding in parallel, with ZEISS SMT adding production and cleanroom space across Oberkochen, Wetzlar and Roßdorf. Differentiation is shifting from individual parts toward qualified subsystems with metrology data, which helps vendors defend pricing against lower cost entrants in the Optics Market.

What M&A and Partnership Activity Is Shaping the Market?

Our findings suggest that activity centers on targeted acquisitions and strategic capacity partnerships rather than broad-based consolidation. EssilorLuxottica completed its acquisition of PUcore's assets and entities dedicated to developing, manufacturing and selling monomers for high-index ophthalmic lenses on November 4, 2025. Separately, Corning and Meta announced a multiyear agreement worth up to USD 6 billion in January 2026 for optical fiber, cable and connectivity solutions to support AI data center expansion. These developments illustrate investment in upstream material capabilities and contracted supply capacity.

Key Market Players

Based on research conducted by NMSC, the following 20 companies represent the leadership set across passive optical elements, fiber optics, assemblies and specialty modules within this market.

EssilorLuxottica SA Corning Incorporated Carl Zeiss AG Coherent Corp. HOYA Corporation Hamamatsu Photonics K.K. MKS Instruments, Inc. Nikon Corporation Canon Inc. SCHOTT AG AGC Inc. Lumentum Holdings Inc. JENOPTIK AG Thorlabs, Inc. Edmund Optics, Inc. Excelitas Technologies Corp. Meopta s.r.o. Gooch & Housego PLC OHARA INC. LightPath Technologies, Inc.

Latest Developments

During our market evaluation, we noticed that 2025–2026 developments cluster around fiber capacity for AI data centers, lithography optics expansion and vision care supply chain integration.

Date Event
July 2026 ZEISS Semiconductor Manufacturing Technology outlined capacity expansion initiatives, including approximately 25,000 square meters of additional production and related space in Oberkochen, a new multifunctional factory under construction in Wetzlar, and expanded customer collaboration capabilities through its Semiconductor Innovation Center in Yongin, South Korea.
March 2026 Corning announced new optical connectivity technologies ahead of OFC 2026, including a multicore-fiber solution, Contour Flow micro cable supporting 1,728 fibers, a new 32-fiber MMC connector option, and co-packaged optics demonstrations designed to increase AI data center network density and scalability.
January 2026 Corning and Meta announced a multiyear agreement worth up to USD 6 billion for optical fiber, cable, and connectivity solutions to support AI data center expansion. The agreement includes a new optical cable manufacturing facility in Hickory, North Carolina, and expanded production capacity across Corning’s North Carolina operations.

Expert Insights

Gilad Shainer

Senior Vice President, Networking | NVIDIA

"With AI transforming every industry, the demand for high-performance, energy-efficient optical interconnects is growing rapidly."

Analyst Interpretation

The statement highlights the growing importance of optical interconnects in addressing the increasing bandwidth and energy-efficiency requirements of AI infrastructure. As hyperscale data centers expand and AI workloads require faster communication between processors, conventional electrical interconnects face growing performance and power-consumption constraints. Consequently, technologies such as co-packaged optics, silicon photonics, and high-speed optical transceivers are gaining importance. These advancements are creating opportunities for optical component manufacturers and photonics technology providers to develop high-bandwidth, energy-efficient connectivity solutions for next-generation data centers.

Investment Opportunities

Where Are Capital Inflows Concentrating in the Optics Market?

Capital is concentrating in fiber capacity, lithography optics and vision care materials. Corning's multiyear agreement with Meta of up to USD 6 Billion, EssilorLuxottica's completed November 2025 acquisition of PUcore's ophthalmic lens-material assets and ZEISS SMT's multisite expansion illustrate the pattern. Investors should favor suppliers with long term customer commitments, secured material access and assembly capability, since these attributes convert capacity into predictable revenue across the 2026–2035 forecast period.

How Is Infrastructure Investment Shaping Market Capacity?

Infrastructure spending is shifting toward cleanrooms, precision finishing and coating lines, and regional production close to customers. ZEISS SMT is adding about 25,000 square meters in Oberkochen and building a factory in Wetzlar, while Corning plans a Hickory cable facility. These projects take several years to commission, so capacity tightness in high precision elements and dense fiber cable may persist into the late 2020s, which supports pricing for incumbents.

What ESG Considerations Are Influencing Market Investment?

Environmental, Social and Governance priorities center on critical material sourcing, energy use in glass melting and polishing, and product lightness. Germanium controls make recycling and substitution commercially important, while Corning states that its multicore fiber solution can cut cable mass by up to 70%. Social factors include vision care access, since at least 1 billion people have preventable or unaddressed vision impairment. Governance focuses on export compliance and traceable supply chains.

Key Benefits for Stakeholders

How Does This Report Benefit Industry Leaders and Optical Component Manufacturers?

Manufacturers, assembly integrators and OEM sourcing managers gain segment level forecasts across offering, material and spectral type, helping them prioritize capacity toward Passive Fiber Optics at 8.44% CAGR and Short Wave Infrared at 9.82%. Regional and country insights show where to place production and distribution, with Asia-Pacific at USD 25.70 Billion in 2025, and the competitive assessment clarifies where qualification barriers protect margins.

How Does This Report Benefit Investors and Financial Analysts?

Investors and financial analysts gain a reconciled model that grows from USD 65.90 Billion in 2025 to USD 128.66 Billion by 2035, with a CAGR of 6.57% from 2026 to 2035 and a USD 56.10 Billion absolute opportunity. Customer type and sales channel analysis highlights faster pockets such as Government and Defense Organizations at 7.87% and E-commerce Sales at 10.95%, supporting selective allocation and valuation work.

How Does This Report Benefit Technology Vendors and Product Teams?

Product teams gain visibility into which materials, wavelengths and formats attract demand, notably Chalcogenide Materials at 9.26% and Fiber Assemblies at 9.55%. The report links applications such as data centers, machine vision and ophthalmic care to specific offerings, helping vendors time launches, choose qualification targets and decide between catalog, custom and program channels. Competitive and development coverage supports partnership screening.

Key Market Segments Evaluated

By Offering

  • Optical Elements 
    • Lenses
      • Spherical Lenses
      • Aspherical Lenses
      • Cylindrical Lenses
      • Achromatic Lenses
      • Apochromatic Lenses
      • Gradient Index Lenses
      • Microlenses
      • Fresnel Lenses
      • Infrared Lenses
      • Ophthalmic Lenses
      • Specialty Lenses
    • Mirrors
      • Plane Mirrors
      • Spherical Mirrors
      • Parabolic Mirrors
      • Off Axis Mirrors
      • Freeform Mirrors
      • Retroreflective Mirrors
    • Optical Filters
      • Absorptive Filters
      • Interference Filters
      • Neutral Density Filters
      • Dichroic Filters
      • Color Filters
    • Prisms
      • Deviation Prisms
      • Dispersion Prisms
      • Reflective Prisms
      • Retroreflector Prisms
      • Anamorphic Prisms
    • Beamsplitters
      • Non Polarizing Beamsplitters
      • Polarizing Beamsplitters
      • Beam Samplers
    • Gratings and Diffractive Optics
      • Ruled Gratings
      • Holographic Gratings
      • Echelle Gratings
      • Transmission Gratings
      • Reflection Gratings
      • Diffractive Optical Elements
    • Polarization Optics
      • Linear Polarizers
      • Circular Polarizers
      • Waveplates
      • Retarders
      • Depolarizers
      • Polarization Rotators
      • Polarization Converters
    • Windows and Diffusers
      • Optical Windows
      • Optical Flats
      • Protective Windows
      • Optical Domes
      • Ground Glass Diffusers
      • Engineered Diffusers
  • Passive Fiber Optics 
    • Optical Fiber
      • Single Mode Fiber
      • Multimode Fiber
      • Polarization Maintaining Fiber
      • Specialty Fiber
      • Photonic Crystal Fiber
    • Fiber Components
      • Fiber Couplers
      • Fiber Splitters
      • Fiber Combiners
      • Fiber Circulators
      • Fiber Isolators
      • Fiber Collimators
      • Fiber Connectors
      • Fiber Feedthroughs
    • Fiber Assemblies
      • Fiber Patch Assemblies
      • Fiber Harnesses
      • Fiber Coupled Assemblies
      • Fiber Termination Assemblies
      • Fiber Optic Plates
  • Optical Assemblies 
    • Imaging Assemblies
    • Laser Optical Assemblies
    • Spectral Assemblies
    • Fiber Optical Assemblies
    • Custom Optical Assemblies
  • Other Passive Optics 
    • Specialty Passive Elements
      • Optical Targets
      • Calibration Optics
      • Specialty Retroreflectors
      • Specialty Optical Elements
    • Specialty Passive Modules
      • Application Specific Passive Modules
      • Other Passive Optical Modules

By Material

  • Glass
  • Fused Silica
  • Crystalline Materials
  • Semiconductor Materials
  • Optical Ceramics
  • Polymers
  • Chalcogenide Materials
  • Other Specialty Materials

By Spectral Type

  • Ultraviolet
  • Visible
  • Near Infrared
  • Short Wave Infrared
  • Mid Wave Infrared
  • Long Wave Infrared
  • Broadband

By Customer Type

  • Original Equipment Manufacturers
  • System Integrators
  • Industrial Distributors
  • Research Institutions
  • Government and Defense Organizations
  • Industrial End Users
  • Contract Manufacturers

By Sales Channel

  • Direct Sales
  • Distributor Sales
  • E-commerce Sales
  • Representative Sales
  • Program Sales

By End-Use Industry

  • Semiconductor
  • Industrial Manufacturing
  • Medical and Life Sciences
  • Aerospace and Defense
  • Automotive
  • Telecommunications
  • Data Centers
  • Consumer Electronics
  • Scientific Research
  • Machine Vision
  • Energy
  • Ophthalmic
  • Other Industrial Applications

By Region

  • North America 
    • U.S.
    • Canada
    • Mexico
  • Europe 
    • UK
    • Germany
    • France
    • Italy
    • Spain
    • Sweden
    • Denmark
    • Finland
    • Netherlands
    • Rest of Europe
  • Asia-Pacific 
    • China
    • India
    • Japan
    • South Korea
    • Taiwan
    • Indonesia
    • Vietnam
    • Australia
    • Philippines
    • Malaysia
    • Rest of APAC
  • Middle East & Africa 
    • Saudi Arabia
    • UAE
    • Egypt
    • Israel
    • Turkey
    • Nigeria
    • South Africa
    • Rest of MEA
  • Latin America 
    • Brazil
    • Argentina
    • Chile
    • Colombia
    • Rest of LATAM

Conclusion & Recommendations

The long term outlook for the Optics Market is positive, with revenue expanding from USD 72.56 Billion in 2026 to USD 128.66 Billion by 2035 at a CAGR of 6.57%. Growth will be led by fiber, infrared and data center applications, while visible spectrum elements and ophthalmic lenses provide a stable base. Asia-Pacific should add the largest absolute revenue, supported by manufacturing scale and rising infrastructure investment.

What Strategic Positioning Recommendations Does NMSC Offer?

Suppliers should prioritize multicore and high density fiber, chalcogenide and silicon infrared optics, and tested assemblies for semiconductor, medical and defense customers. Building secured material supply, regional finishing capacity and online catalog reach will improve resilience and margins. NMSC recommends partnering with system integrators early in design cycles, since qualification creates multiyear revenue visibility that catalog sales alone cannot provide.

What Is the Investment Attractiveness of the Optics Market?

Investment attractiveness is high but selective, supported by the USD 56.10 Billion growth between 2026 and 2035 and a balanced mix of cyclical and defensive demand. Passive Fiber Optics, Data Centers and Short Wave Infrared offer the best growth profiles, while mature glass lens and consumer segments favor cash generation. Investors should weigh capacity commitments and material risk against long contract visibility.

What Are the Market Shifts and Key Risks in the Optics Market?

Key shifts include the move from discrete elements to integrated assemblies, from germanium to alternative infrared materials, and from catalog buying to program based supply. Principal risks are export controls on critical materials, a semiconductor equipment downturn, delays in AI data center spending and price competition in consumer optics. Wearable AI devices could revive demand for micro lenses, though adoption timing remains uncertain.

What Are the Primary Growth Pathways Through 2035?

Primary pathways include fiber assemblies for AI networks, short and long wave infrared optics for sensing and thermal imaging, semiconductor tool optics, and defense laser systems. Emerging markets such as India at 11.43% CAGR and Saudi Arabia at 9.48% add geographic expansion, while online channels at 10.95% widen access to small buyers. Companies that combine material security with assembly capability will capture the largest share of these pathways.

FAQs

About the Author

Mayurima Roy

Mayurima Roy

Mayurima Roy is Research Analyst at Next Move Strategy Consulting, where she has spent 4 years working across the firm's full industry coverage rather than a single fixed vertical. Her work centers on structured research, ongoing trend tracking, competitive assessment, and insight-led content development, translating complex market data into clear, decision-ready narratives that support informed client decision-making across diverse global industries, market sectors, and world regions every day.

About the Reviewer

Supradip Baul

Supradip Baul

Supradip Baul is an accomplished business consultant and strategist with over a decade of rich experience in market intelligence, strategy, technology, and business transformation. His work has included rigorous qualitative and quantitative analysis across multiple industries, helping clients shape investment decisions and long-term roadmaps. Earlier in his career, he was associated with Gartner, where he contributed to industry-leading reports and market share analyses. He has worked with leading global companies and holds an MBA with a dual specialization in Marketing and Finance.

Download Free Sample

Kishu Kanda

KISHU KANDA

Strategy Analyst

Accenture

We purchased the AI Consumer Market Report from this company. Not only did they customize the report to meet our specific requirements, but they also showed great flexibility in accommodating our budget. The report we received fully met our expectations. Additionally, they provided prompt and thorough responses to both our pre-purchase and follow-up questions. We look forward to working with this company again in the future.

Rishabh Jogani

RISHABH JOGANI

Strategy Analyst

Accenture Japan

We are incredibly impressed with the market report on the real estate market in India provided by Next Move Strategy Consulting. The report was thorough, insightful, and well-structured, offering deep analysis and actionable recommendations. It not only captured the current trends and dynamics but also provided a forward-looking perspective that has been invaluable for our strategic planning. Their team demonstrated exceptional professionalism, attention to detail, and a profound understanding of the industry. The data-driven insights and clarity of presentation exceeded our expectations, making complex market trends easy to understand. We highly recommend Next Move Strategy Consulting to anyone looking for reliable and comprehensive market research services. Their expertise has given us the confidence to navigate the complexities of the Indian real estate market with clarity and foresight.

Nishant Awate

NISHANT AWATE

Business Development Global Sales

Zehnder Group Deutschland GmbH

Our experience working with Next Move Strategy Consulting was positive. The team was responsive, professional, and open to incorporating our specific requirements throughout the project. The India AHU market study was comprehensive and well structured, covering market value and volume forecasts, product and application segments, and key industry trends. The inclusion of both AHU and residential MVHR market insights made the study particularly relevant for our strategic market assessment. Overall, the report provides a solid foundation for evaluating market potential, identifying priority segments, and supporting business-development decisions in India.

Ross J Mckenzie

ROSS J MCKENZIE

Business Insight Manager

Staysure Group

“Next MSC have been incredibly helpful in providing detailed & robust information on our market, alongside quantifying growth by different segments. The process to procure was simple and easy, with sample reports and regular contact to ensure we had what we needed. Succinct detail on their sources & methodologies is also greatly received, allowing transparency in this respect helps build trust in the detail you pay for. Joseph in particular was fantastic, and helped ensure efficient provision of the insight pack – thank you NMSC!”.

Gaurav Jaiswal

GAURAV JAISWAL

Founder & CEO

Yano Charge Private Limited

The EV Charging market research report provided by the NextMSC was exceptionally detailed and insightful. It offered a comprehensive analysis that proved to be a game-changer for our strategic planning. Truly a testament to the NextMSC’s expertise and thoroughness in EV market landscape & analysis.

Custom Market Research Services

We will customize the research for you if the listed report does not fully match your requirements.

Get 30% Free Customization

Select License

This website uses cookies to ensure you get the best experience on our website. Learn more

✖