Colocation Data Centers Market Global Industry Analysis and Forecast (2026–2035)

AI workloads, hybrid cloud interconnection and hyperscale leasing lift the Colocation Data Centers Market from USD 39.00 Billion in 2025 to USD 103.00 Billion by 2035, a 10.0% CAGR from 2026–2035, with North America in front.

Download Free Sample PDF
Base Year (2025)
$39.00 Billion
Forecast (2035)
$103.00 Billion
CAGR (2026-2035)
10.0%
Top Region
North America

What Is the Colocation Data Centers Market Size?

The global Colocation Data Centers Market was valued at USD 39.00 Billion in 2025, is estimated at USD 43.70 Billion in 2026, and is forecast to reach USD 103.00 Billion by 2035, registering a 10.0% CAGR from 2026–2035. North America leads with approximately 45% share, while retail colocation holds approximately 51% of 2026 revenue.

NMSC's analysis identifies retail colocation, cloud and hyperscale providers, and North America as leading market categories based on reconciled market and segment estimates.

Colocation Data Centers Market Global Industry Analysis and Forecast (2026–2035) Revenue Forecast

Values in USD Billion

2025 $39.00 Billion
2025
2026 $43.70 Billion
2026
2027 $48.07 Billion
2027
2028 $52.88 Billion
2028
2029 $58.16 Billion
2029
2030 $63.98 Billion
2030
2031 $70.38 Billion
2031
2032 $77.42 Billion
2032
2033 $85.16 Billion
2033
2034 $93.67 Billion
2034
2035 $103.00 Billion
2035

Key Takeaways

By Colocation Type: Retail colocation is estimated to have increased from USD 20.80 billion in 2025 to USD 37.00 billion by 2035. NMSC forecasts wholesale colocation to grow faster, at a 13.4% CAGR from 2026 to 2035, overtaking retail colocation in 2027

By Service: Colocation space and power is estimated to have increased from USD 31.20 billion in 2025 to USD 79.00 billion by 2035. NMSC forecasts interconnection and network services to grow at an 11.8% CAGR from 2026 to 2035

By End User: Cloud and hyperscale providers held the largest share, expanding from USD 16.80 Billion in 2025 to USD 55.00 Billion by 2035, and is also the fastest growing at 12.1% CAGR from 2026–2035.

Dominant Region: North America accounted for approximately 45% of 2026 revenue, expanding from USD 17.55 Billion in 2025 to USD 45.80 Billion by 2035.

Fastest-Growing Region: Middle East & Africa is the fastest growing at 16.9% CAGR from 2026–2035, rising from USD 1.17 Billion in 2025 to USD 5.50 Billion by 2035.

Dominant Country: The U.S. leads with approximately 42% of 2026 revenue, expanding from USD 16.30 Billion in 2025 to USD 42.00 Billion by 2035.

Fastest-Growing Country: Saudi Arabia is the fastest growing at 18.3% CAGR from 2026–2035, rising from USD 0.27 Billion in 2025 to USD 1.50 Billion by 2035.

The Colocation Data Centers Market presents an absolute opportunity of USD 59.30 Billion between 2026 and 2035, a compelling case for patient infrastructure capital.

NMSC's analysis indicates that power availability is a key consideration in colocation site selection, alongside land availability, grid connectivity and the ability to deliver capacity on schedule.

Ecosystem Analysis

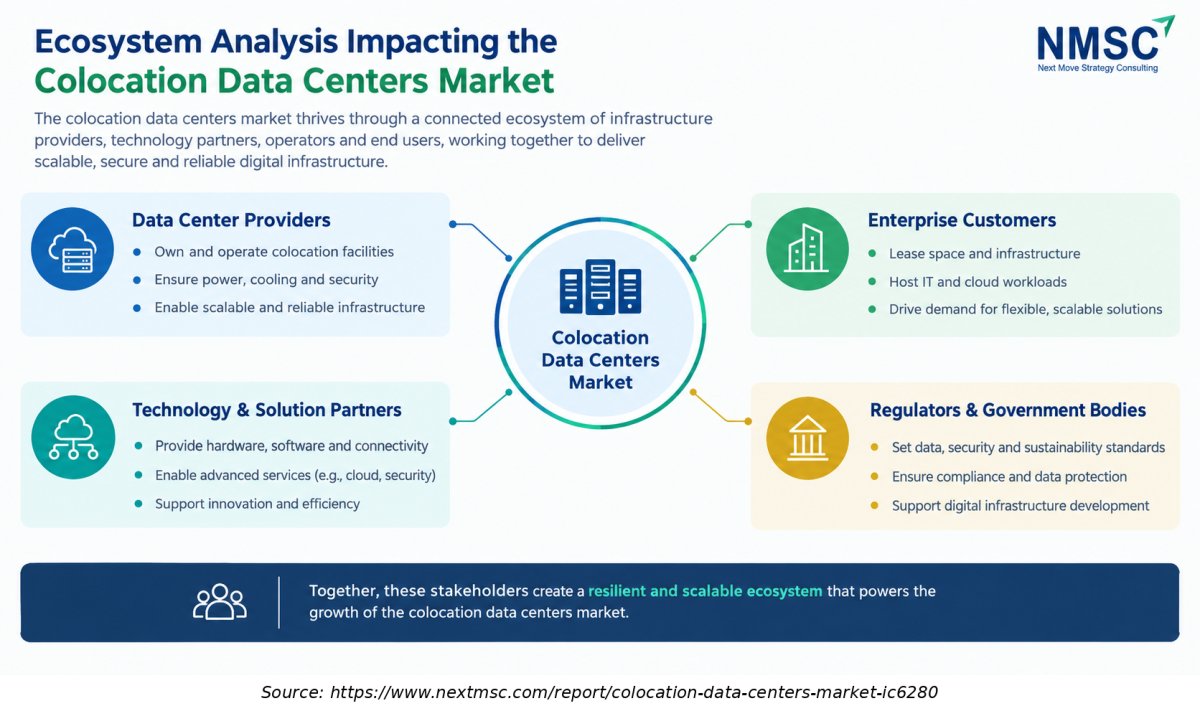
The Ecosystem Analysis infographic for the Colocation Data Centers Market highlights the key stakeholders shaping the market, including data center providers, enterprise customers, technology and solution partners, and regulators. These stakeholders work together to deliver scalable, secure, reliable, and efficient colocation infrastructure while supporting continued market growth.
What Does the Colocation Data Centers Market Encompass?
The Colocation Data Centers Market covers revenue earned by operators that lease power, space, cooling and physical security in multitenant facilities, together with the interconnection services sold inside them. Retail colocation serves cabinets and cages, while wholesale colocation serves dedicated halls and campuses leased to cloud, AI and enterprise buyers. The scope excludes cloud services, managed software and facilities owned by the user, so the datacentercolocation revenue pool stays distinct from adjacent infrastructure markets.
The regulatory environment is tightening around energy and water reporting. European operators with at least 500 kW of installed IT power must report energy, water and waste heat indicators to a common database every year, and national duties are spreading. Technology adoption is shifting toward higher rack density, liquid cooling and dedicated onsite power as operators accommodate growing AI workloads alongside conventional enterprise workloads During our market evaluation, we noticed that operators with secured grid capacity convert leases faster than peers holding larger but unpowered land banks.

Market Drivers & Dynamics

Interactive Dataset
Surging AI and hyperscale leasing driver +2.6% Global, led by North America and Asia-Pacific 2026–2032
Hybrid and multicloud interconnection demand driver +1.4% Global metros 2026–2035
Enterprise exit from owned data centers driver +0.9% North America and Europe 2026–2033
Data sovereignty and localization mandates driver +0.7% Europe, Middle East & Africa, Asia-Pacific 2026–2034
Grid delays and power scarcity restraint −1.8% North America, Europe, Asia-Pacific 2026–2031
Capital intensity and financing costs restraint −0.8% Global 2026–2030
Energy, water and heat reporting duties restraint −0.4% Europe 2026–2030
Source: Next Move Strategy Consulting

Growth Drivers

What Is the Primary Growth Driver of the Colocation Data Centers Market?

Compute demand is the primary driver of the Colocation Data Centers Market. Data center electricity use reached about 415 TWh in 2024, roughly 1.5% of world consumption, and is projected to rise to about 945 TWh by 2030 after growing near 12% a year since 2017. Colocation can capture part of the growing data center electricity demand because some cloud providers and enterprises lease powered capacity rather than build and operate all their facilities themselves. Digital Realty reported an average eight-month lag between lease signing and commencement in the fourth quarter of 2025, indicating that a material interval can exist between securing a lease and beginning to recognize rental revenue.

How Is Hybrid Cloud Interconnection Driving Colocation Data Centers Market Growth?
As cloud computing adoption widens, enterprises place private connections to several clouds inside colocation facilities. Equinix reported more than 500,000 interconnections worldwide in its full-year 2025 results. A dense interconnection ecosystem can help differentiate colocation facilities and support customer retention, although the magnitude of its effect on pricing and recurring revenue should not be quantified without further evidence.

Growth Inhibitors

What Is Restraining the Colocation Data Centers Market?

Grid access is the main restraint on the Colocation Data Centers Market. Grid-connection delays and the substantial capital requirements of new facilities can postpone commissioning, increase financing costs and constrain the timely delivery of colocation capacity. Equinix guided 2026 total capital expenditures to between USD 3.66 Billion and USD 4.16 Billion, while Digital Realty guided net development spending to between USD 3.25 Billion and USD 3.75 Billion. Delayed energization can postpone billing and reduce investment returns, even when facilities have secured preleases.

What Are the Growth Opportunities?

How Can Sovereign Cloud Requirements Create Regional Colocation Demand?

Governments and regulated industries increasingly require that data stay within national borders, which favors local operators of certified facilities. Sovereign cloud programs in Europe, the Middle East and Asia-Pacific need in country wholesale halls and retail cages, benefiting regional wholesale colocation and Middle East & Africa growth at 16.9% CAGR. Operators holding local licenses and renewable power contracts can price at a premium.

Where Does Enterprise AI Inference Create Retail Colocation Upside?

Inference workloads need low latency, private connectivity and moderate power per site, which suits metro retail facilities and every edge datacenter node. Enterprises place GPU clusters beside cloud access points rather than inside distant campuses. This benefits retail colocation and interconnection and network services, where Equinix passed 500,000 interconnections at the end of 2025. Tenants pay premiums for proximity to networks, clouds and data sources.

How Do Modular and Powered Land Strategies Open Emerging Markets?

Operators that secure powered land early and deploy standardized halls can enter new cities within months instead of years. NTT DATA acquired land to support nearly a gigawatt of planned capacity across seven markets in 2025, and Equinix added about 1GW of powered land. A modular datacenter design reduces delivery risk in Latin America and Middle East & Africa, benefiting wholesale developers with strong balance sheets.

Segmentation Analysis

2025 (USD Billion)
2035 (USD Billion)
Retail colocation 2025: $20.80 Billion | 2035: $37.00 Billion
Retail coloc
Wholesale colocation 2025: $18.20 Billion | 2035: $66.00 Billion
Wholesale co
Retail colocation $20.80 Billion $37.00 Billion 5.7%
Wholesale colocation $18.20 Billion $66.00 Billion 13.4%

Which Colocation Type Is Growing Fastest?

Retail colocation leads in 2026 with USD 22.40 Billion, or approximately 51% of revenue, because enterprises, networks and cloud access points still buy cabinets and cages in dense interconnection hubs. Wholesale colocation is the fastest growing sub segment at 13.4% CAGR from 2026–2035, overtakes retail in 2027 and reaches USD 66.00 Billion by 2035. Our analysis shows that hyperscale contracts, delivered in campuses of 100MW or more, explain this crossover.

2025 (USD Billion)
2035 (USD Billion)
Category A
Category B
Category C
Category D
Segment Item 2025 (USD Billion) 2035 (USD Billion) CAGR
Category A $10.0 USD Billion $40.0 USD Billion 25.0%
Category B $17.1 USD Billion $51.1 USD Billion 11.0%
Category C $24.2 USD Billion $62.2 USD Billion 25.0%
Category D $31.3 USD Billion $73.3 USD Billion 11.0%

Segment-wise data is locked

Unlock complete segment-wise numbers for By Service.

Unlock Full Data
2025 (USD Billion)
2035 (USD Billion)
Category A
Category B
Category C
Category D
Segment Item 2025 (USD Billion) 2035 (USD Billion) CAGR
Category A $10.0 USD Billion $40.0 USD Billion 27.0%
Category B $17.1 USD Billion $51.1 USD Billion 9.0%
Category C $24.2 USD Billion $62.2 USD Billion 19.0%
Category D $31.3 USD Billion $73.3 USD Billion 17.0%

Segment-wise data is locked

Unlock complete segment-wise numbers for By End User.

Unlock Full Data
2025 (USD Billion)
2035 (USD Billion)
Category A
Category B
Category C
Category D
Segment Item 2025 (USD Billion) 2035 (USD Billion) CAGR
Category A $10.0 USD Billion $40.0 USD Billion 14.0%
Category B $17.1 USD Billion $51.1 USD Billion 24.0%
Category C $24.2 USD Billion $62.2 USD Billion 22.0%
Category D $31.3 USD Billion $73.3 USD Billion 12.0%

Segment-wise data is locked

Unlock complete segment-wise numbers for By Region.

Unlock Full Data

Growth Opportunities

During our market evaluation, we noticed that three opportunities offer the clearest path to incremental revenue.

How Can Sovereign Cloud Requirements Create Regional Colocation Demand?

Governments and regulated industries increasingly require that data stay within national borders, which favors local operators of certified facilities. Sovereign cloud programs in Europe, the Middle East and Asia-Pacific need in country wholesale halls and retail cages, benefiting regional wholesale colocation and Middle East & Africa growth at 16.9% CAGR. Operators holding local licenses and renewable power contracts can price at a premium.

Where Does Enterprise AI Inference Create Retail Colocation Upside?

Inference workloads need low latency, private connectivity and moderate power per site, which suits metro retail facilities and every edge datacenter node. Enterprises place GPU clusters beside cloud access points rather than inside distant campuses. This benefits retail colocation and interconnection and network services, where Equinix passed 500,000 interconnections at the end of 2025. Tenants pay premiums for proximity to networks, clouds and data sources.

How Do Modular and Powered Land Strategies Open Emerging Markets?

Operators that secure powered land early and deploy standardized halls can enter new cities within months instead of years. NTT DATA acquired land to support nearly a gigawatt of planned capacity across seven markets in 2025, and Equinix added about 1GW of powered land. A modular datacenter design reduces delivery risk in Latin America and Middle East & Africa, benefiting wholesale developers with strong balance sheets.

Regional Outlook

2025 (USD Billion)
2035 (USD Billion)
North Americ
Europe
Asia-Pacific
Middle East
Latin Americ
Region 2025 (USD Billion) 2035 (USD Billion) CAGR (%)
North America $10.0 USD Billion $40.0 USD Billion 9.0%
Europe $17.1 USD Billion $51.1 USD Billion 27.0%
Asia-Pacific $24.2 USD Billion $62.2 USD Billion 25.0%
Middle East & Africa $31.3 USD Billion $73.3 USD Billion 23.0%
Latin America $38.4 USD Billion $84.4 USD Billion 12.0%

Regional data is locked

Unlock complete regional numbers for this market.

Unlock Full Data

Strategic Framework Impacting the Colocation Data Centers Market
Strategic Framework Impacting the Colocation Data Centers Market
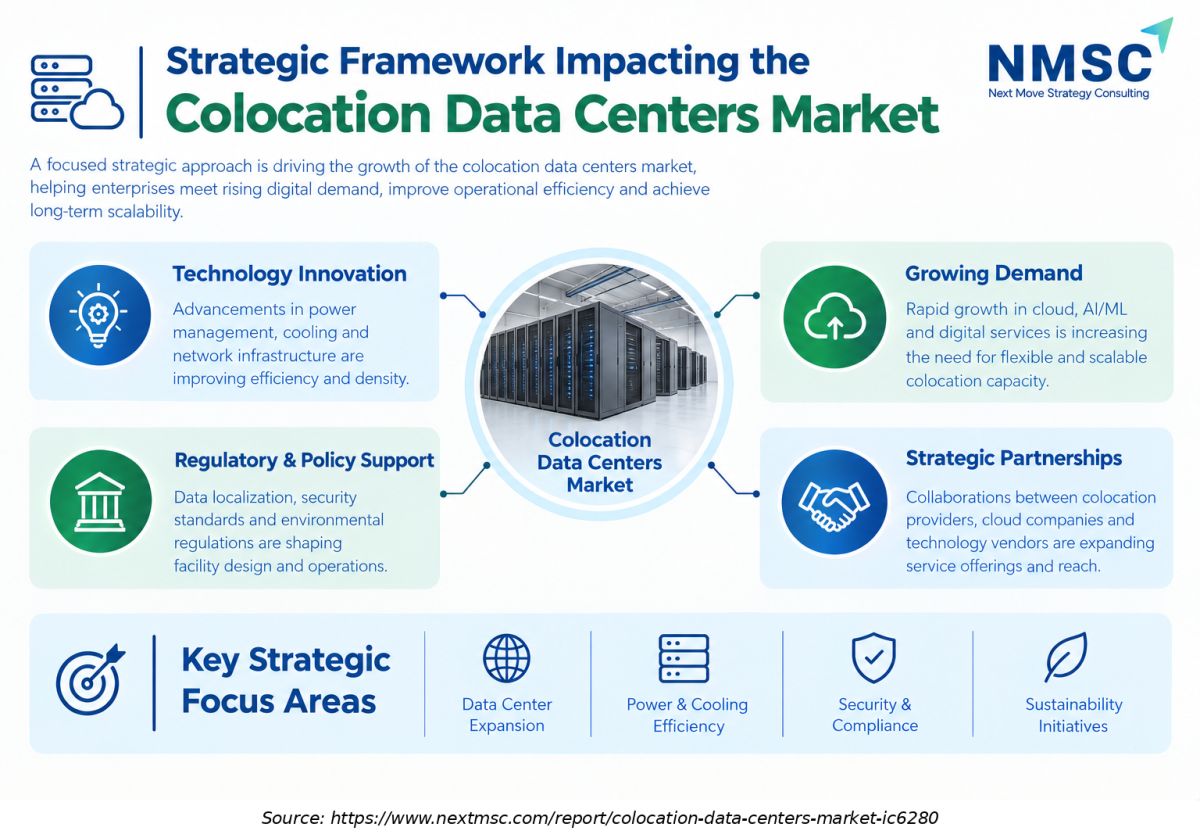
The infographic highlights the Strategic Framework Impacting the Colocation Data Centers Market, focusing on technology innovation, regulatory and policy support, rising demand for cloud and AI/ML services, and strategic partnerships. It emphasizes how data center expansion, power and cooling efficiency, security and compliance, and sustainability initiatives support operational performance, scalability, and long-term market growth.

Competitive Landscape

We found that competition is shifting from facility counts to powered capacity, interconnection density and delivery speed.

How Do Companies Compete in the Colocation Data Centers Market?

Companies compete in the Colocation Data Centers Market on powered capacity, ecosystem density, delivery speed and price. Equinix's extensive interconnection ecosystem differentiates its retail colocation offering. Digital Realty reported cash-based renewal rate increases of 6.1% in the fourth quarter of 2025, providing company-level evidence of pricing strength. Wholesale providers win on scale and speed to energization. Our analysis shows that pricing discipline holds only where power is scarce and tenants cannot easily relocate.

Which Competitor Archetypes Dominate the Industry?

Six broad competitor archetypes shape the industry: global ecosystem operators such as Equinix; wholesale platforms such as Digital Realty; telecom-backed groups such as NTT; regional operators such as GDS, VNET and NEXTDC; fund-backed platforms such as ST Telemedia Global Data Centres; and diversified infrastructure owners such as Iron Mountain and American Tower through CoreSite. Differentiation themes include interconnection density, hyperscale delivery speed, sovereign compliance and secured power.

How Do Innovation and Differentiation Strategies Differ?

Equinix's xScale joint venture structure is designed to support hyperscale capacity expansion with investment from partners, while Equinix continues to operate its broader retail colocation business. Equinix's xScale joint venture target represents planned capital deployment with institutional partners. Meanwhile, NTT DATA plans to invest over USD 10.00 Billion through 2027 to expand AI-ready colocation capacity. NEXTDC's fiscal 2027 capital expenditure outlook reflects planned commitments (in AUD) focused on delivering contracted hyperscale capacity. We observed that differentiation increasingly means delivering liquid cooled halls on time.

What M&A Activity Is Shaping the Colocation Data Centers Market?

Transactions focus on platforms with power and backlog. On February 4, 2026, KKR and Singtel announced a definitive agreement to acquire the remaining 82% stake in ST Telemedia Global Data Centres for approximately USD 5.10 billion in cash consideration. Digital Realty agreed to acquire the Telco Hub 1 data center in Cyberjaya, Malaysia, entered Portugal and formed a joint venture in Israel. Equinix continued its aggressive capital expansion program in 2025, prioritizing real estate acquisitions and facility expansions across key metropolitan hubs in Asia and Southern Europe.

Key Market Players

Our analysis shows that nine verified companies shape global supply, ranked on verifiable colocation revenue and operating scale.

Equinix, Inc. Digital Realty Trust, Inc. Nippon Telegraph and Telephone Corporation GDS Holdings Limited VNET Group, Inc. American Tower Corporation ST Telemedia Global Data Centres Iron Mountain Incorporated NEXTDC Limited

Latest Developments

NMSC’s analysis indicates that capital raising, large leases and acquisitions defined the period from December 2025 to August 2026.

Date Event
04 Dec 2025 NTT DATA announced agreements with leading hyperscale cloud providers totalling more than 130MW across its Chicago, Dallas, Phoenix and Virginia campuses.
16 Mar 2026 VNET reported record deliveries of 404MW in 2025 and 135MW of new wholesale orders in the fourth quarter.
27 Aug 2026 NEXTDC reported record fiscal 2026 contracted utilisation of 740.1MW and guided fiscal 2027 net revenue growth above 50%.

Expert Insights

Pat Lynch

Executive Managing Director | CBRE Data Center Solutions

"Occupiers are having to secure space earlier, take what’s available from a capacity standpoint and prioritize markets with dependable power to support long-term growth."

Analyst Interpretation

The statement highlights how electricity availability and limited facility capacity are influencing colocation site selection. Enterprises increasingly need to secure capacity ahead of deployment, while providers must coordinate grid access, infrastructure expansion and construction schedules. Locations with dependable power and scalable facilities are therefore becoming strategically important for both operators and customer

Investment Opportunities

Where Are Capital Inflows Concentrating in the Colocation Data Centers Market?

Capital is flowing toward platforms with contracted backlog. NEXTDC reported approximately A$9.75 billion in capital commitments arranged since August 2025. KKR and Singtel announced an agreement involving approximately USD 5.10 billion in cash consideration for STT GDC, while Equinix's xScale joint venture plans substantial capital deployment with partners. These figures represent different types of commitments and transactions and should not be treated as equivalent amounts of capital raised or spent. Our assessment indicates that investors in datacenterinfrastructure Favor operators with signed hyperscale leases, secured power and access to private credit, because these features de risk returns in the Colocation Data Centers Market.

How Is Infrastructure Investment Shifting Toward Powered Land and Grid Access?

Developers are paying for power first and buildings second. Equinix added approximately 1GW of powered land in 2025, and Digital Realty guided net development spending between USD 3.25 Billion and USD 3.75 Billion with stabilized yields above 10%. Battery energy storage and onsite generation shorten energization timelines where grids lag, and we observed that tenants now treat such resilience as a lease criterion.

What ESG Considerations Influence Colocation Investment Decisions?

Reporting duties in Europe now require annual disclosure of energy, water and waste heat from facilities with at least 500 kW of IT power, and half of data center demand growth is expected to be met by renewables. Investors therefore screen for green data credentials, including efficiency, water use and clean power contracts. Our findings suggest that operators with verified low carbon supply earn tenant preference and lower financing costs.

Key Benefits for Stakeholders

How Does the Report Help Enterprise and Cloud Buyers of Colocation Capacity?

Buyers gain a segment level view of pricing power, regional capacity and delivery risk across the Colocation Data Centers Market. The forecasts show where wholesale supply will tighten and where interconnection rich retail space keeps premiums, helping procurement teams time commitments and negotiate renewals. Country analysis highlights markets where power or regulation could delay delivery, supporting sourcing decisions for AI and cloud workloads.

How Does the Report Help Investors and Financial Analysts?

Investors receive reconciled 2025, 2026 and 2035 values, segment CAGRs and a matrix of drivers and restraints with estimated impact on growth. The competitive analysis separates scale operators from regional leaders and flags transaction patterns, while the opportunity sizing of USD 59.30 Billion between 2026 and 2035 frames capital allocation. Analysts can benchmark company disclosures against our market projections.

How Does the Report Help Operators, Developers and Technology Vendors?

Operators and vendors can identify the regions, end users and services with the fastest growth, including wholesale colocation at 13.4% CAGR and Middle East & Africa at 16.9% CAGR. The analysis of cooling, power and interconnection trends guides product roadmaps, while competitive archetypes and recent developments show how peers finance and deliver capacity.

Key Market Segments Evaluated

By Colocation Type

  • Retail colocation
  • Wholesale colocation

By Service

  • Colocation space and power
  • Interconnection and network services

By End User

  • Cloud and hyperscale providers
  • Enterprises
  • Network and content providers

By Region

  • North America 
    • U.S.
    • Canada
    • Mexico
  • Europe 
    • UK
    • Germany
    • France
    • Italy
    • Spain
    • Sweden
    • Denmark
    • Finland
    • Netherlands
    • Rest of Europe
  • Asia-Pacific 
    • China
    • India
    • Japan
    • South Korea
    • Taiwan
    • Indonesia
    • Vietnam
    • Australia
    • Philippines
    • Malaysia
    • Rest of APAC
  • Middle East & Africa 
    • Saudi Arabia
    • UAE
    • Egypt
    • Israel
    • Turkey
    • Nigeria
    • South Africa
    • Rest of MEA
  • Latin America 
    • Brazil
    • Argentina
    • Chile
    • Colombia
    • Rest of LATAM

Conclusion & Recommendations

Revenue should more than double over the forecast period, climbing at a 10.0% annual pace as AI, cloud and sovereignty needs lift leased capacity. We observed that wholesale colocation overtakes retail in 2027 and holds approximately 64% of revenue by 2035, while interconnection and network services grow faster than space and power. Growth stays resilient because tenants commit to multiyear leases and power constrained supply limits new entrants.

What Strategic Positioning Recommendations Does NMSC Offer?

NMSC recommends that operators secure powered land and utility capacity before announcing campuses, preserve interconnection density in metro retail sites, and use joint ventures or private credit to recycle capital. Buyers should sign renewals early in constrained metros and diversify across regions. Vendors should design for liquid cooling and onsite power by default, since these features now decide AI tenant selection.

What Is the Investment Attractiveness of the Colocation Data Centers Market?

Attractiveness is high because contracted backlog, rising renewal rates and development yields above 10% support returns. The USD 59.30 Billion revenue opportunity between 2026 and 2035 is backed by signed hyperscale leases at NEXTDC, NTT DATA and Digital Realty. Our analysis shows that returns are best where power is secured and weakest where energization depends on uncertain grid queues.

What Are the Market Shifts and Key Risks in the Colocation Data Centers Market?

The main shifts are the move from retail to wholesale leasing, the rise of AI density and the growing role of sovereign capacity. Key risks include grid delays, capital intensity, customer concentration among hyperscale tenants and regulatory reporting costs. Electricity demand scenarios for 2035 range from 700 to 1,700 TWh, so demand volatility is a real downside that disciplined operators should price.

What Are the Primary Growth Pathways Through 2035?

Four pathways dominate: AI campuses on powered land, hybrid cloud interconnection in metro hubs, sovereign capacity in Europe, the Middle East and Asia-Pacific, and modular entry into emerging markets. Middle East & Africa and Latin America grow fastest from small bases, while North America adds the most absolute revenue. Operators that combine these pathways with disciplined capital recycling should outgrow the market.

Delivered Customizations

We have successfully delivered the following deep-dive customizations:

Client Request Customization Delivered Value Adds
Historical Colocation Market Growth Analysis
  • Historical colocation revenue and leased-capacity analysis by colocation type, service, end user, and region.
  • Identifies the fastest-growing colocation segments and regions to guide entry and expansion timing.
Company-Level Service Revenue Mix Analysis
  • Operator-level revenue split across colocation, interconnection, and managed services, based on disclosed segment and regional filings.
  • Shows where leading operators earn recurring revenue and which service lines to prioritize or partner into.
Company-Level Capacity Leasing Analysis
  • Operator-level leased and operational capacity benchmarking (MW, racks, utilization) by colocation type and region.
  • Highlights capacity leasing share and utilization gaps to inform capacity investment and pricing strategy.
Hyperscale Capacity Pipeline and Grid Availability Assessment
  • Mapping of under-construction and planned wholesale and hyperscale MW against regional grid interconnection timelines.
  • Flags regions with near-term capacity supply gaps and power-constrained markets for site selection decisions.
Interconnection Ecosystem and End-User Demand Mapping
  • Interconnection density and cloud on-ramp presence mapped against end-user verticals such as BFSI, IT and telecom, cloud, healthcare, and government.
  • Pinpoints vertical demand clusters and ecosystem hubs that support premium pricing and customer acquisition.
Energy Cost and Sustainability Compliance Benchmarking
  • Regional industrial electricity prices and data center energy-efficiency reporting requirements benchmarked across key colocation markets.
  • Quantifies operating-cost advantages and compliance risks to guide regional expansion and sourcing decisions.

FAQs

Sources & References

1.

Equinix, Inc. fourth quarter and full year 2025 results release

newsroom.equinix.com
2.

Digital Realty fourth quarter 2025 results (SEC Form 8-K)

sec.gov
3.

Iron Mountain fourth quarter 2025 results (SEC Form 8-K)

sec.gov
4.

GDS Holdings fourth quarter and full year 2025 results

gdsholdingsltd.gcs-web.com/zh-hans/node/12286
5.

VNET Group fourth quarter and full year 2025 results (SEC Form 6-K)

sec.gov
6.

NEXTDC FY26 results (ASX release, 27 August 2026)

announcements.asx.com.au
7.

NTT DATA hyperscale agreements release (4 December 2025)

nttdata.com
8.

NTT DATA land acquisitions release (13 May 2025)

nttdata.com
9.

Singtel and KKR announcement of STT GDC acquisition (SGX, 4 February 2026)

links.sgx.com
10.

ST Telemedia Global Data Centres newsroom

sttelemediagdc.com
11.

American Tower Corporation second quarter 2025 results (SEC Form 8-K)

sec.gov
12.

International Energy Agency, Energy and AI

iea.org
13.

Lawrence Berkeley National Laboratory, 2024 United States Data Center Energy Usage Report

datacenters.lbl.gov
14.

Congressional Research Service, Data Centers and Their Energy Consumption (R48646)

congress.gov
15.

European Commission Delegated Regulation (EU) 2024/1364 (EUR-Lex)

eur-lex.europa.eu
16.

Swedish Energy Agency, data centers energy performance reporting

energimyndigheten.se

About the Author

Mayurima Roy

Mayurima Roy

Mayurima Roy is Research Analyst at Next Move Strategy Consulting, where she has spent 4 years working across the firm's full industry coverage rather than a single fixed vertical. Her work centers on structured research, ongoing trend tracking, competitive assessment, and insight-led content development, translating complex market data into clear, decision-ready narratives that support informed client decision-making across diverse global industries, market sectors, and world regions every day.

About the Reviewer

Supradip Baul

Supradip Baul

Supradip Baul is an accomplished business consultant and strategist with over a decade of rich experience in market intelligence, strategy, technology, and business transformation. His work has included rigorous qualitative and quantitative analysis across multiple industries, helping clients shape investment decisions and long-term roadmaps. Earlier in his career, he was associated with Gartner, where he contributed to industry-leading reports and market share analyses. He has worked with leading global companies and holds an MBA with a dual specialization in Marketing and Finance.

Download Free Sample

Semih Kavaklioglu

SEMIH KAVAKLIOGLU

Co-Founder & Sales Manager

Decortie

I work a lot in the marketing industry and I know that research is an essential part of any campaign. I have used Market research reports for my own products and I found them to be very informative and well-researched. The team here produces insightful reports for a good price

Rishabh Jogani

RISHABH JOGANI

Strategy Analyst

Accenture Japan

We are incredibly impressed with the market report on the real estate market in India provided by Next Move Strategy Consulting. The report was thorough, insightful, and well-structured, offering deep analysis and actionable recommendations. It not only captured the current trends and dynamics but also provided a forward-looking perspective that has been invaluable for our strategic planning. Their team demonstrated exceptional professionalism, attention to detail, and a profound understanding of the industry. The data-driven insights and clarity of presentation exceeded our expectations, making complex market trends easy to understand. We highly recommend Next Move Strategy Consulting to anyone looking for reliable and comprehensive market research services. Their expertise has given us the confidence to navigate the complexities of the Indian real estate market with clarity and foresight.

Melanie Samko

MELANIE SAMKO

Director of Marketing

TOSOH BIOSCIENCE, INC.

The information provided by NMSC is incredibly valuable, thank you so much for such a excellent work. I really appreciate it. I will make sure to reference all of it, in my summary document.

Mohit Agarwal

MOHIT AGARWAL

Chief Manager

DryChem India Pvt. Ltd.

Next Move Strategy Consulting is an amazing team of consultants. We required a market study report for our investors on top priority and the team went above and beyond our expectations to deliver the same with ample supporting data within a short time span enabling us to secure the investments and keep our project timeline maintained. Their professionalism, attention to detail, and timely delivery of actionable recommendations have left a lasting impression on our organization.

Pratyush Kumar Das

PRATYUSH KUMAR DAS

Assistant Manager

Polycab India Limited

We would like to express our appreciation for the data and insights provided by nextmsc. We are very pleased with the quality and depth of the information, which has proven to be highly valuable and beneficial for our business decision-making.

Custom Market Research Services

We will customize the research for you if the listed report does not fully match your requirements.

Get 30% Free Customization

Select License

This website uses cookies to ensure you get the best experience on our website. Learn more

✖